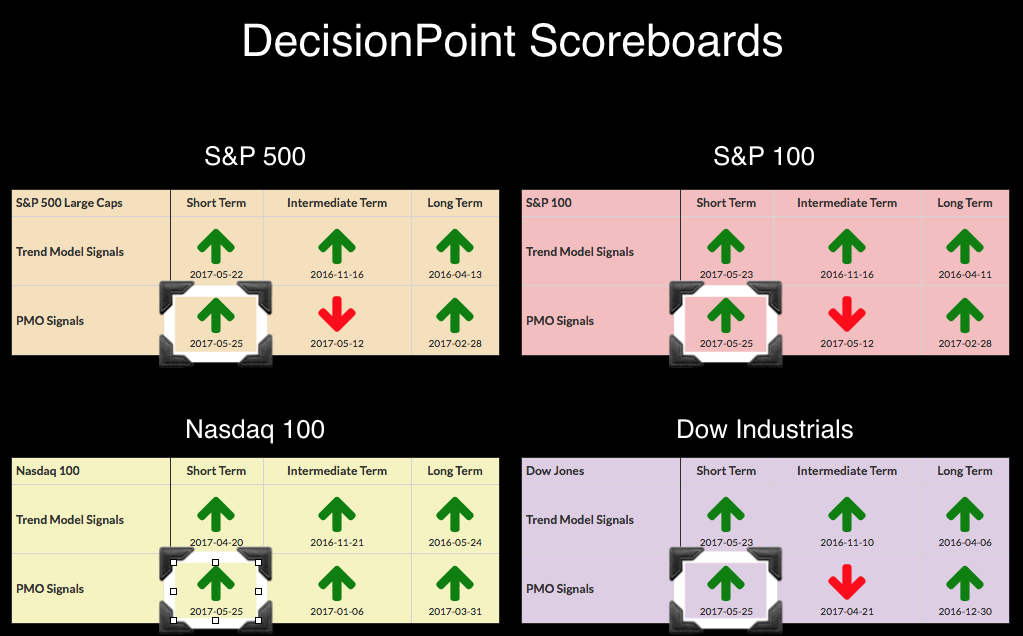
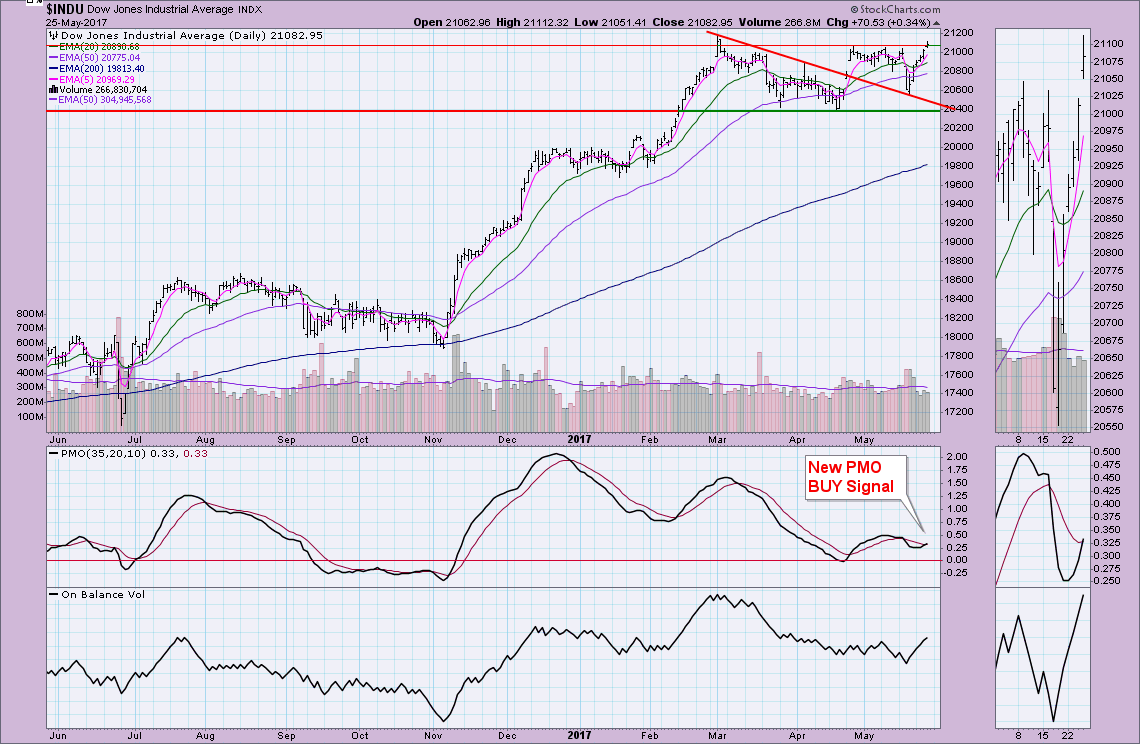
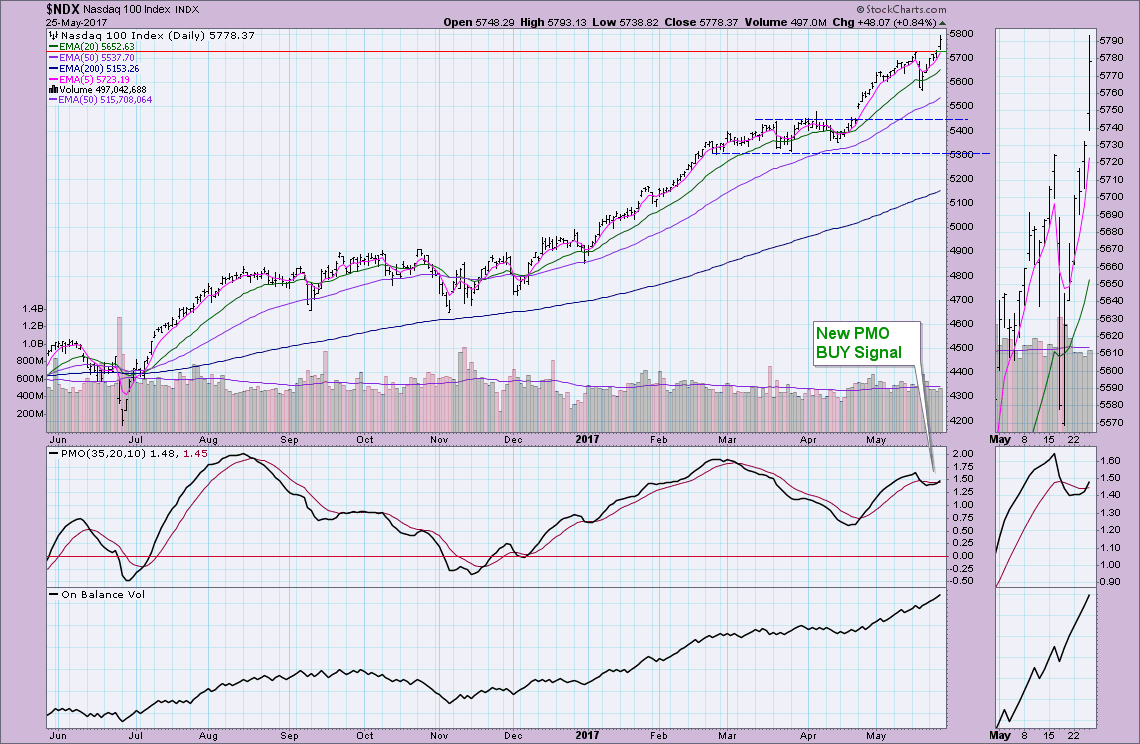
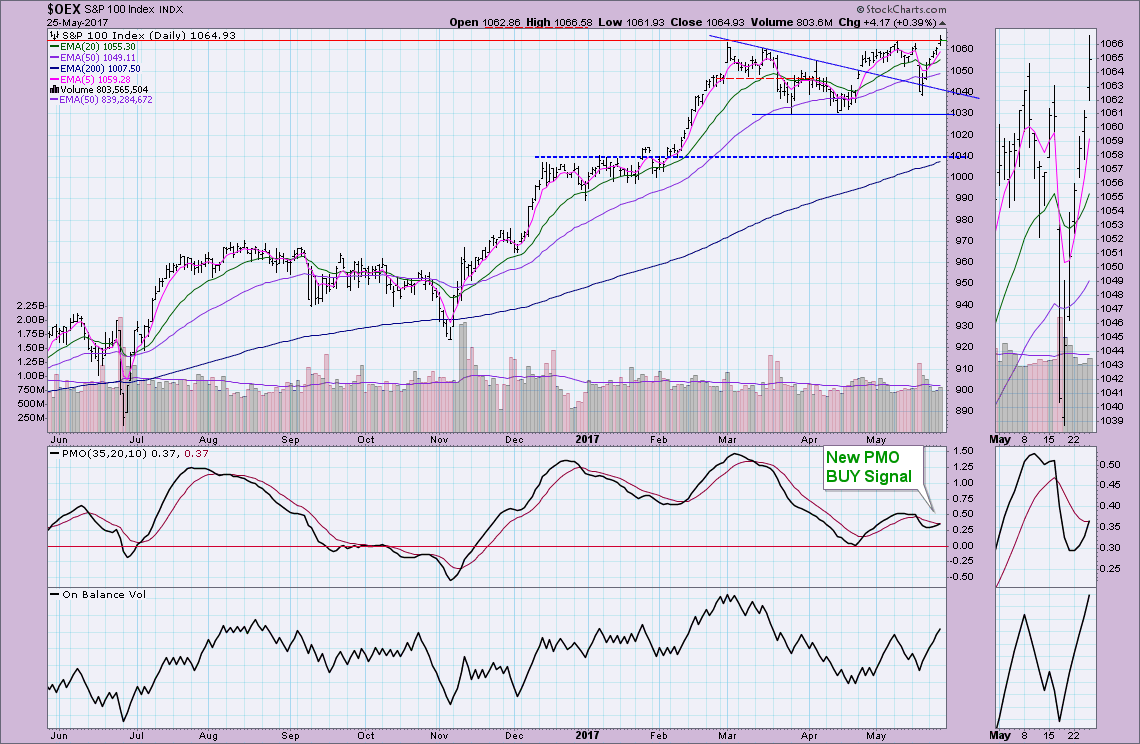
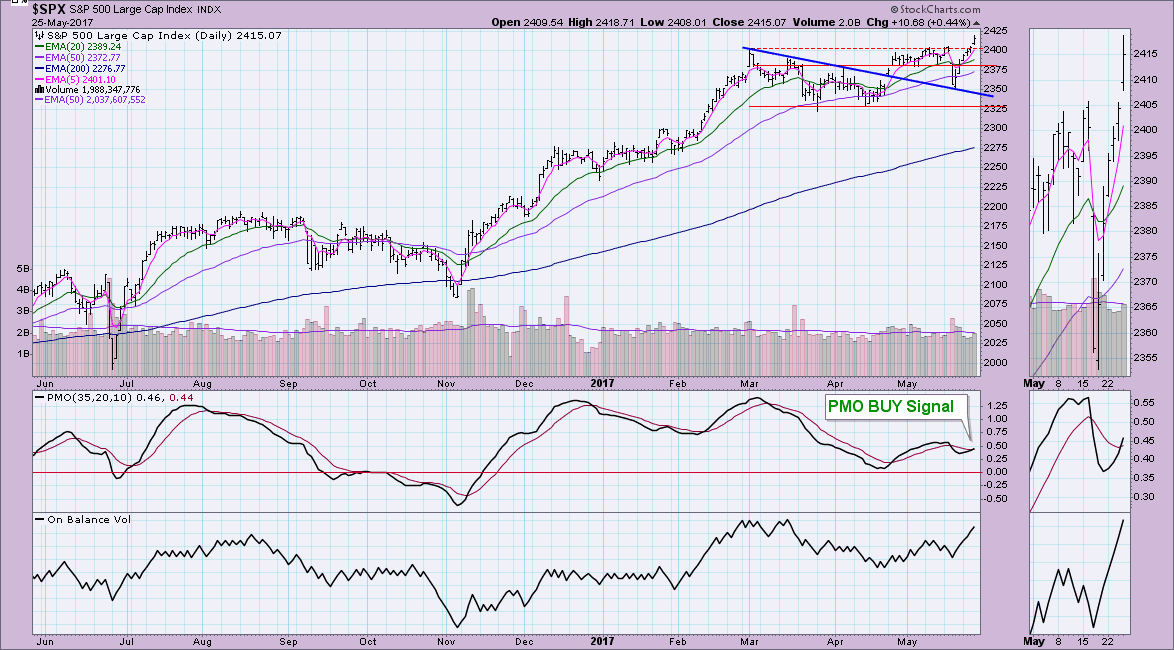
 As noted in the DP Scoreboard Summary below, all four major indexes triggered PMO BUY Signals today as the PMO crossed above its signal line. This certainly confirms the ST Trend Model BUY signals that appeared after yesterday's strong rally. You'll note in their charts below that all made new intraday all-time highs. These breakouts above overhead resistance are impressive and do suggest we could see continued follow-through. Remember you can reach these charts anytime in the DP shared ChartList. The link is at the top of our blog.
The purpose of the DecisionPoint Alert Daily Update is to quickly review the day's action, internal condition, and Trend Model status of the broad market (S&P 500), the nine SPDR Sectors, the U.S. Dollar, Gold, Crude Oil, and Bonds. To ensure that using this daily reference will be quick and painless, we are as brief as possible, and sometimes we let a chart speak for itself.
SIGNALS: Here we include charts of any important signal changes triggered today by our Intermediate-Term Trend Model.
No new ITTM signals to report.
NOTE: Mechanical trading model signals define the implied bias of the price index based upon moving average relationships, but they do not necessarily call for a specific action. They are information flags that should prompt chart review. Further, they do not call for continuous buying or selling during the life of the signal. For example, a BUY signal will probably return the best results if action is taken soon after the signal is generated. Additional opportunities for buying may be found as price zigzags higher, but the trader must look for optimum entry points. Conversely, exit points to preserve gains (or minimize losses) may be evident before the model mechanically closes the signal.
STOCKS
IT Trend Model: BUY as of 11/15/2016
LT Trend Model: BUY as of 4/1/2016
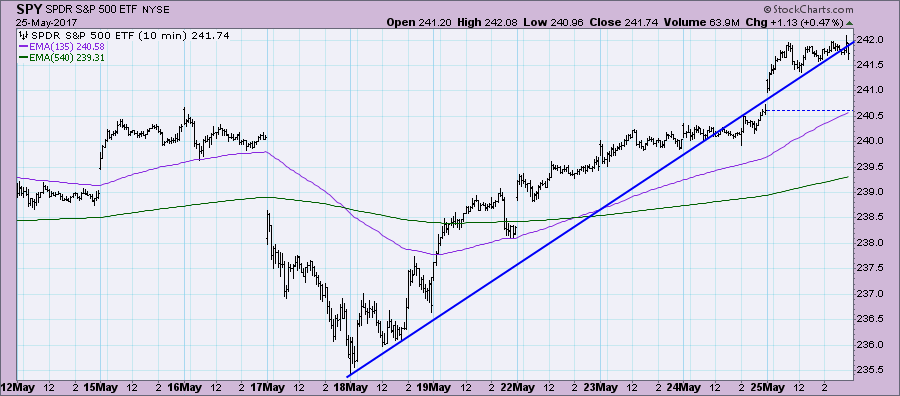
The 10-minute bar chart reflects consolidation after the breakout to new all-time highs.
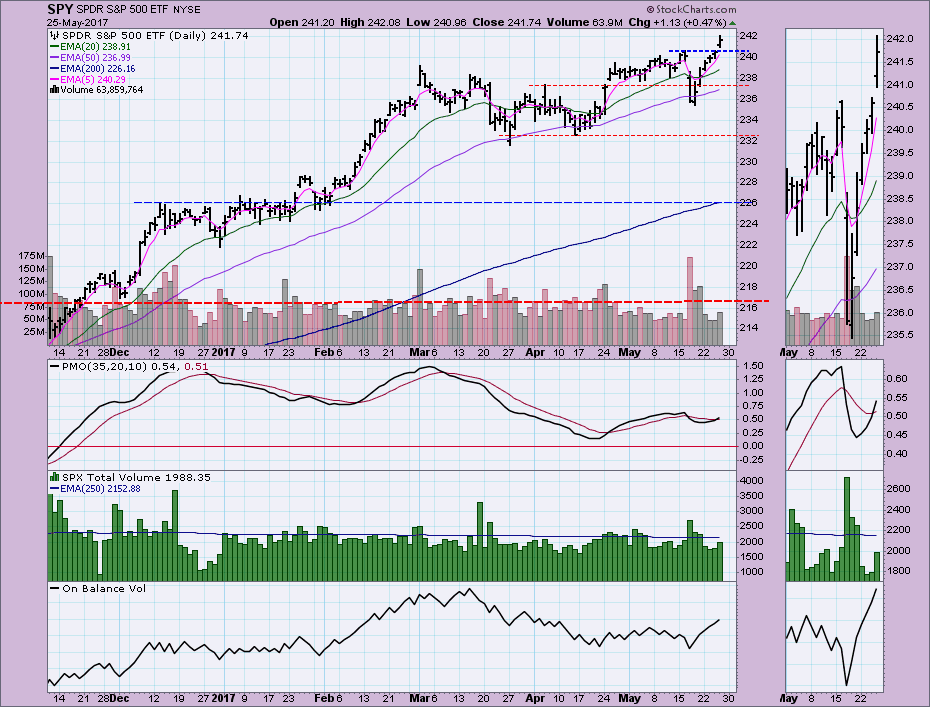
Trading completely above resistance at all-time highs, the SPY pulled the PMO above its signal line to trigger a BUY signal on the SPY. The breakout occurred on slightly higher volume than yesterday, but it was below average. I have concerns that price will hold above this new area of support and one reason is that less than impressive volume pattern.
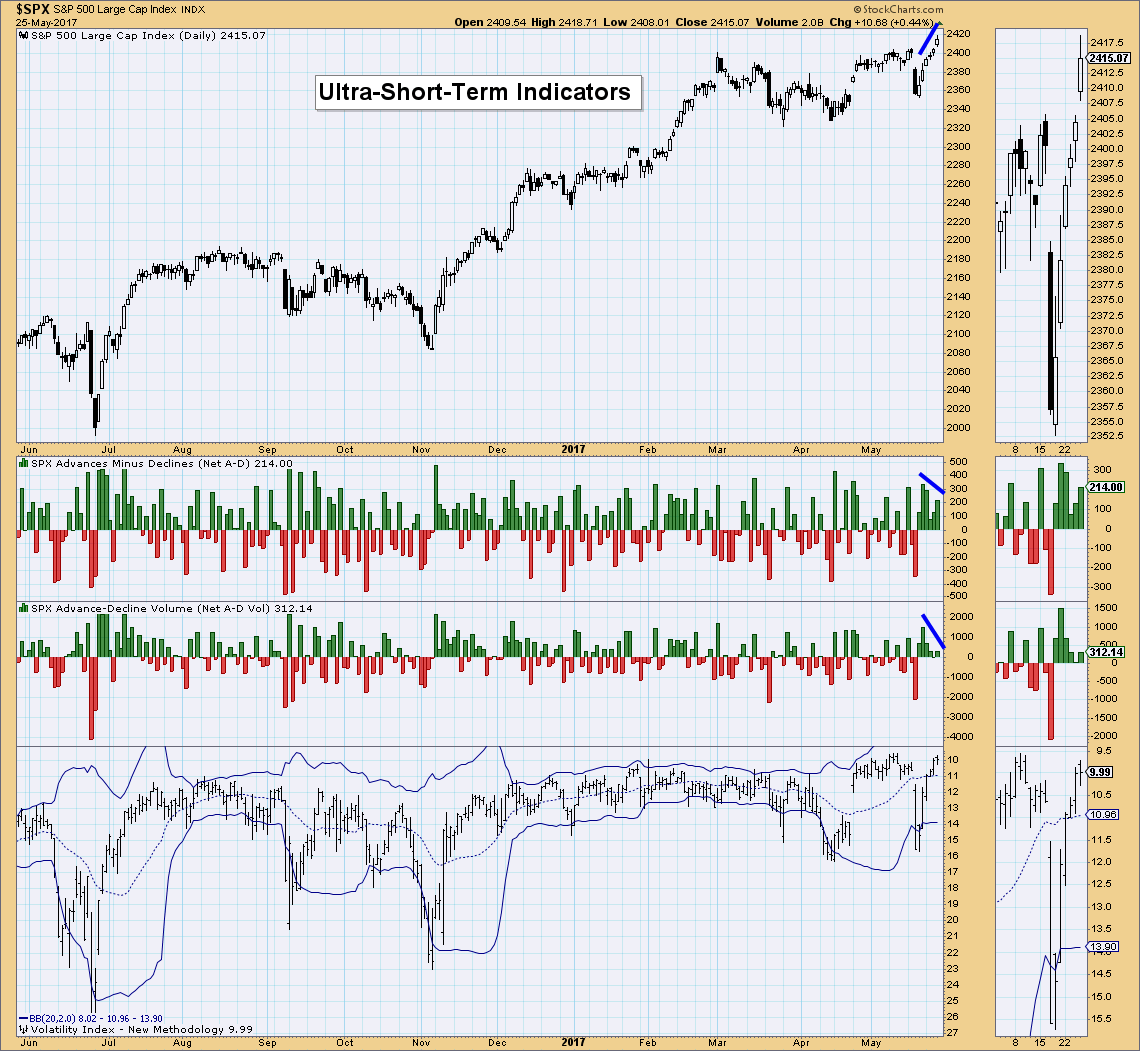
Ultra-Short-Term Indicators: Another concern are the negative divergences on breadth. This is pretty ugly folks. The VIX is above average on the inverted scale which suggests bullish complacency. That's very dangerous if their isn't volume to support the continuation of a rally.
Short-Term Indicators: These indicators are rising very strongly which is generally bullish, but they are now very overbought. How do these indicators typically decompress? They relieve overbought conditions typically with a price decline; however, you'll note that the last top moved lower as price consolidated sideways.
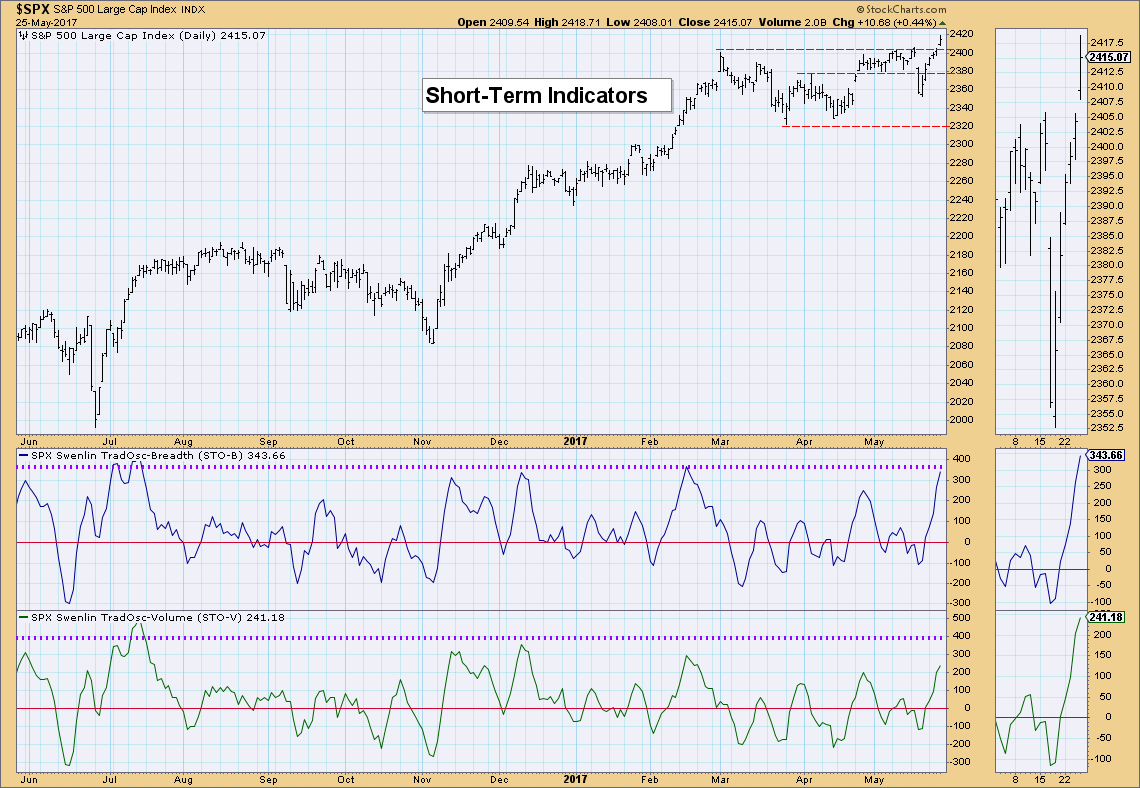
Intermediate-Term Indicators: These indicators are mixed. The ITBM and ITVM are rising nicely after positive crossovers their signal lines. That's very bullish since they are in positive yet neutral territory. There's plenty of room for them to climb higher. My concern is the current PMO negative divergence marked in purple. Note what previous negative divergences portended.
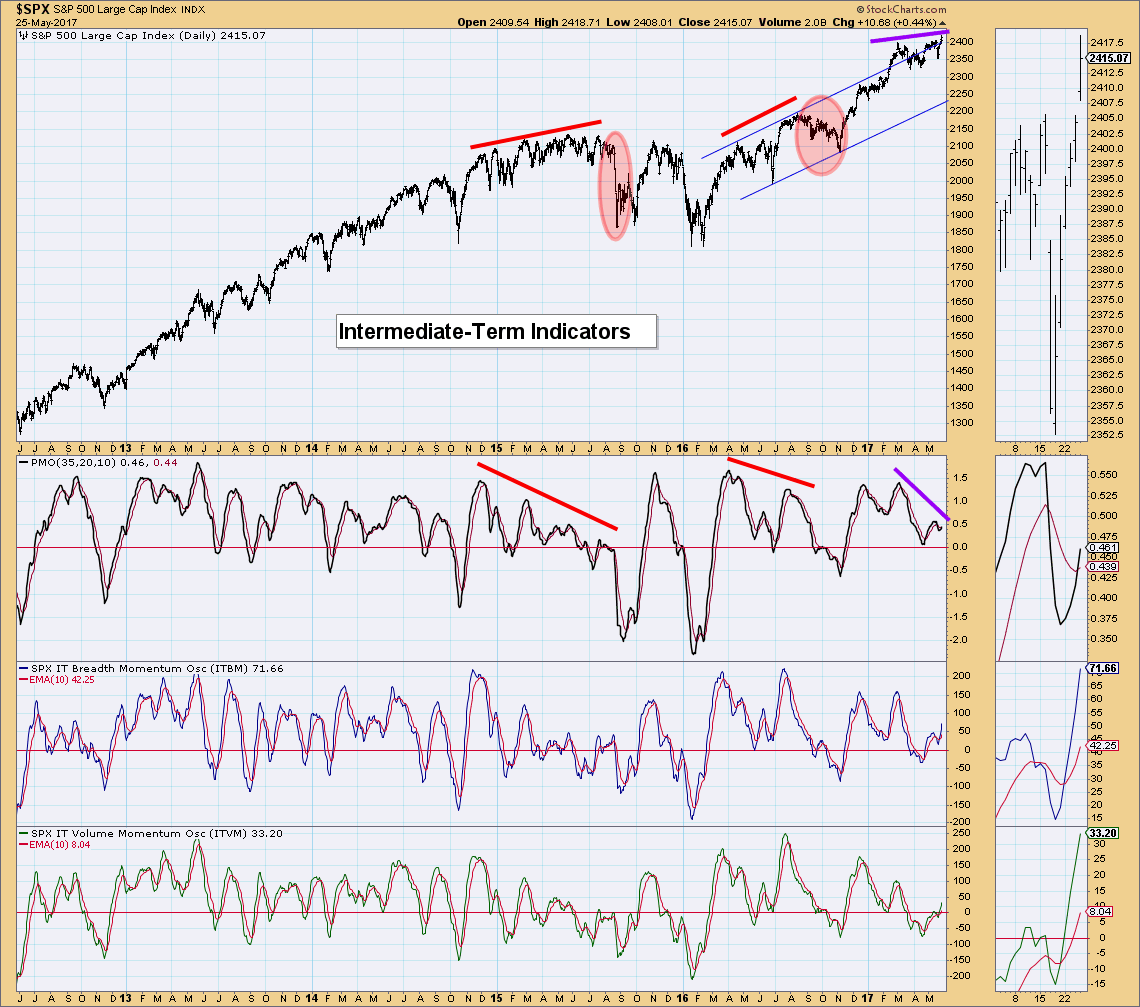
Conclusion: There certainly could be some follow-through on this rally given the new PMO BUY signals across the board. However, volume patterns and PMO negative divergences suggest a near-term pullback or drop.
DOLLAR
IT Trend Model: NEUTRAL as of 3/21/2016
LT Trend Model: BUY as of 10/17/2016
As noted in today's headline, UUP triggered a new Long-Term Trend Model SELL signal. This occurred when the 50-EMA crossed below the 200-EMA. When the 50-EMA is below the 200-EMA, DecisionPoint analysis tells us that stock, ETF, etc. is in a bear market. This comes at a time when price has just bounced off support. Indicators are bearish with the PMO and OBV declining, and very low SCTR ranking.
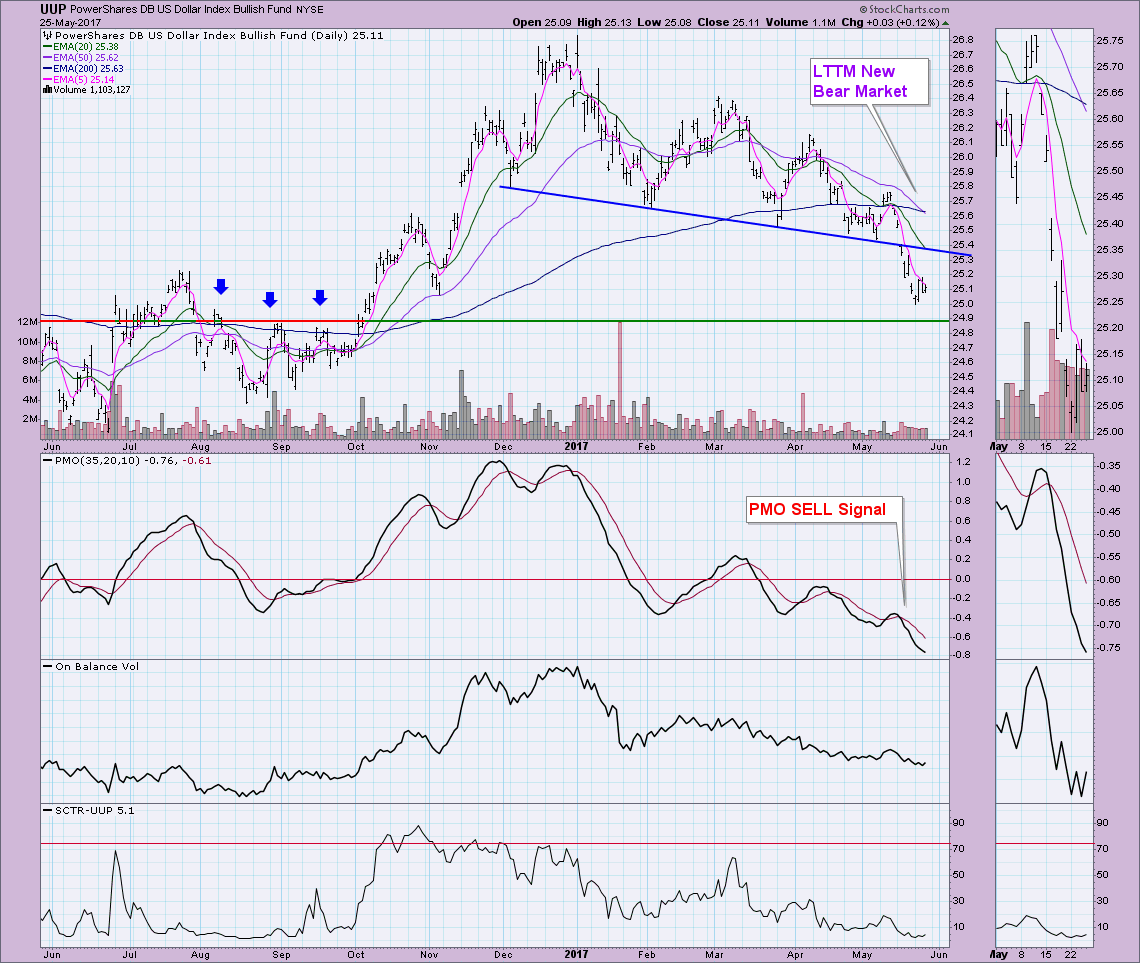 One bullish piece of news is that the PMO is very oversold right now. This bounce off horizontal support could mean a price reversal. At this point the PMO isn't really decelerating. When that happens it will be time to start looking for a good price bottom.
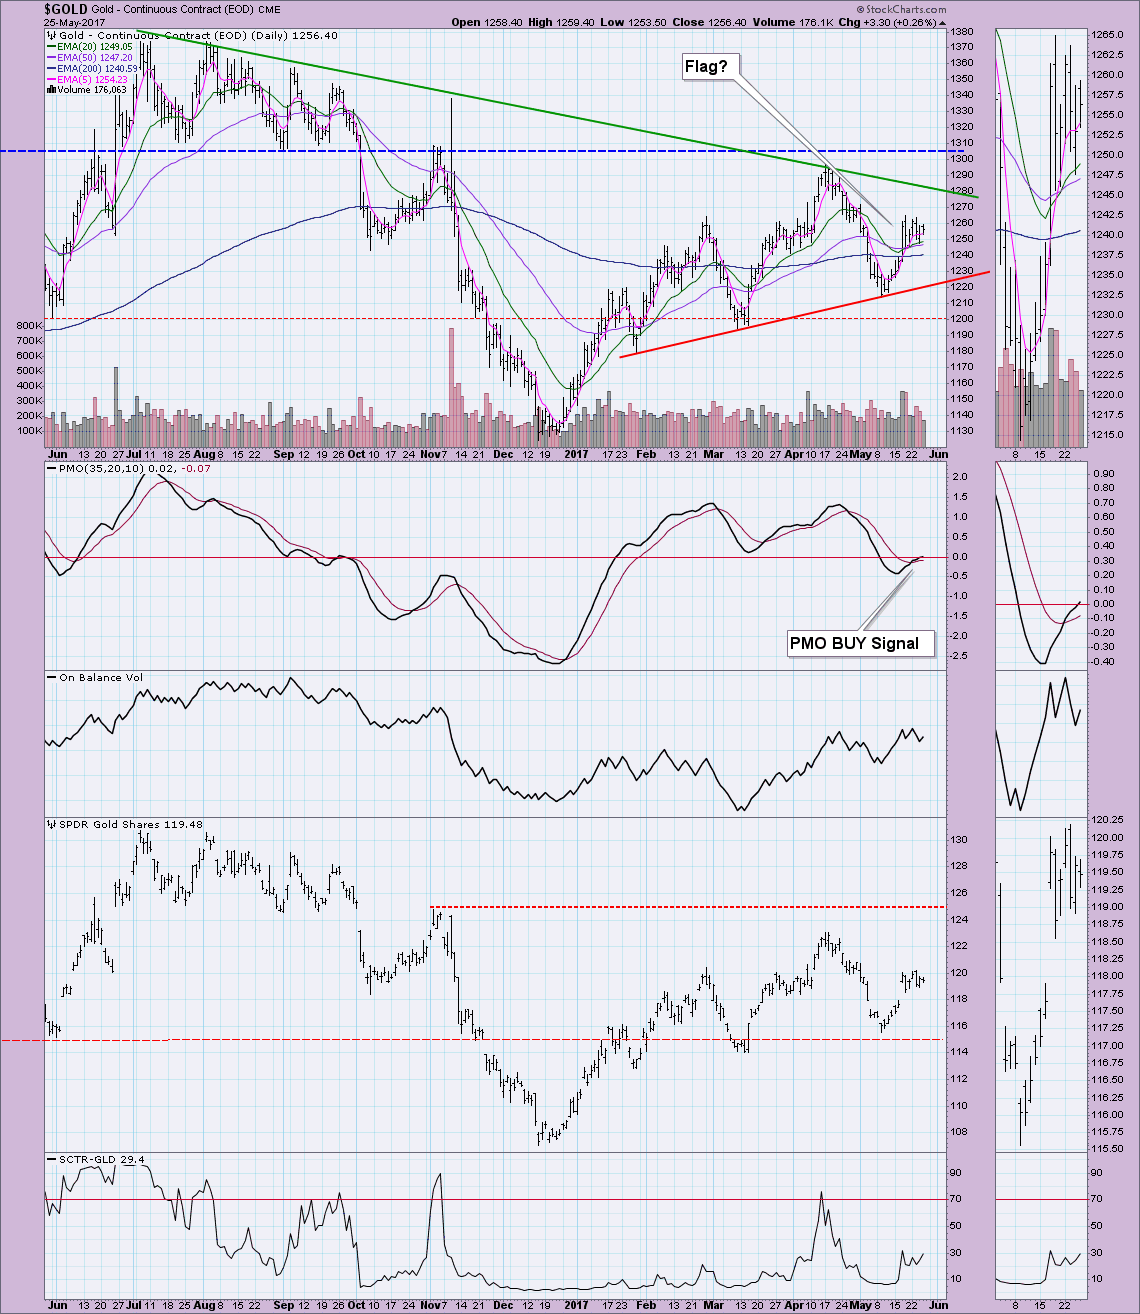
GOLD
IT Trend Model: BUY as of 5/22/2017
LT Trend Model: BUY as of 4/12/2017
If the Dollar continues lower, that would help Gold which seems to have stalled at the $1280 level. I like that the PMO BUY signal is still intact even with consolidation. The latest price action could be a nice flagpole with pennant. I especially like these patterns because the pennant is reminiscent of a symmetrical triangle. Those triangles are continuation patterns typically, meaning previous price action should prevail. Put that on a flagpole and you get another positive sign. Looking at GLD, however and I see a possible island reversal pattern. That would suggest a buying exhaustion. The PMO is our warning shot. If it can't maintain its rise and turns over, I'd look for a pullback; otherwise, I'm still quite bullish on Gold.
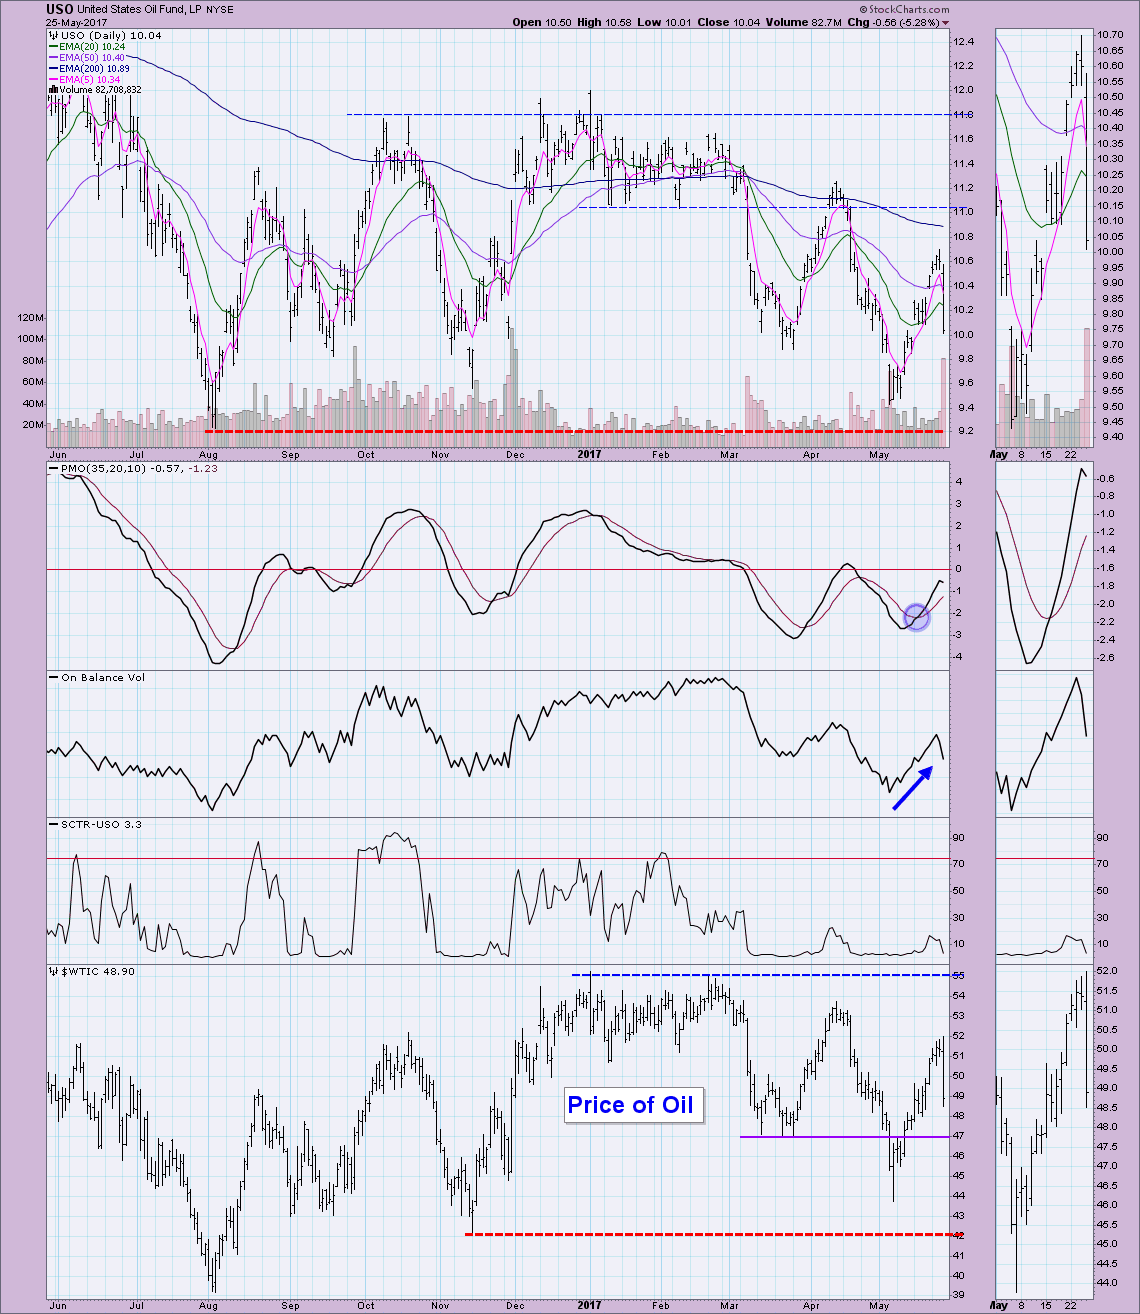
CRUDE OIL (USO)
IT Trend Model: NEUTRAL as of 3/8/2017
LT Trend Model: SELL as of 3/9/2017
Oil took a dive as investors weren't happy with the news that global oil producers would not be cutting back production any further, basically extending the current "glut" in the marketplace. Technically this decline was not really anticipated. Indicators had continued to look good, with the STTM generating a BUY signal last week. However, looking at price action, the last gap turned out to be an exhaustion gap that was filled instantly with today's crash. The previous gap around $10 was also closed. The PMO, of course, topped and OBV was hit especially hard with the spectacular volume on this decline. This extreme decline has the earmarks of a selling initiation. I'd look for continued lower prices.
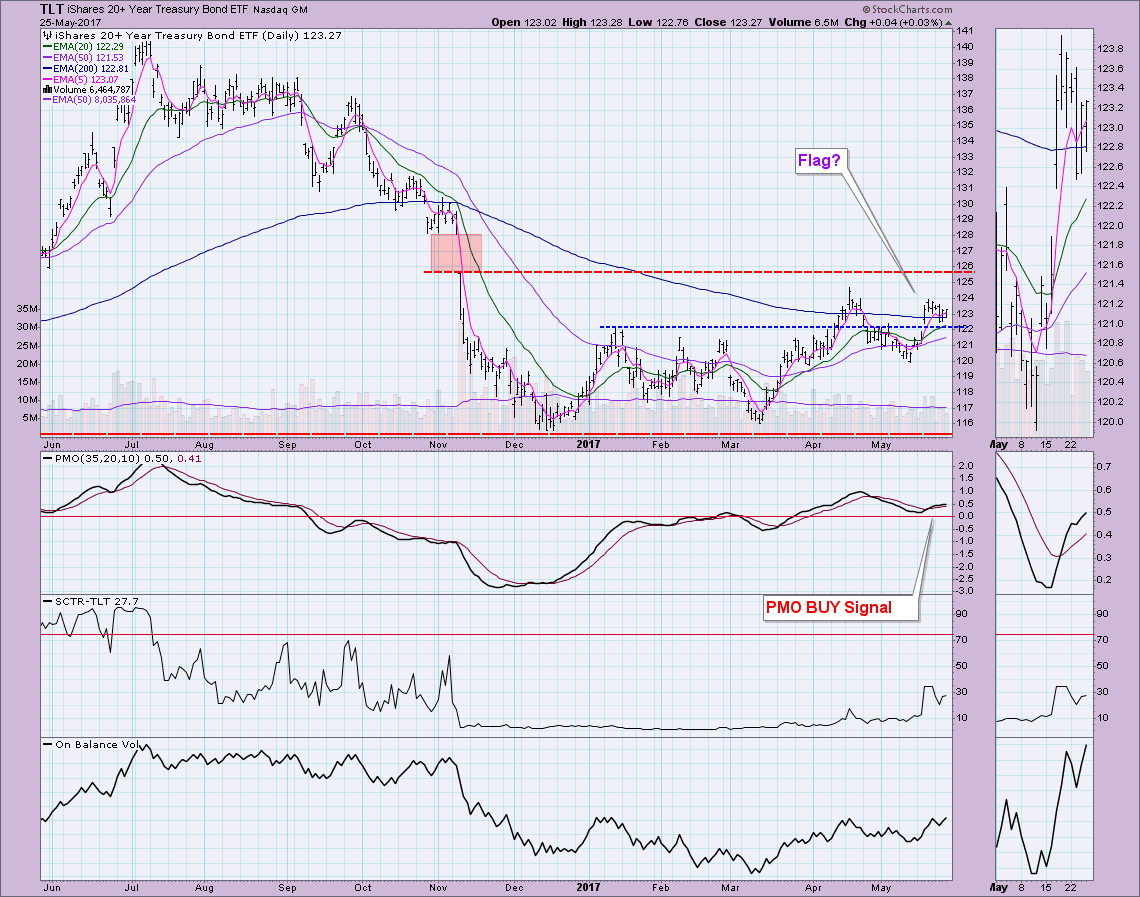
BONDS (TLT)
IT Trend Model: BUY as of 3/31/2017
LT Trend Model: SELL as of 11/17/2016
This chart is similar to Gold. The PMO BUY signal remains intact and we have a potential flag formation. SCTR is alright and trying to rise. Equal and opposite is a potential island reversal formation. Since this "flag" is pennant-like, I would lean toward a continuation of a rally that began in mid-May.
Helpful DecisionPoint Links:
DecisionPoint Shared ChartList and DecisionPoint Chart Gallery
Price Momentum Oscillator (PMO)
Swenlin Trading Oscillators (STO-B and STO-V)
Technical Analysis is a windsock, not a crystal ball.
Happy Charting!
- Erin
**Don't miss DecisionPoint Commentary! Add your email below to be notified of new updates"**
