
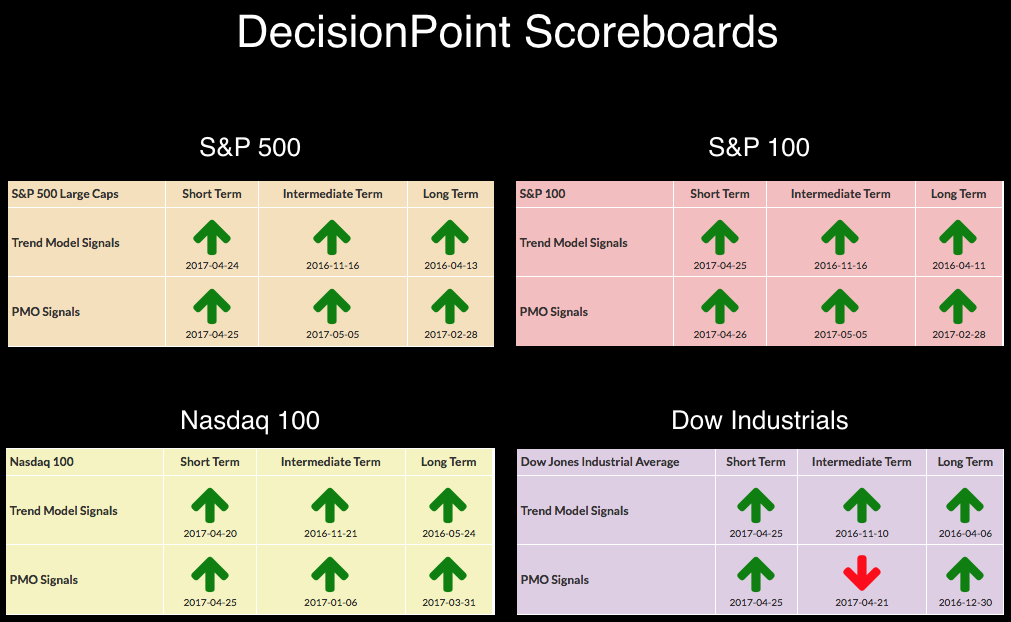
No changes to report on the DecisionPoint Scoreboards. They remain green in all timeframes (with the exception of the Dow IT PMO SELL signal). I suspect we will see some IT PMO SELL signals this Friday, barring a major rally. The OEX is currently configured for an IT PMO SELL signal on the weekly chart.
The purpose of the DecisionPoint Alert Daily Update is to quickly review the day's action, internal condition, and Trend Model status of the broad market (S&P 500), the nine SPDR Sectors, the U.S. Dollar, Gold, Crude Oil, and Bonds. To ensure that using this daily reference will be quick and painless, we are as brief as possible, and sometimes we let a chart speak for itself.
SIGNALS: Here we include charts of any important signal changes triggered today by our Intermediate-Term Trend Model.
No new signals to report.
NOTE: Mechanical trading model signals define the implied bias of the price index based upon moving average relationships, but they do not necessarily call for a specific action. They are information flags that should prompt chart review. Further, they do not call for continuous buying or selling during the life of the signal. For example, a BUY signal will probably return the best results if action is taken soon after the signal is generated. Additional opportunities for buying may be found as price zigzags higher, but the trader must look for optimum entry points. Conversely, exit points to preserve gains (or minimize losses) may be evident before the model mechanically closes the signal.
STOCKS
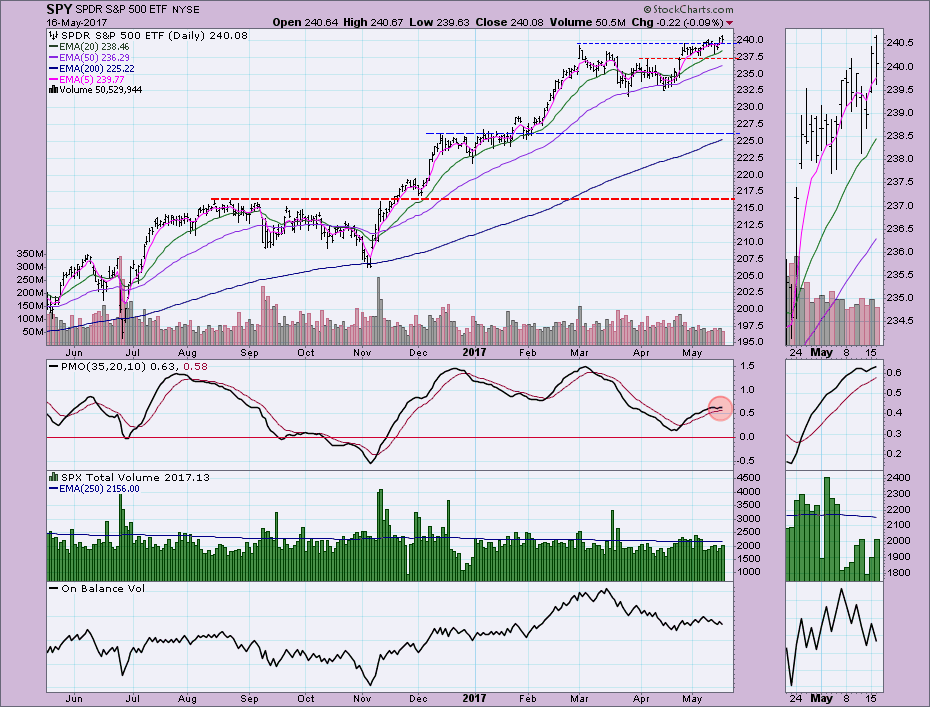
IT Trend Model: BUY as of 11/15/2016
LT Trend Model: BUY as of 4/1/2016
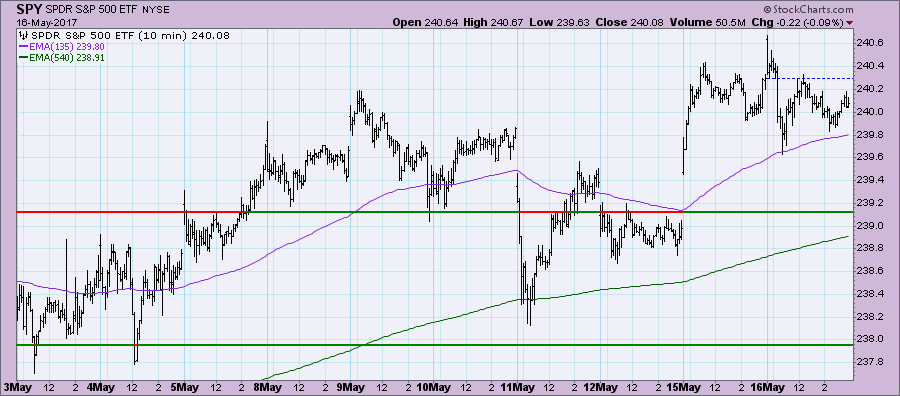
Monday was a shot in the arm as price broke out on the open, but since then price has moved sideways. There was some commotion this morning with prices opening high, but the air was let out of the balloon before lunch.
I cannot annotate the thumbnail, but notice we have a new rising forming. At this point, I like that price is staying above the previous consolidation zone above 240. The PMO appeared to be ready to hand over a SELL signal, but with this week's rally, the PMO has turned back up. One problem I see is the negative divergence between price and the OBV since the OBV high this month. This might suggest that price will pullback to test support at the 20-EMA.
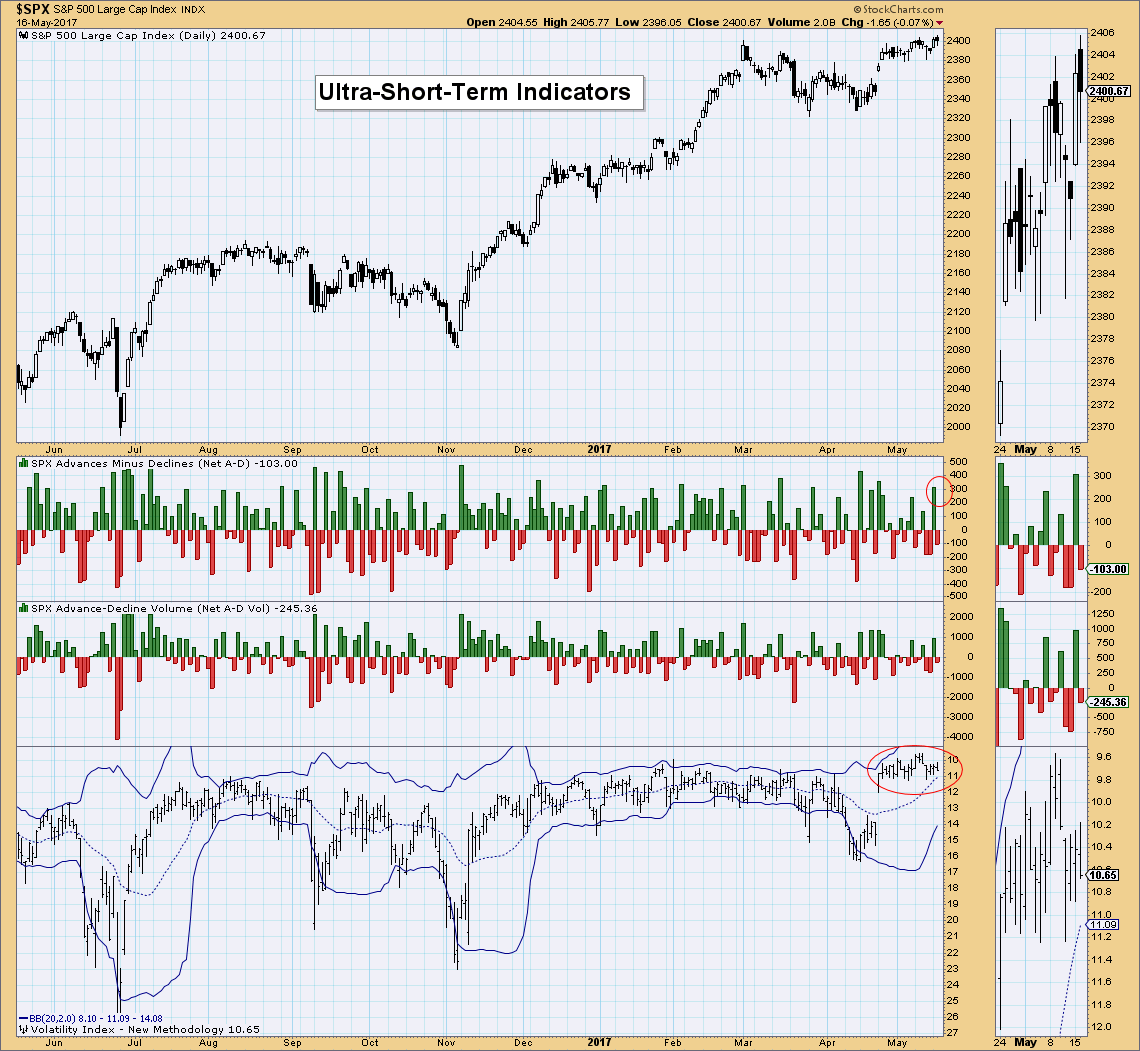
Ultra-Short-Term Indicators: We saw a positive spike yesterday on the Net Advances-Declines. The VIX continues to maintain above the moving average at record lows. The combination of a steady low VIX reading and a climactic positive reading on the Net A-D, suggest to me that bulls are still in control.
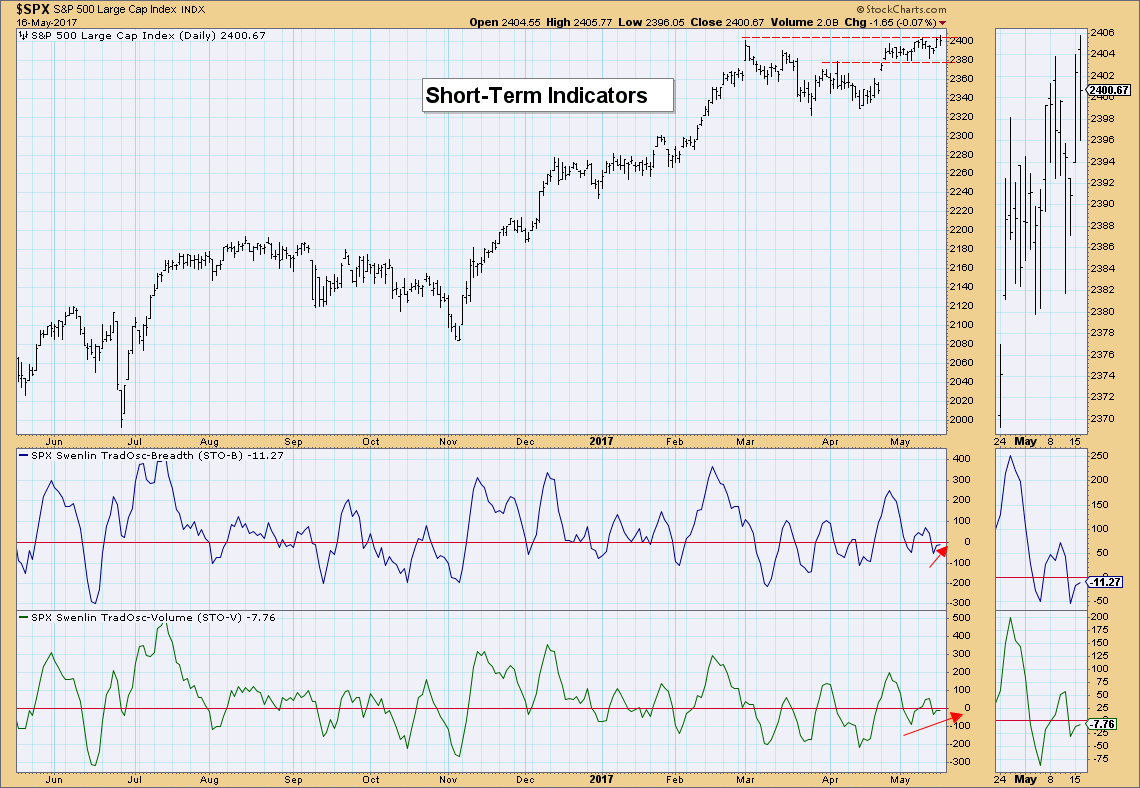
Short-Term Indicators: These indicators are wishy washy right now. I like to see the STO-B rising. Though the STO-V is flat, I do like that indicator bottoms are rising. I see these indicators as squarely "neutral" right now.
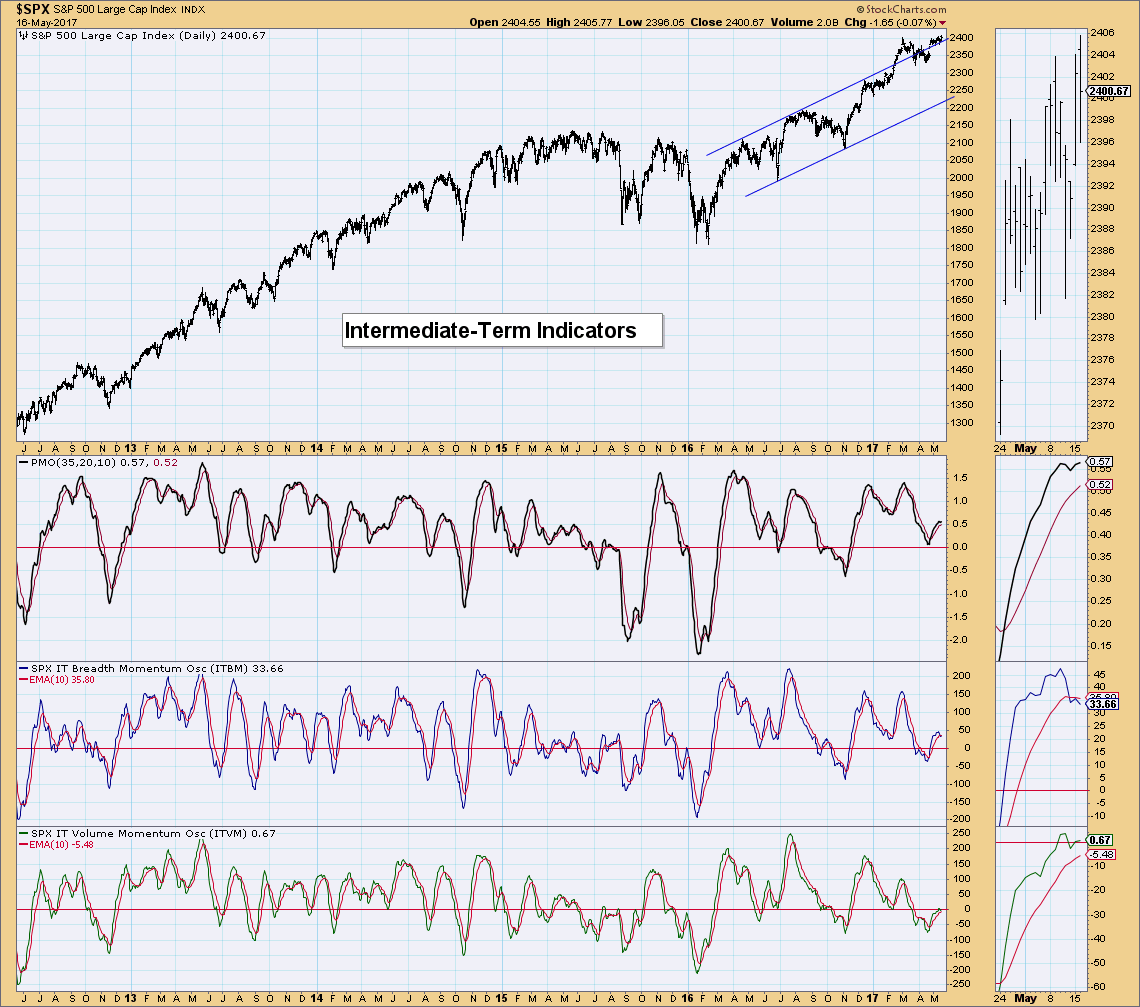
Intermediate-Term Indicators: These indicators are mixed. I do not want to see negative crossovers on either of these indicators. The ITBM succumbed, but the ITVM is still fighting it. Let's not get too bearish until we see a definitive direction taken by both of these indicators.
Conclusion: Indicators are mostly neutral or mixed or better said, "not helpful". They are not negative enough to suggest a correction or even serious pullback, but they are not optimistic enough to call for a breakout rally. More sideways action is likely.
DOLLAR
IT Trend Model: NEUTRAL as of 3/21/2016
LT Trend Model: BUY as of 10/17/2016
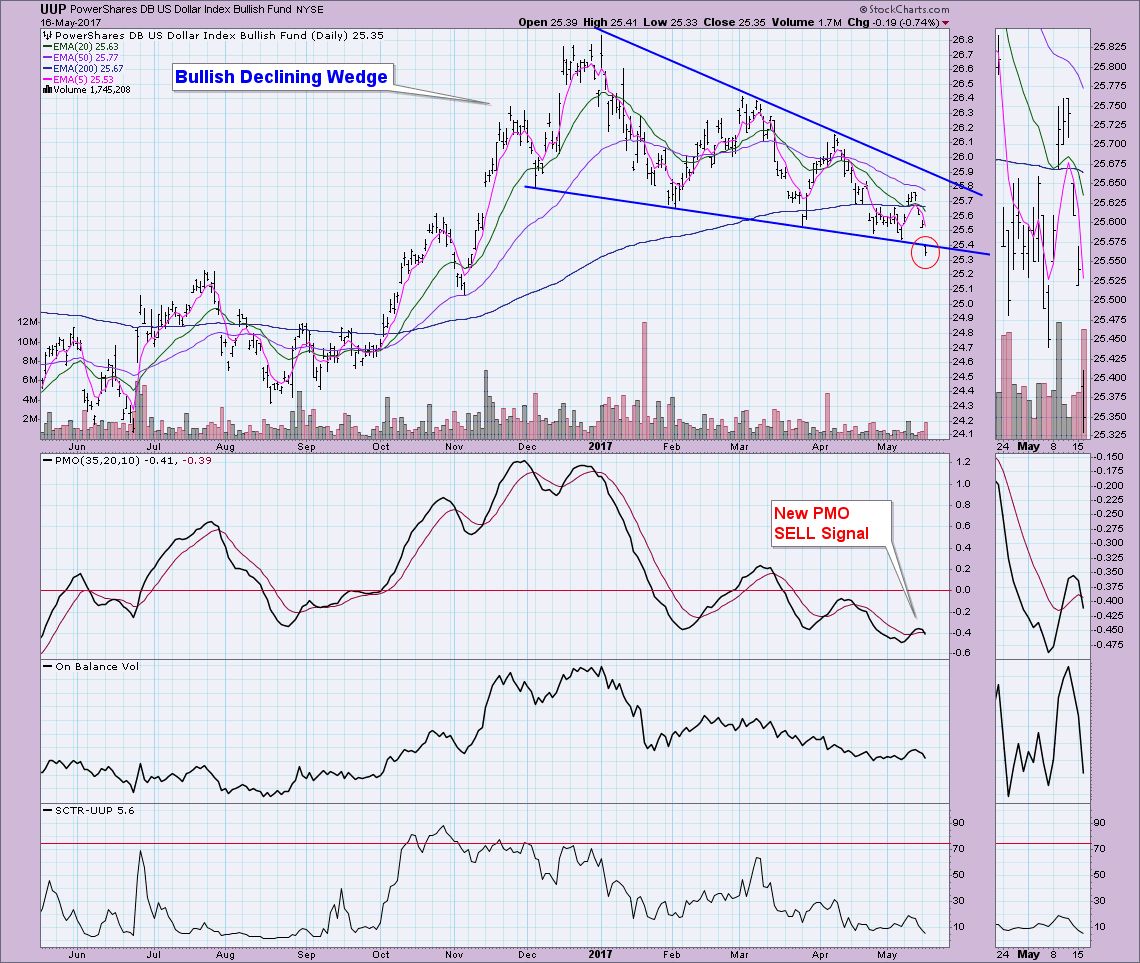
UUP saw a bearish breakdown from a bullish pattern. The breakdown is far from decisive (3% or more), but the gap down and inability of price to test the declining tops trendline is a big problem. The new PMO SELL signal is a huge problem. PMO tops continue to drop along with price tops which is a bearish confirmation. Last year's July high at $25.20 is UUP's best chance at near-term support, but indicators are ugly. The LT Trend Model is nearing a SELL signal (50-EMA negative crossover 200-EMA).
GOLD
IT Trend Model: NEUTRAL as of 5/11/2017
LT Trend Model: BUY as of 4/12/2017
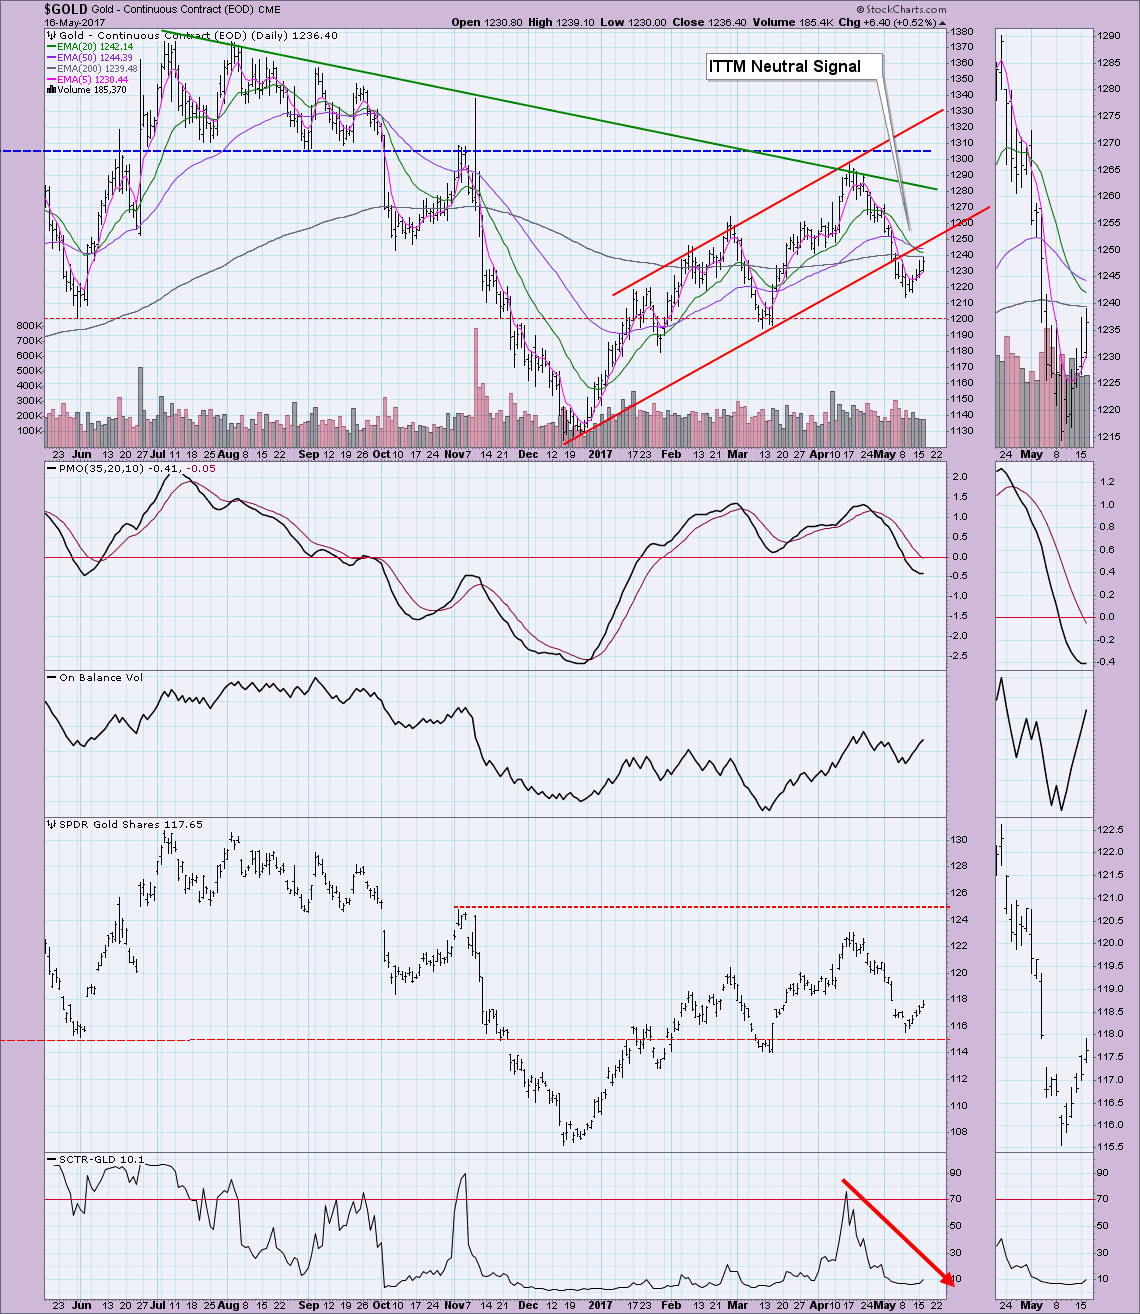
I've talked to the MarketWatchers viewers about Gold and my "gut instinct" that it will find support at $1200. The indicators have suggested lower prices until now. Gold has made a resurgence, bottoming at $1210. The PMO is turning back up and I suspect we will see an IT Trend Model BUY signal reinstated soon as the 20-EMA is already turning back toward the 50-EMA. Overhead resistance along the rising bottoms trendline could be a problem. If it is able to hop back into the rising trend channel, I'd look for a move to the $1270-1280 range where strong LT declining tops line resistance has held for years.
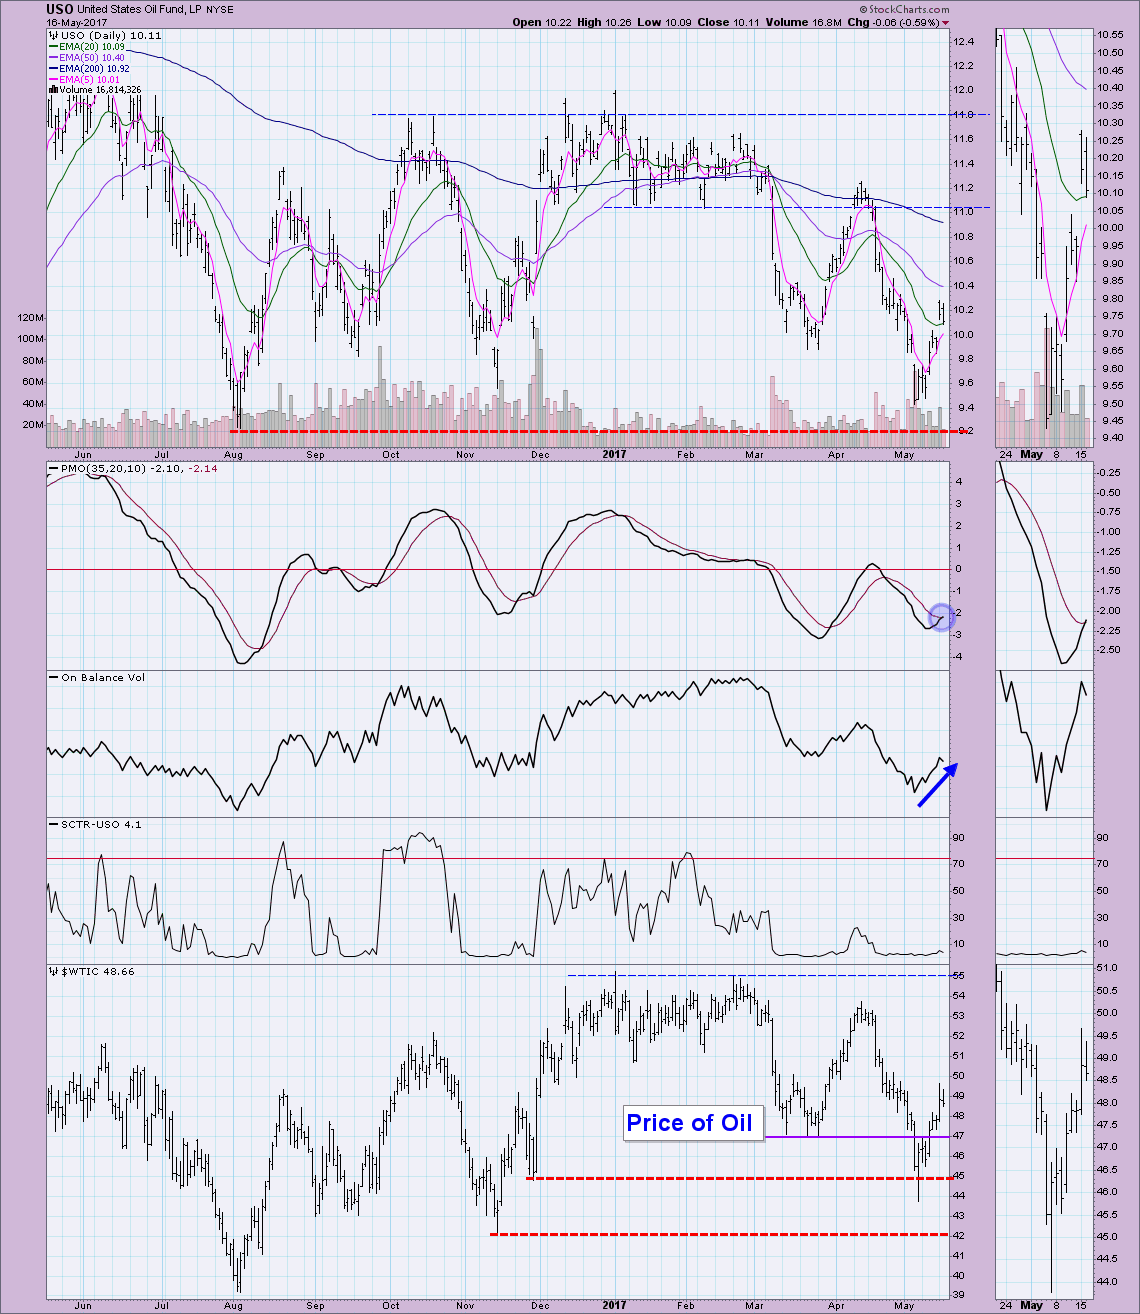
CRUDE OIL (USO)
IT Trend Model: NEUTRAL as of 3/8/2017
LT Trend Model: SELL as of 3/9/2017
The PMO crossed above its signal line to initiate a new PMO BUY signal. I really like the positive divergence between PMO bottoms and price bottoms. Additionally, the OBV is supporting this rally. While $11 is a great upside target, I am suspicious of the gap up on Monday. We could be looking at an island forming and that is bearish. Reverse islands are created after gaps up followed by consolidation to form the island. At that point, the expectation is a decline to close the gap quickly.
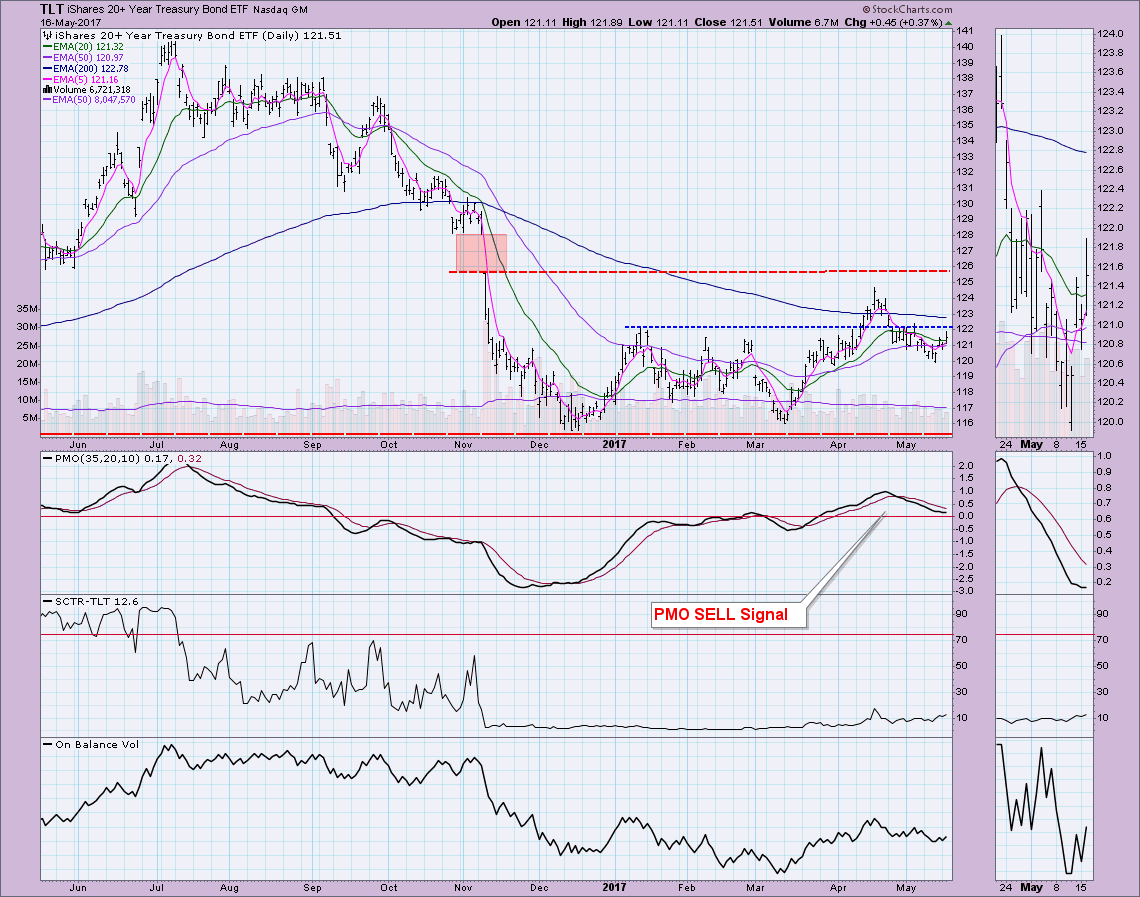
BONDS (TLT)
IT Trend Model: BUY as of 3/31/2017
LT Trend Model: SELL as of 11/17/2016
Bonds, like Gold, has managed to reverse the declining trend. Unfortunately price is now pushing against overhead resistance at $122. The PMO is attempting to rise again which could suggest a breakout nearing.
Helpful DecisionPoint Links:
DecisionPoint Shared ChartList and DecisionPoint Chart Gallery
Price Momentum Oscillator (PMO)
Swenlin Trading Oscillators (STO-B and STO-V)
Technical Analysis is a windsock, not a crystal ball.
Happy Charting!
- Erin
**Don't miss the DecisionPoint Alert Daily Commentary! Click on "Email Updates" at the end of this blog page to be notified as soon as it's published at the end of the market day.**
