
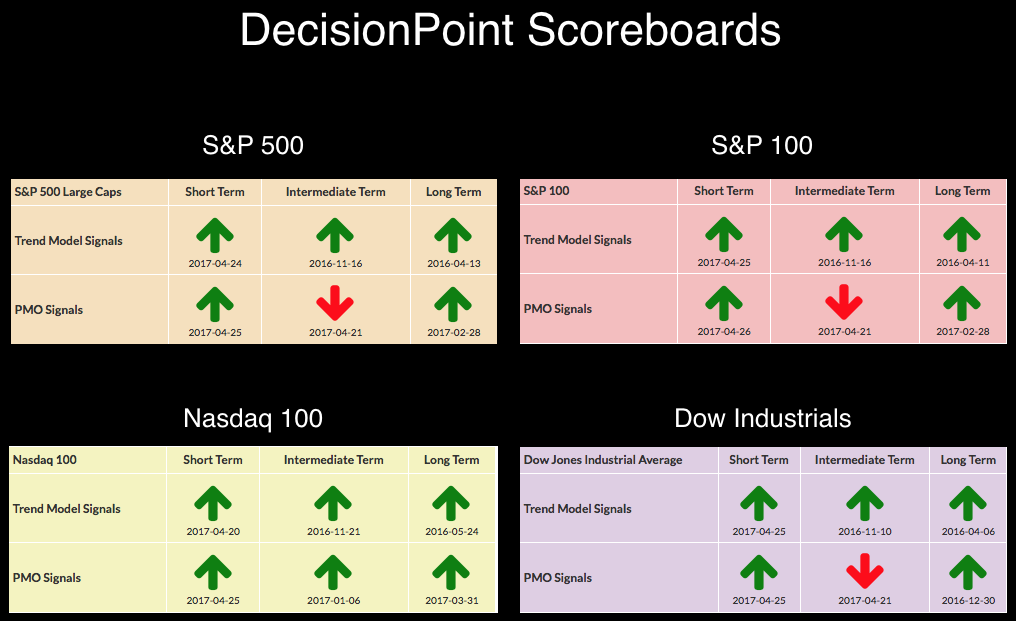
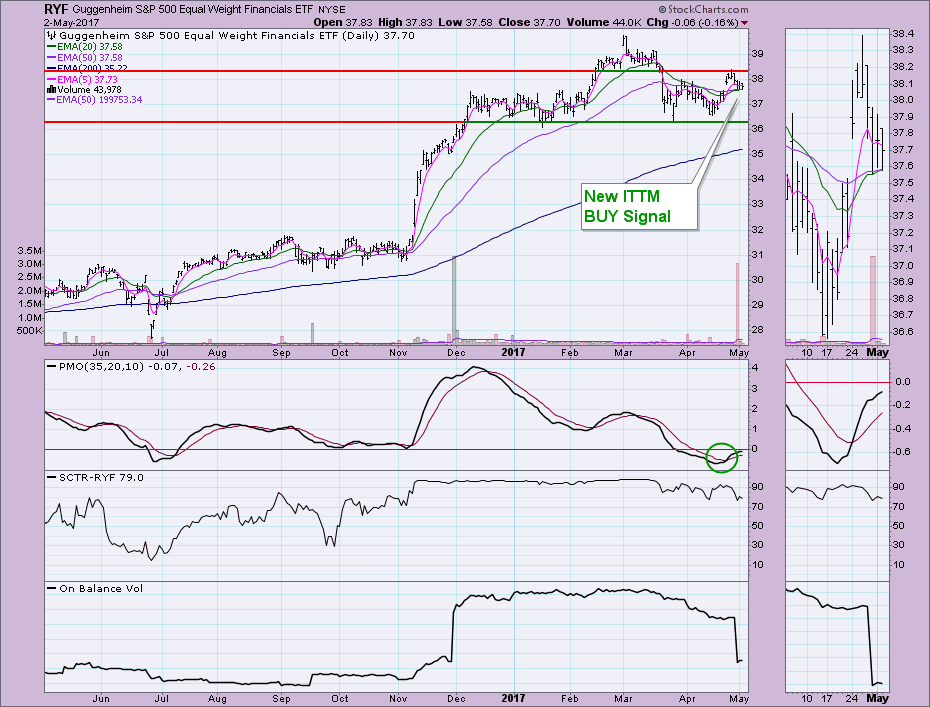
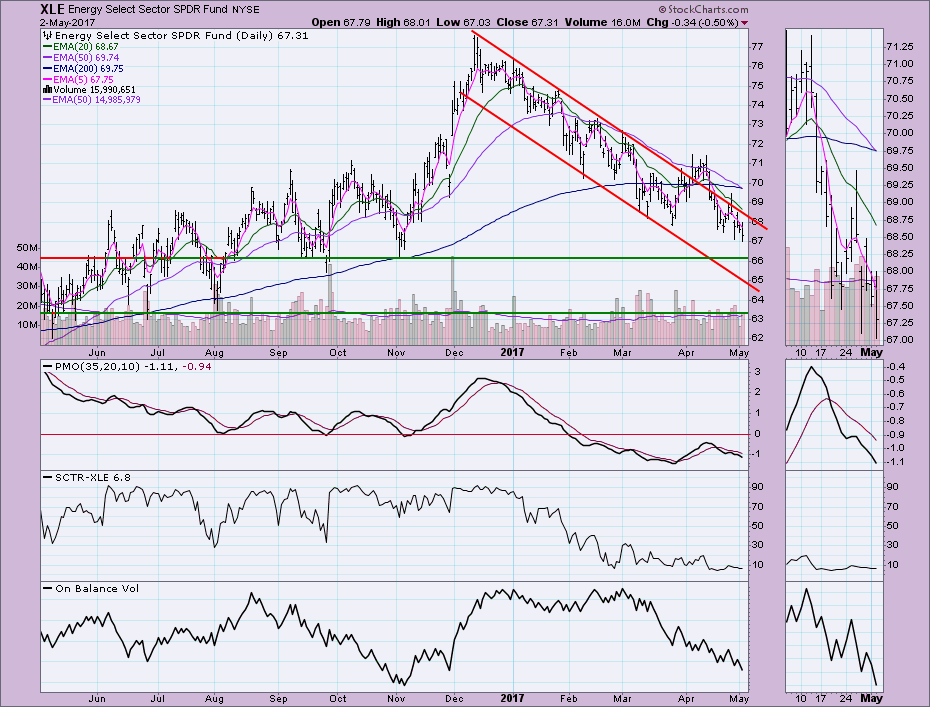
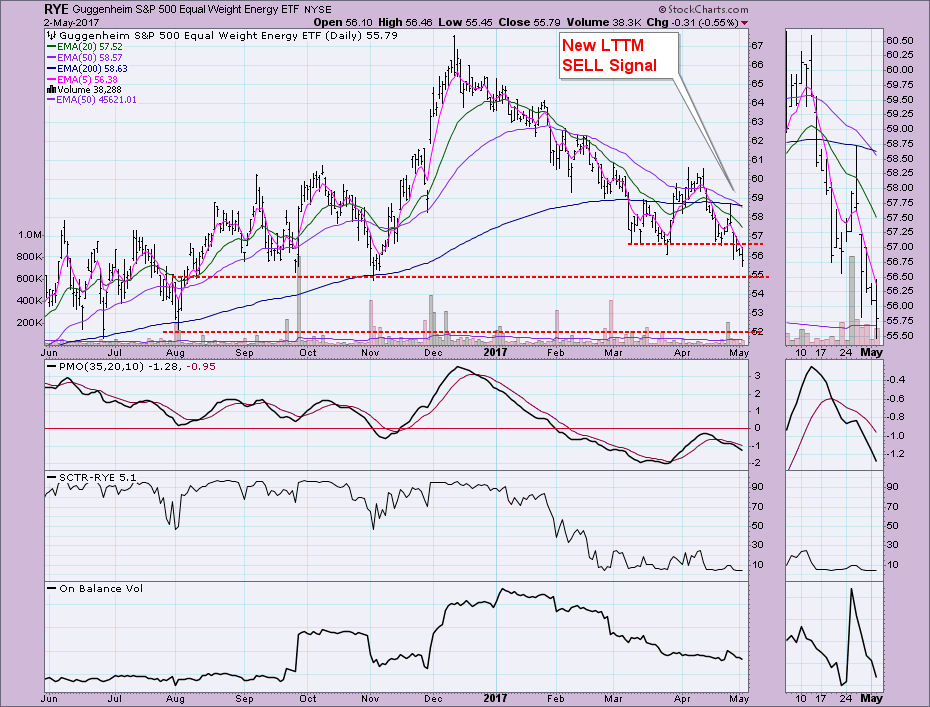
No new changes to report on the DecisionPoint Scoreboards (found in the DecisionPoint Chart Gallery link on the homepage). The market has hit overhead resistance at all-time highs and is struggling to overcome. Meanwhile the defensive Energy Sector just logged LT Trend Model SELL signals, effectively moving them into an official 'bear market'. The equal-weight Financials ETF (RYF) logged a new IT Trend Model BUY signal. Seeing a "defensive" sector moving to a bear market and the Financial sector heating up suggests bullish investors.
The purpose of the DecisionPoint Alert Daily Update is to quickly review the day's action, internal condition, and Trend Model status of the broad market (S&P 500), the nine SPDR Sectors, the U.S. Dollar, Gold, Crude Oil, and Bonds. To ensure that using this daily reference will be quick and painless, we are as brief as possible, and sometimes we let a chart speak for itself.
SIGNALS: Here we include charts of any important signal changes triggered today by our Intermediate-Term Trend Model.
The 20-EMA crossed above the 50-EMA generating a new IT Trend Model BUY signal. It may end up short-lived as price is already testing support along those EMAs. The PMO BUY signal and rising PMO are encouraging, as is a SCTR ranking above 75.
A Long-Term Trend Model SELL signal is generated when the 50-EMA crosses below the 200-EMA. The only tw rays of hope I see on these charts is the PMO is oversold and support on both charts is nearby at $66 for XLE and $55 for RYE.
NOTE: Mechanical trading model signals define the implied bias of the price index based upon moving average relationships, but they do not necessarily call for a specific action. They are information flags that should prompt chart review. Further, they do not call for continuous buying or selling during the life of the signal. For example, a BUY signal will probably return the best results if action is taken soon after the signal is generated. Additional opportunities for buying may be found as price zigzags higher, but the trader must look for optimum entry points. Conversely, exit points to preserve gains (or minimize losses) may be evident before the model mechanically closes the signal.
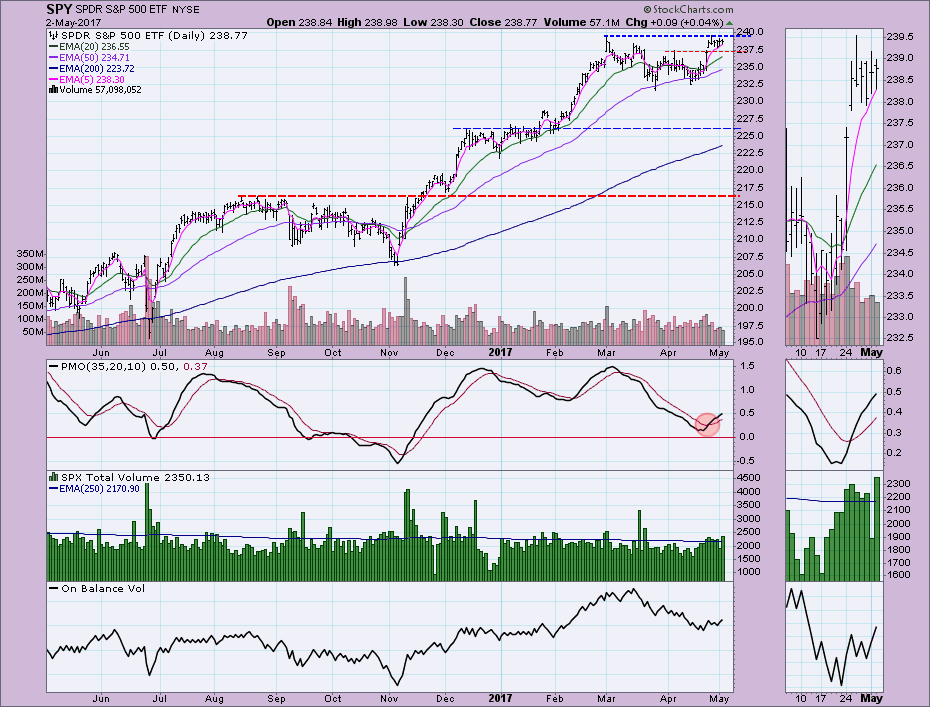
STOCKS: Based upon a 11/15/2016 Intermediate-Term Trend Model BUY signal, our current intermediate-term market posture for the S&P 500 (SPY) is bullish. The Long-Term Trend Model, which informs our long-term outlook, is on a BUY signal as of 4/1/2016 so our long-term posture is bullish.
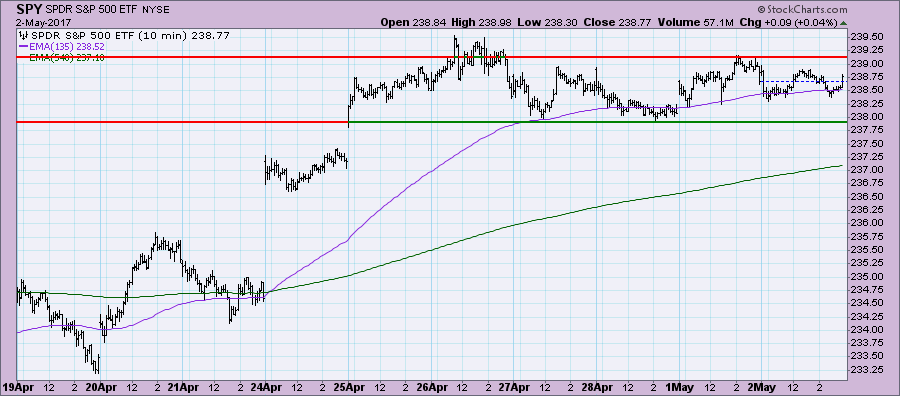
Since the second gap up, price has basically consolidated along all-time highs. It's positive that price hasn't dipped below or closed the gap, but price needs to begin trending higher.
You can see the concern when you look at the daily chart. Price has basically stagnated. Good news is that the PMO is still rising on a BUY signal. The OBV is neutral right now.
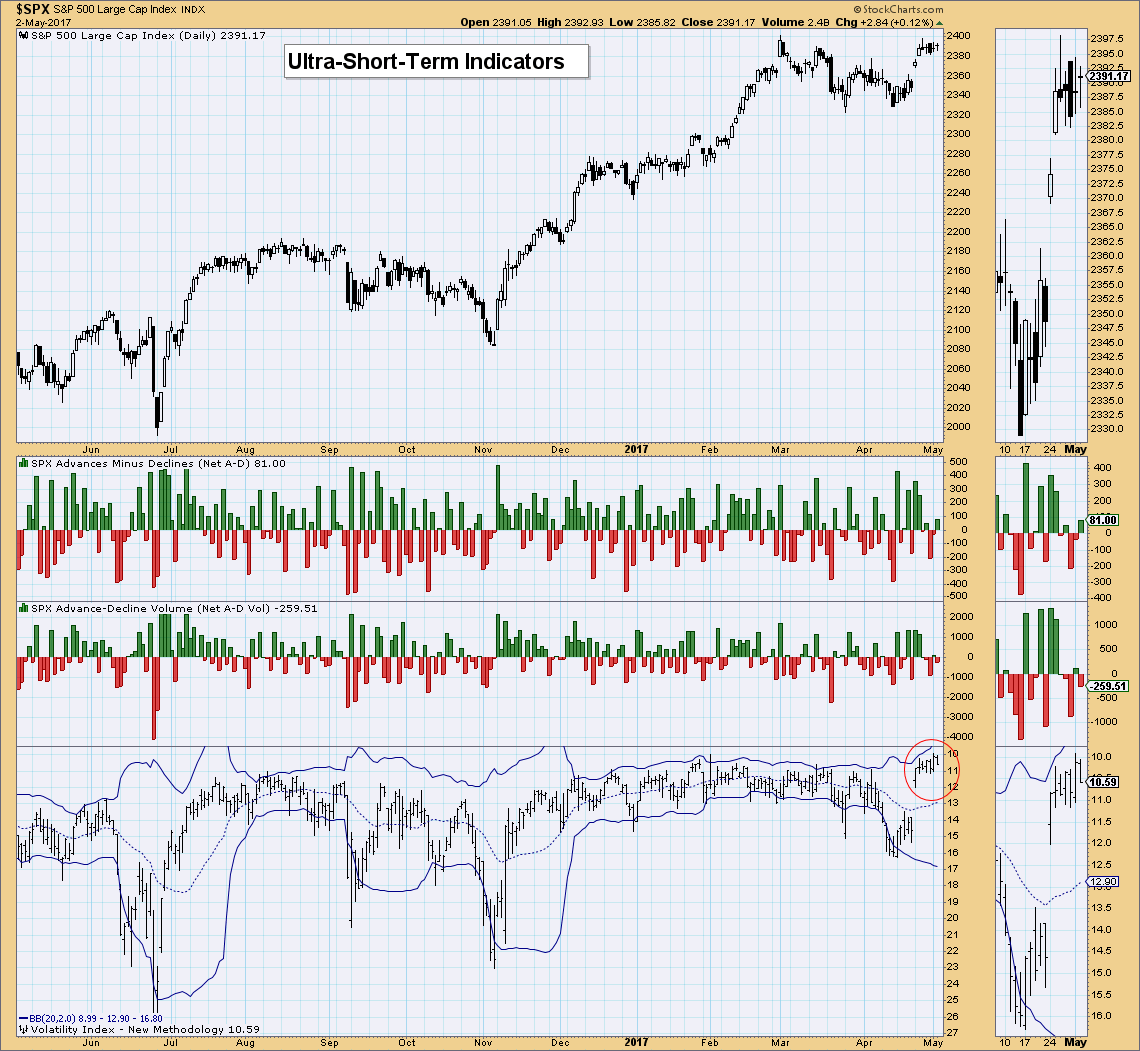
Ultra-Short-Term Indicators: No climactic readings here. The VIX is floating in bullish territory, telling us that investors are still optimistic. If we see readings puncture the upper band, then I would consider the market ripe for a quick reversal.
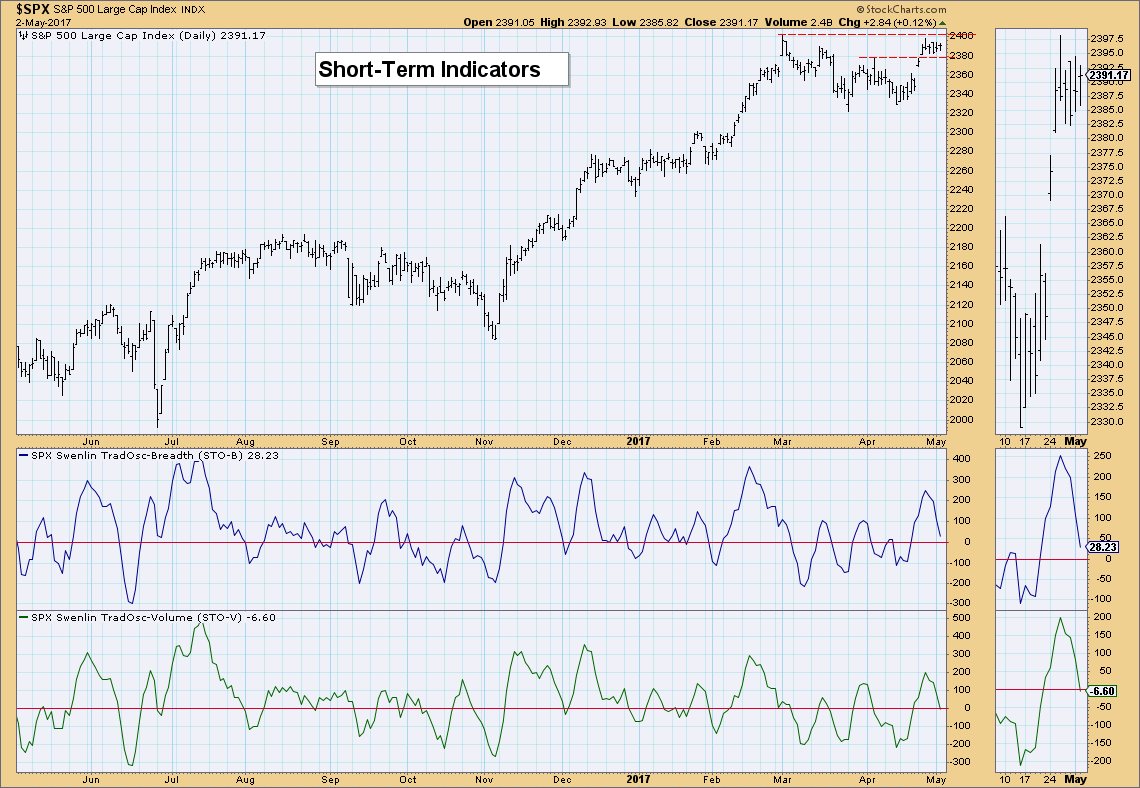
Short-Term Indicators: These indicators have managed to unwind without a serious pullback or correction and that suggests some internal strength.
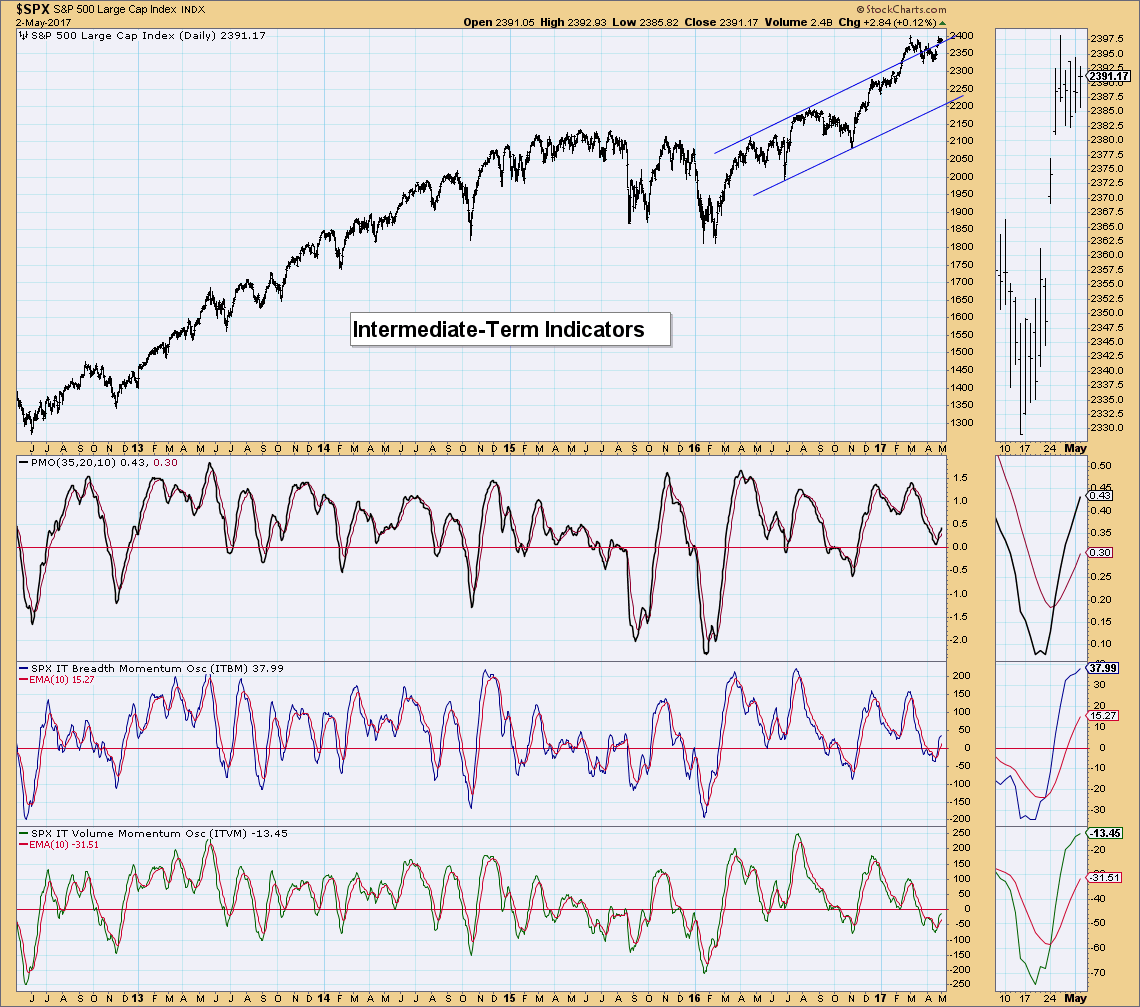
Intermediate-Term Indicators: I like that these indicators are rising after positive crossovers their signal lines. They have decelerated, but I'm not concerned just yet. Price has been flat so seeing this small depression isn't a real problem. Now if we see a negative crossover, then we can get worried.
Conclusion: It seems that the market is pausing. It hit overhead resistance and is stuck there. The good news is we haven't seen much price deterioration at all. ST indicators are unwinding safely and IT indicators are still bullish. With Energy sector losing lots of ground, I believe that bodes well for the SPX.
**Don't miss the DecisionPoint Alert Daily Commentary! Click on "Email Updates" at the end of this blog page to be notified as soon as it's published at the end of the market day.**
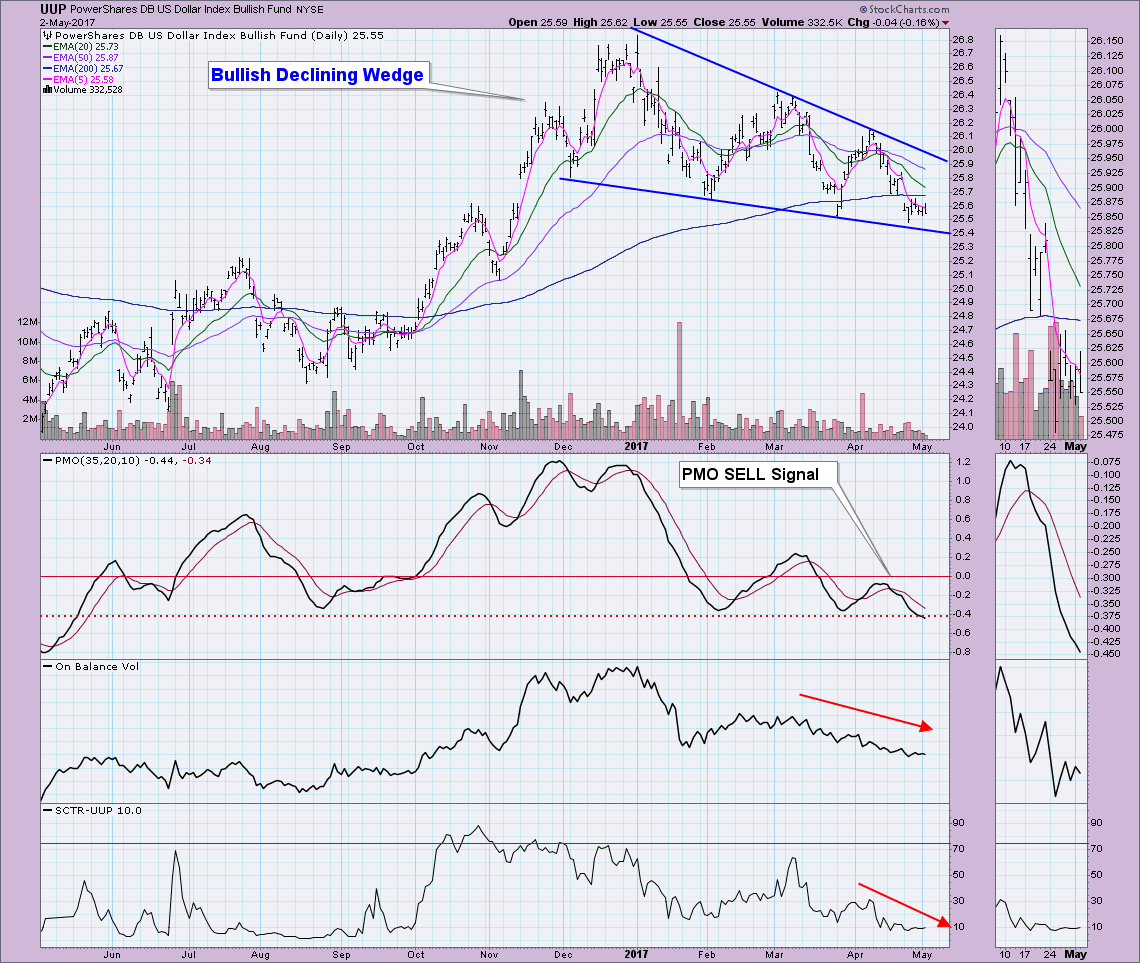
DOLLAR: As of 3/21/2017 the US Dollar Index ETF (UUP) is on an Intermediate-Term Trend Model Neutral signal. The Long-Term Trend Model, which informs our long-term outlook, is on a BUY signal as of 10/17/2016, so our long-term posture is bullish.
The pattern is now clearly a bullish falling wedge. I admit to stubbornly not giving up on the descending triangle, but the indicators are still very negative. The PMO is now in oversold territory and ripe for a reversal. I'd like to see some confirming action from either the OBV or SCTR, but none so far. I am cautiously bullish short term on the Dollar.
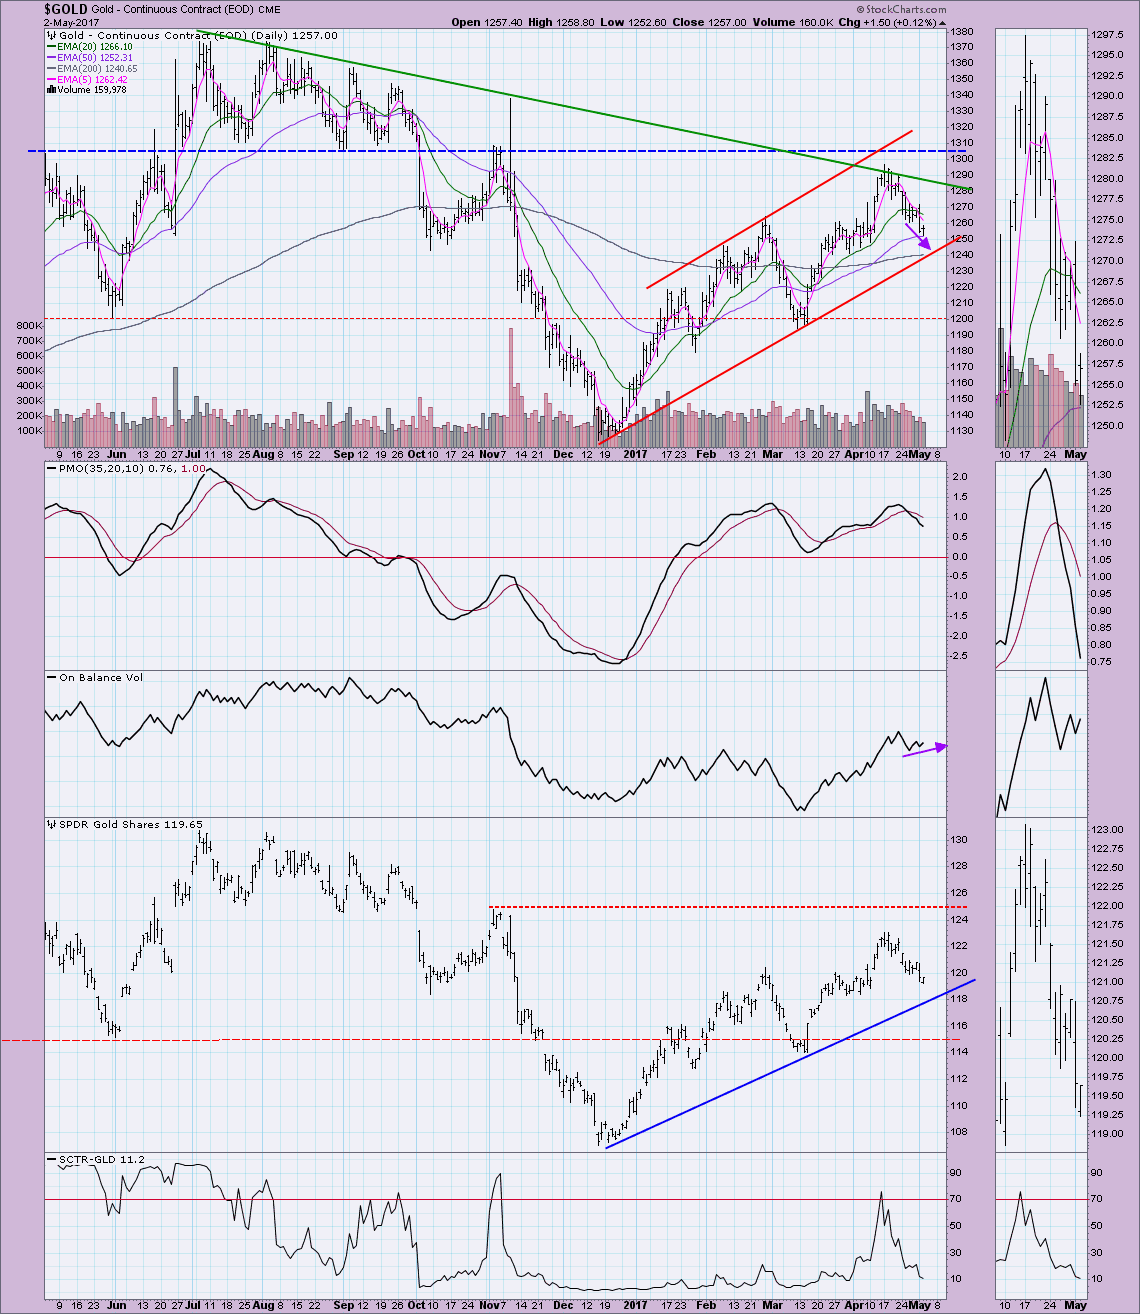
GOLD: As of 2/3/2016 Gold is on an Intermediate-Term Trend Model BUY signal. The Long-Term Trend Model, which informs our long-term outlook, is on a BUY signal as of 4/11/2017, so our long-term posture is bullish.
Gold is nearing support along the rising bottoms trendline that forms the bottom of a rising trend channel. The OBV bottoms are showing a positive divergence with price bottoms which could be telling us that support will hold. However, the bearish PMO and low SCTR have me concerned that support will not hold. If that is the case, look for Gold to move as low as $1200 and GLD to move as low as $115.
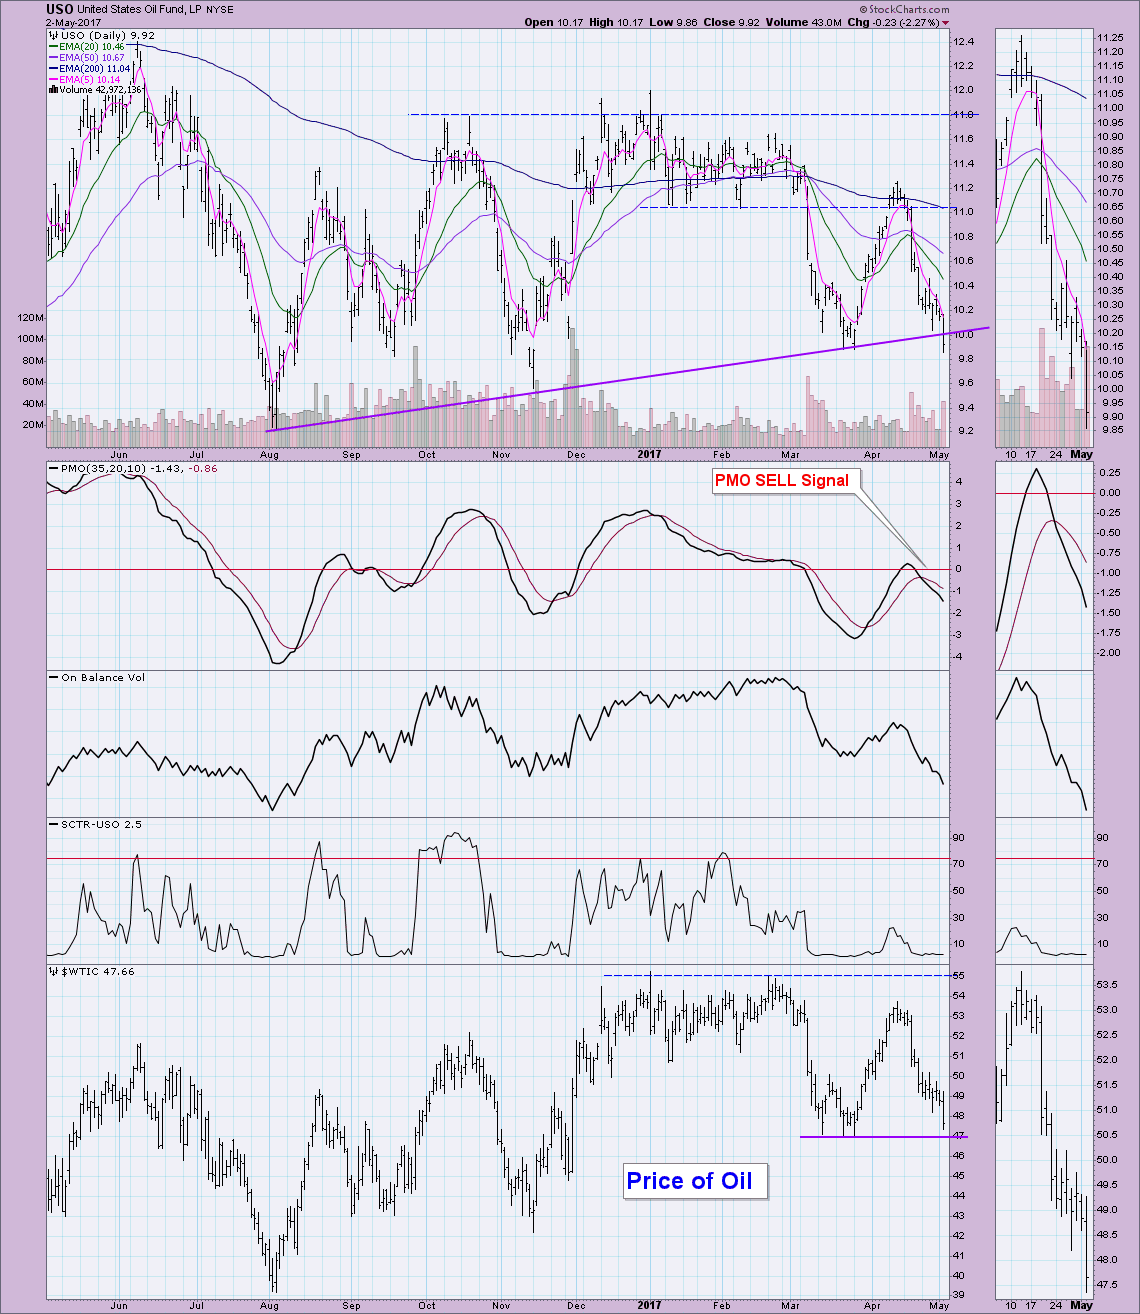
CRUDE OIL (USO): As of 3/8/2017 United States Oil Fund (USO) is on an Intermediate-Term Trend Model Neutral signal. The Long-Term Trend Model, which informs our long-term outlook, is on a SELL signal as of 3/9/2017, so our long-term posture is bearish.
USO broke down below support along the rising bottoms trendline drawn from the August low. Oil has now hit critical support near $47/barrel. If that can hold up, then this breach of the rising bottoms trendline by USO may be it. The problem I see is that momentum is still pulling strongly lower. The PMO isn't interested in decelerating and it is not really oversold.
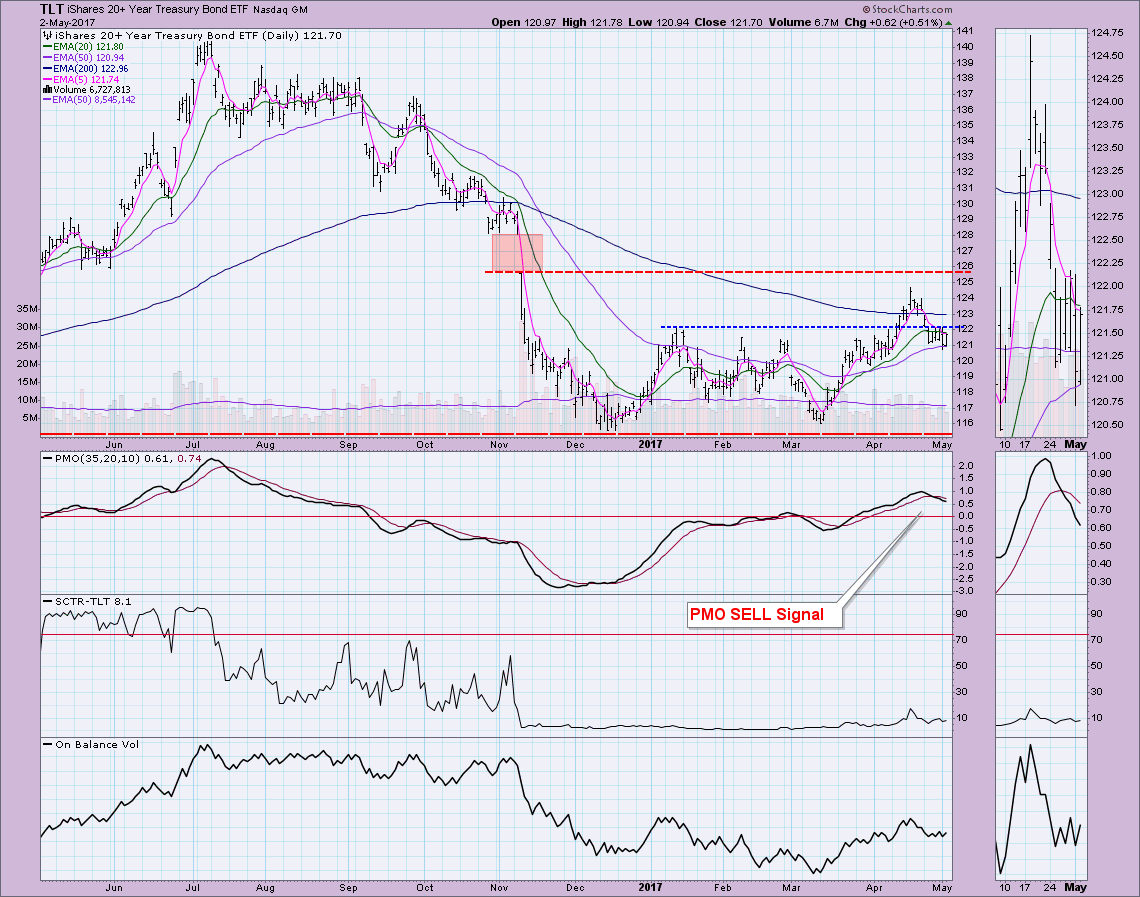
BONDS (TLT): As of 3/31/2017 The 20+ Year T-Bonds ETF (TLT) is on an Intermediate-Term Trend Model BUY signal. The Long-Term Trend Model, which informs our long-term outlook, is on a SELL signal as of 11/17/2016, so our long-term posture is bearish.
TLT failed to move past resistance at $125 and has now dipped below previous support at $122. It has made numerous attempts in the past week to reclaim territory above $122, but has failed. The PMO is on a SELL signal and SCTR is in the basement. OBV isn't telling us much. I do happen to know that 10-yr Treasury yields are rising nicely ($TNX) and this of course, will effect bond prices negatively. I'm very bearish on bonds right now.
The DecisionPoint LIVE Shared ChartList has launched! Click on the link and you'll find webinar and blog chart spotlights. Be sure and bookmark it!
Technical Analysis is a windsock, not a crystal ball.
Happy Charting!
- Erin
