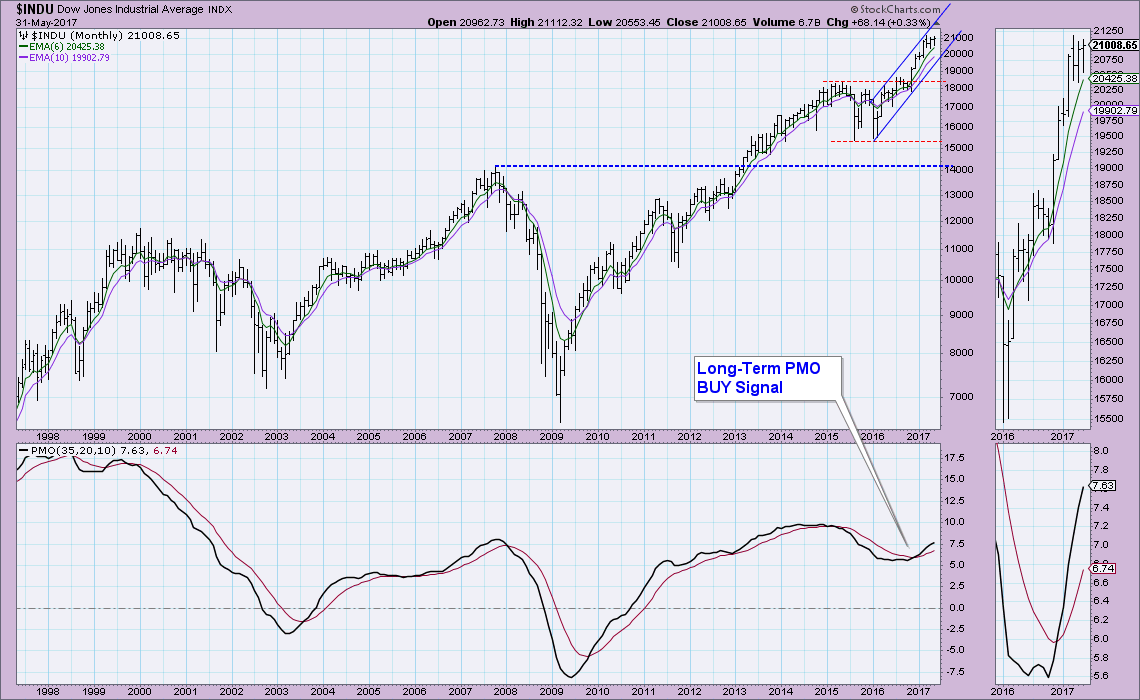
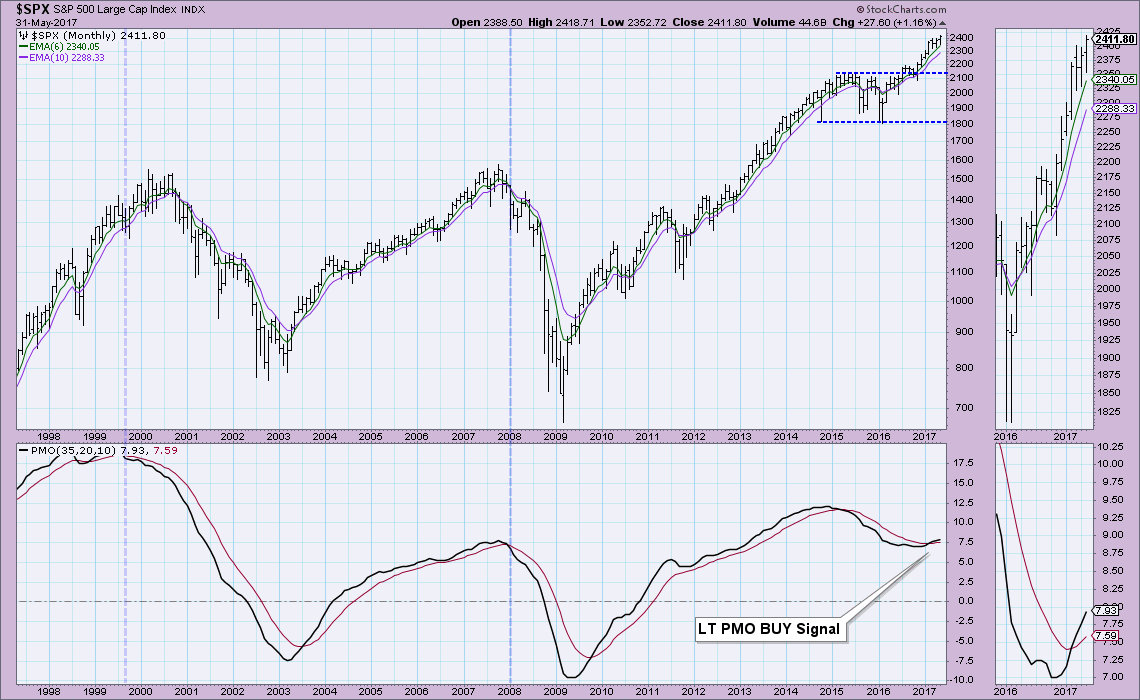
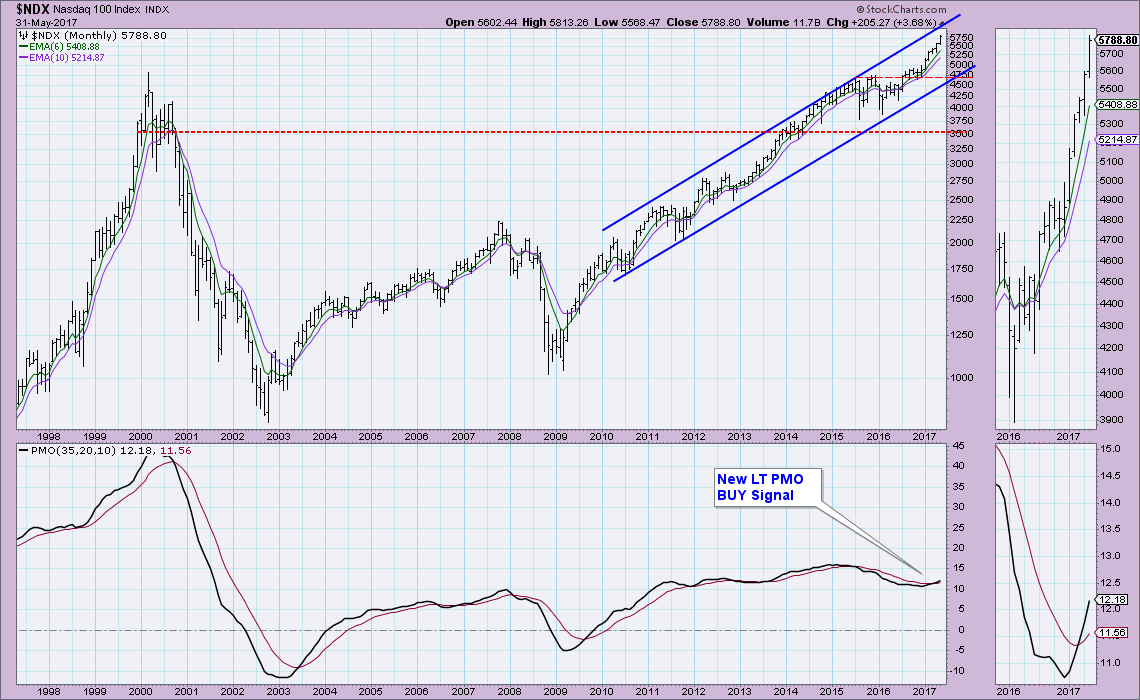
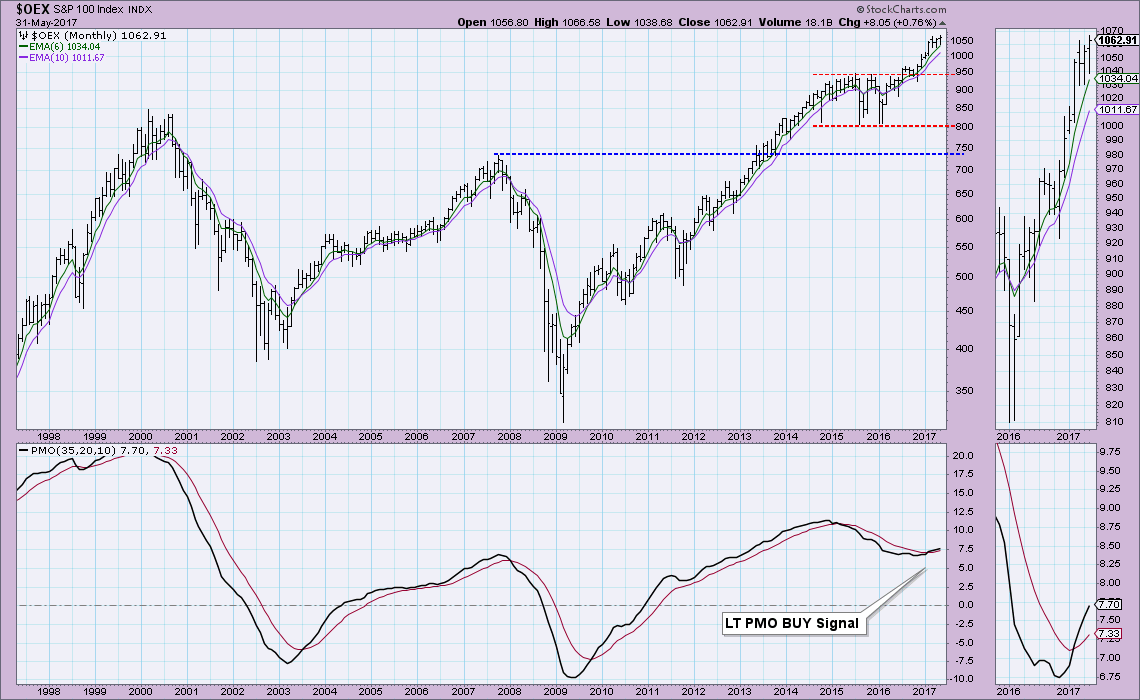
It's the last day of the month and consequently time to review the monthly charts that have just gone final. There are some interesting configurations, especially on the Dollar and Bonds which I'll cover later in the blog. I'd like to start first with the large cap indexes in the DecisionPoint Chart Gallery. The Long-Term PMO signals are generated by the monthly PMO crossovers. None of the Scoreboard indexes switched their current LT PMO BUY signals. Indeed, all PMOs are rising and are not showing signs of deterioration or deceleration which bodes well for long-term investors. You'll find the charts of INDU, OEX, NDX and SPX below.
Small- and Mid-cap ETFs:
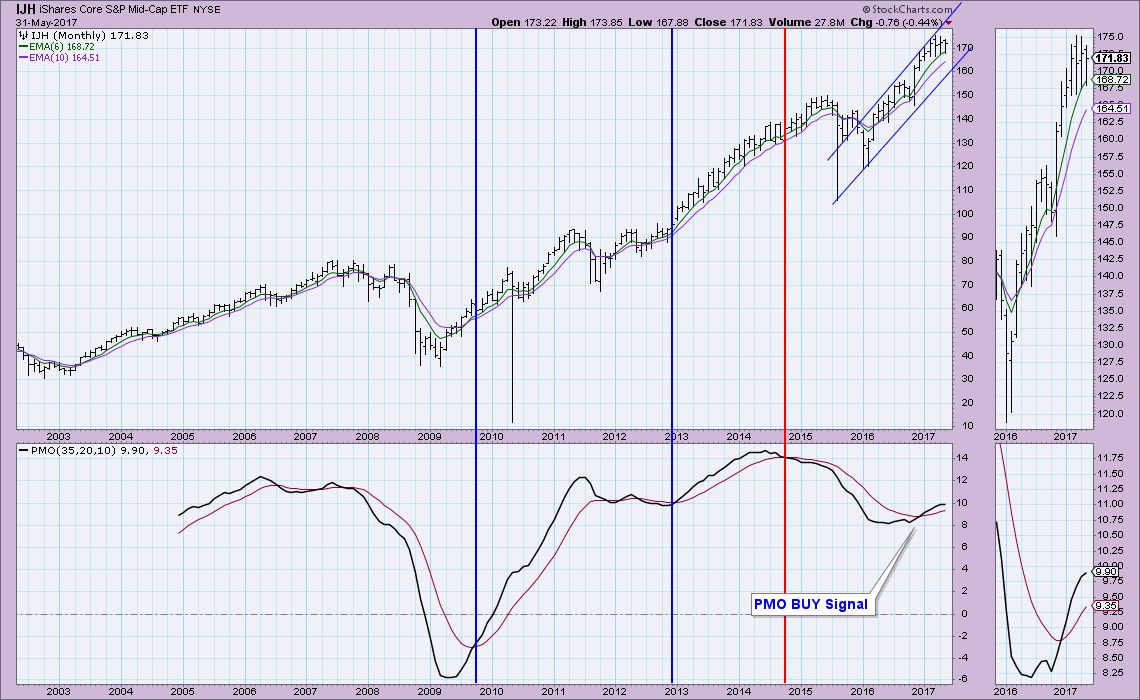
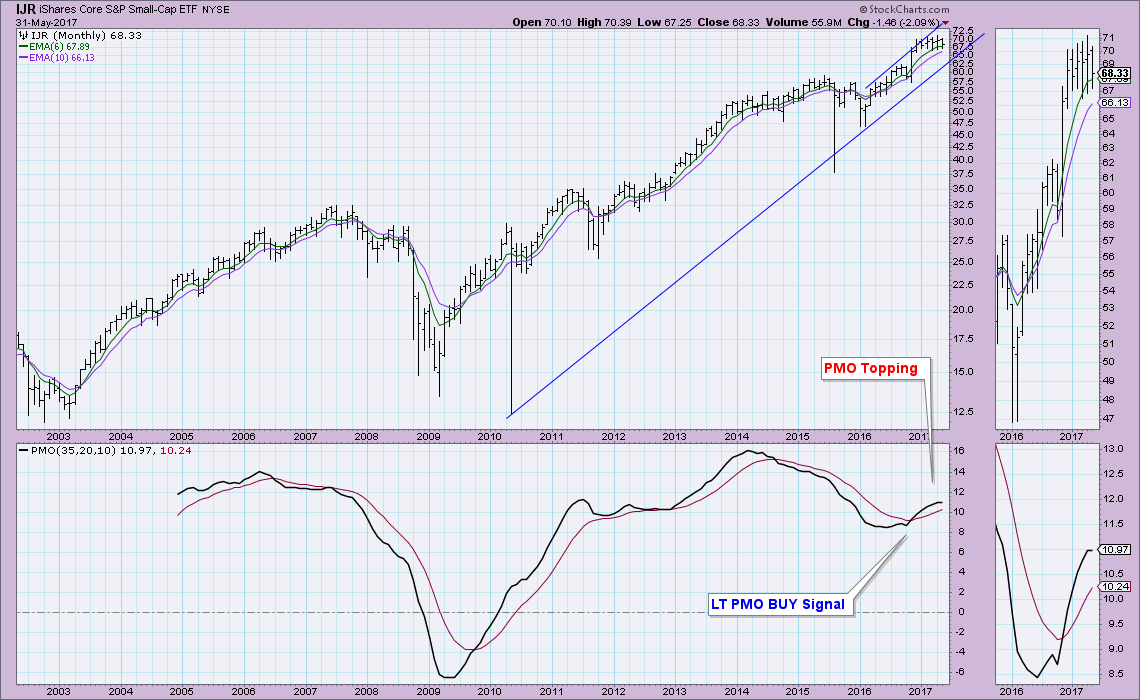
These ETFs are showing long-term PMO deceleration. Bull markets find fuel in the small and mid-cap stocks, so seeing deterioration of long-term momentum is attention flag. In the case of the S&P 600 ETF (IJR), the long-term PMO has topped. I'll be keeping watch next month to see if this loss of momentum continues or is contagious.

Big Four:
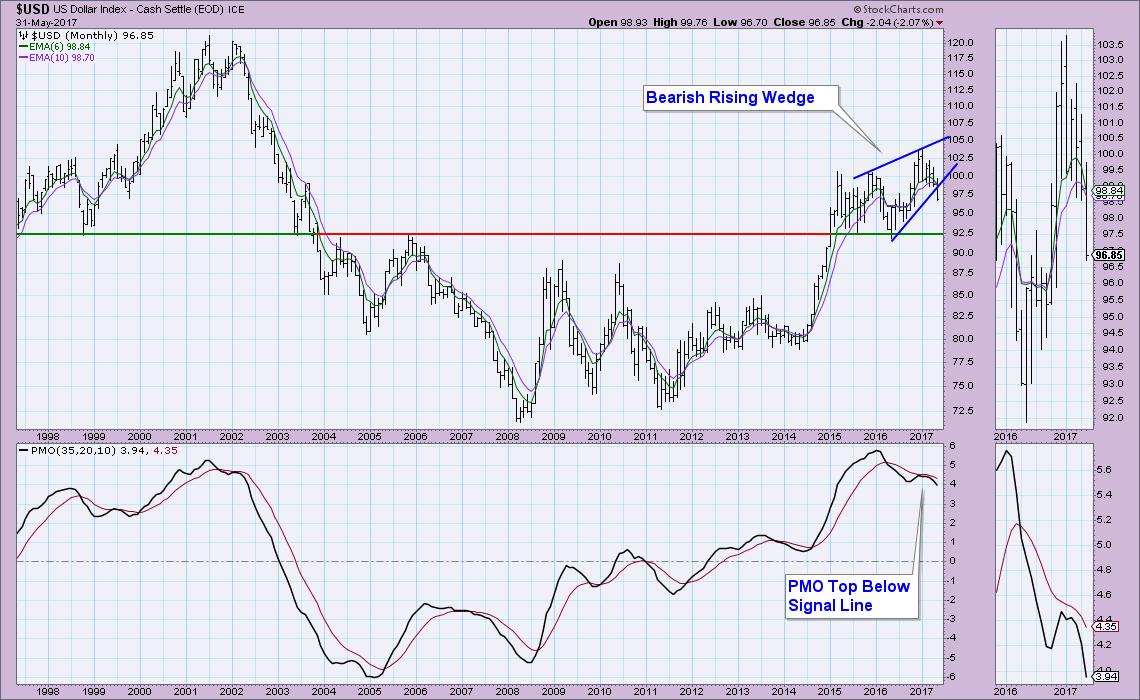
The monthly chart of the Dollar spoke volumes when I opened it. The bearish rising wedge has executed. The PMO topped below its signal line which is particularly bearish. I'm long-term bearish on the Dollar and nothing on this chart changes that opinion right now.
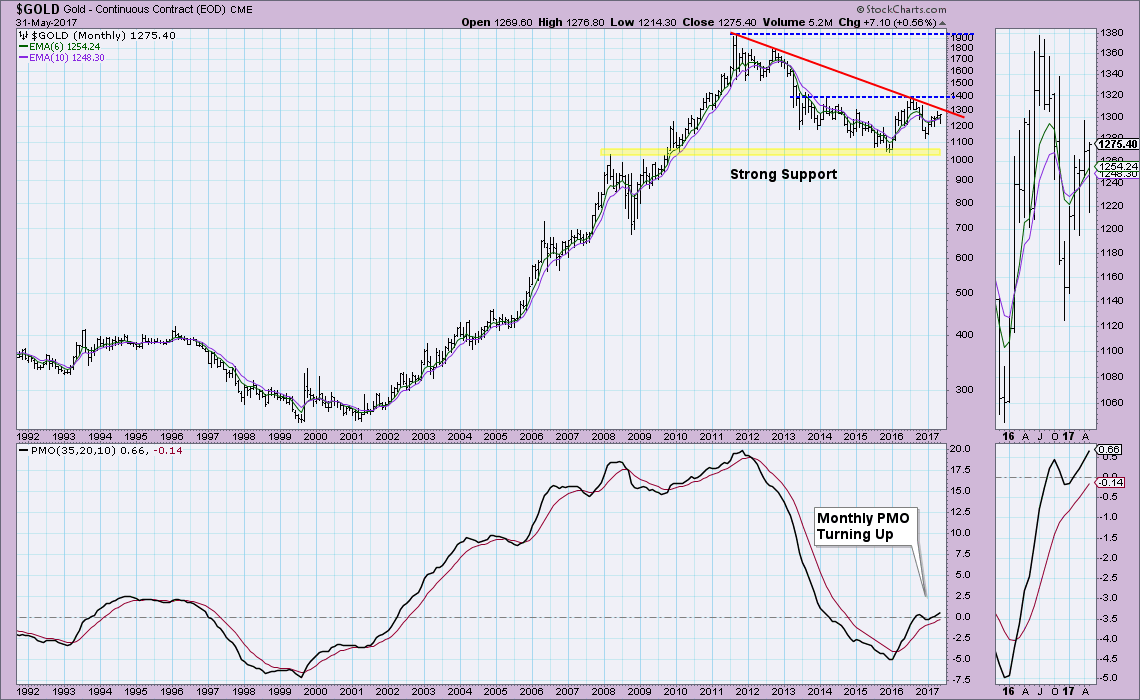
Gold is an interesting case. Being long-term bearish on the Dollar puts me in a position to be bullish on Gold since they typically are inversely correlated. The PMO bottom above the signal line is especially bullish. I am bullish on Gold, but long-term overhead resistance needs to be broken. That area of resistance has been in play since 2012. I believe we have a good shot this time around with the Dollar showing weakness. Additionally, if overall markets pull back, Gold should find favor among investors seeking shelter.
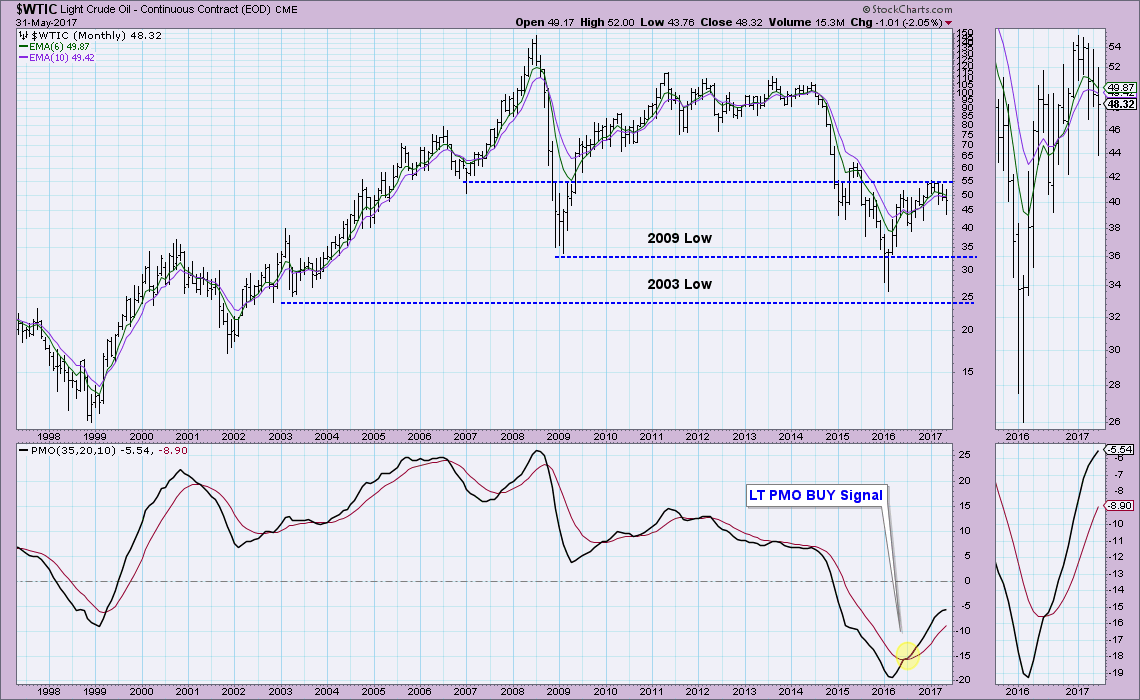
It's no wonder Oil is struggling right now given its failure to push past $55/barrel. The PMO is showing signs of long-term deterioration as it slows its ascent. It is going to be critical for Oil to hold support around $40. This chart suggests we could see Oil prices as low as $25, but there is possible support along the way at $34-35.
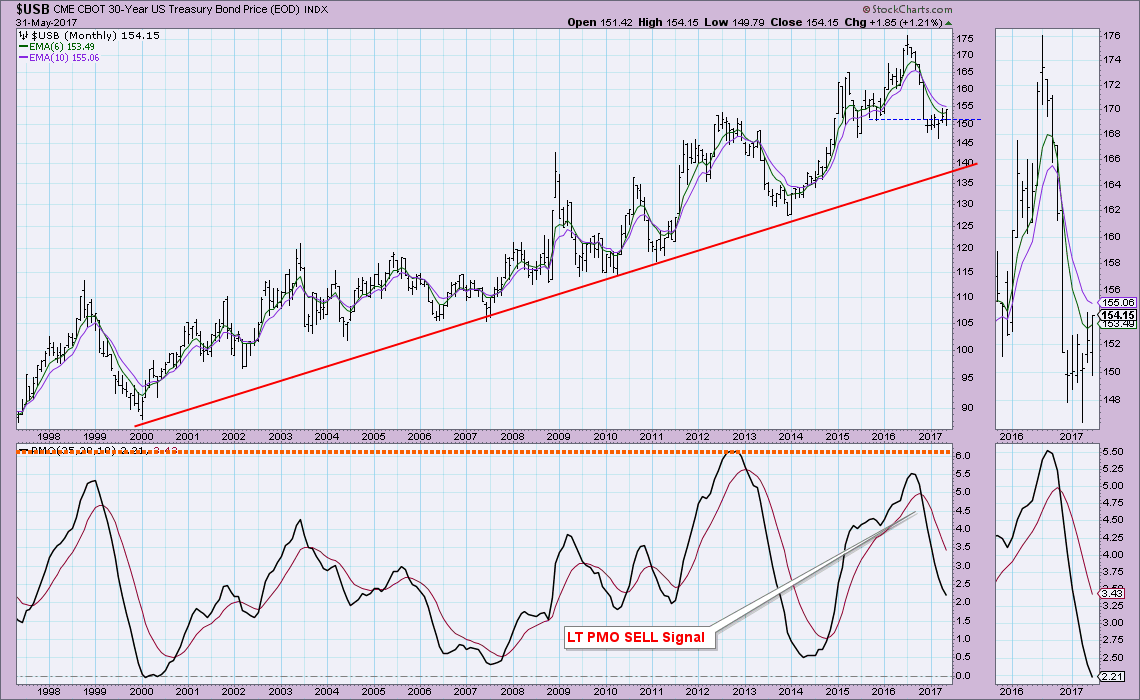
Bonds looked like they were preparing for another test of support along the rising bottoms trendline established in 2007. However, they have managed to find support around $145. The PMO is trying to decelerate, but it is a feat to turn it around after the decline in late 2016. My concern at this point would be the possible formation of a head and shoulders pattern. We have a left shoulder and a head... but it is too early to call.
Helpful DecisionPoint Links:
DecisionPoint Shared ChartList and DecisionPoint Chart Gallery
Price Momentum Oscillator (PMO)
Swenlin Trading Oscillators (STO-B and STO-V)
Technical Analysis is a windsock, not a crystal ball.
Happy Charting!
- Erin
**Don't miss DecisionPoint Commentary! Add your email below to be notified of new updates"**
