Last week I wrote: ". . . our short- and intermediate-term indicators suggest that we will see a few more weeks of rally before another correction/consolidation." In the first two days of this short week price continued to consolidate the prior week's advance, and then the rally continued in the last two days, with price moving to new, all-time highs. Let's examine the prospects of such positive action continuing.
The DecisionPoint Weekly Wrap presents an end-of-week assessment of the trend and condition of the stock market (S&P 500), the U.S. Dollar, Gold, Crude Oil, and Bonds.
STOCKS
IT Trend Model: BUY as of 11/15/2016
LT Trend Model: BUY as of 4/1/2016
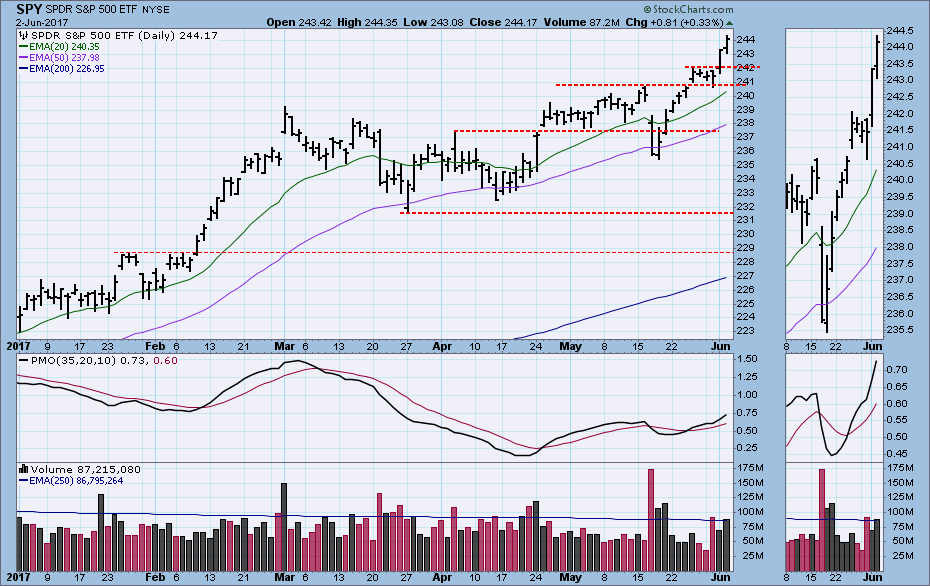
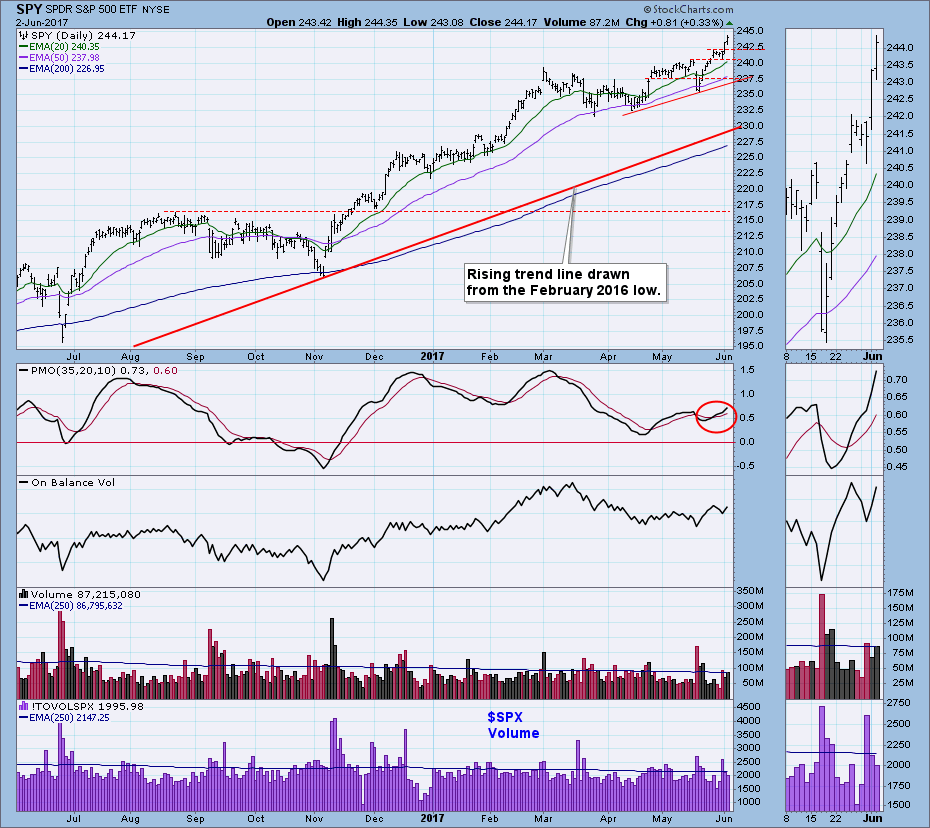
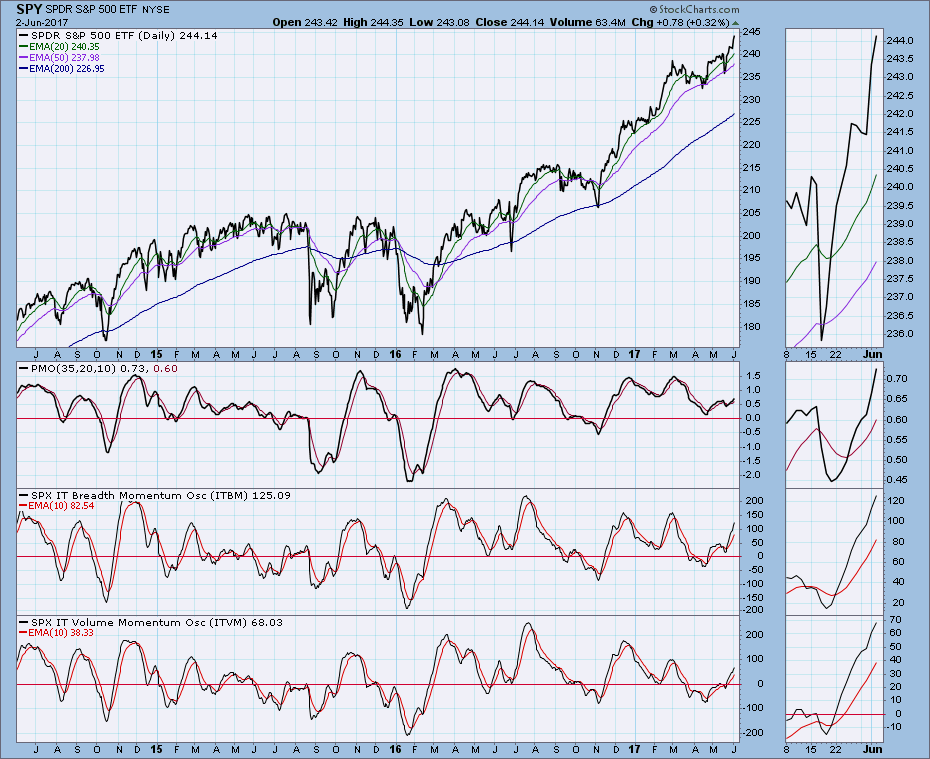
SPY is getting very overbought based upon the distance between price and its 200EMA, but the PMO is well below the top of its one-year range. The bull can push higher under these conditions, but it is difficult with the market being so overbought.
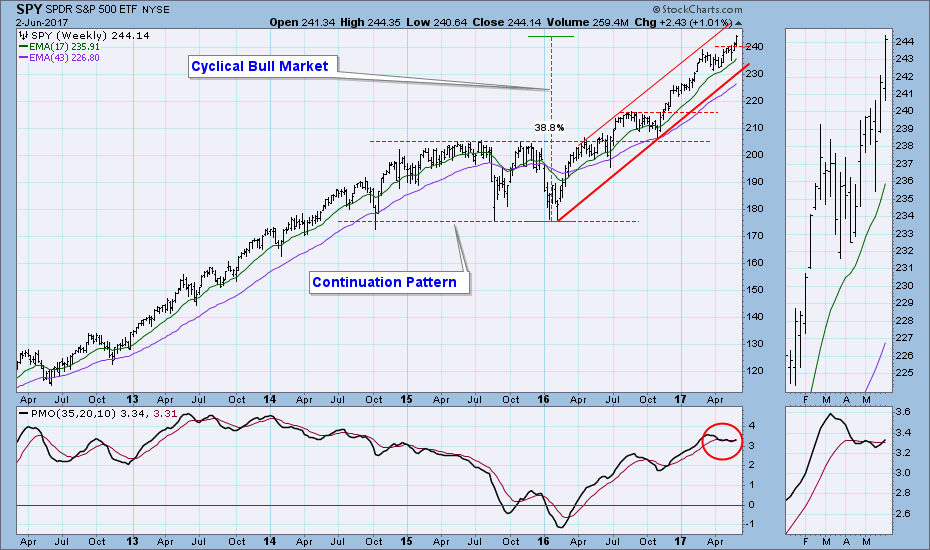
The weekly PMO is now rising above its signal line. I have drawn a line across the rising tops to highlight the channel. While the market is already overbought, it can still go higher within the rising trend channel.
Short-Term Market Indicators: These indicators whipsawed this week, turning down on Friday. Friday's change in direction was not expected, but the cause was very narrow breadth on that day.
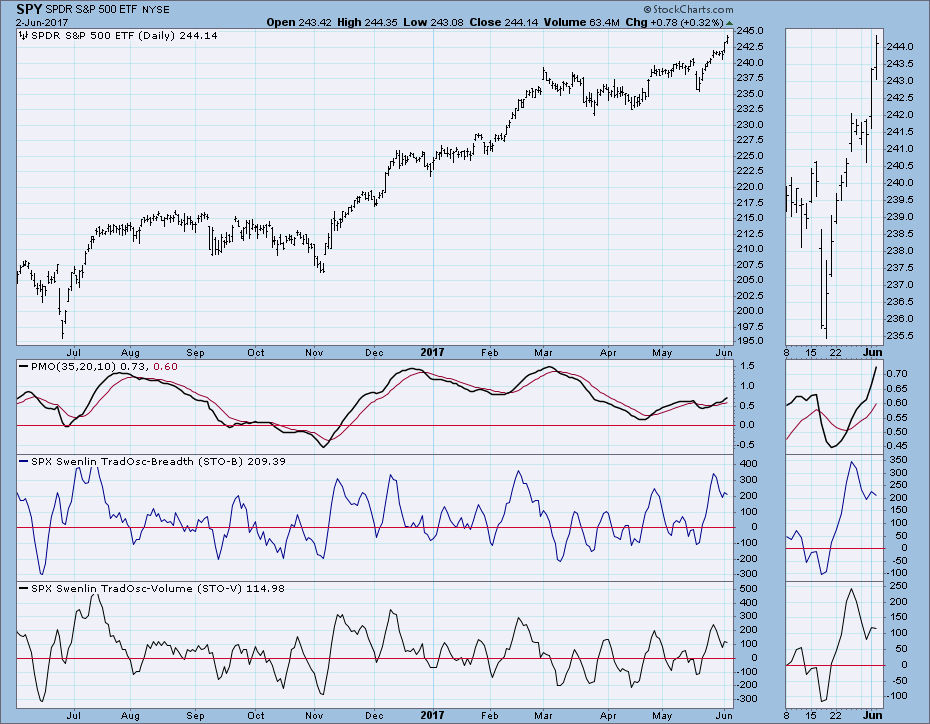
Intermediate-Term Market Indicators: The ITBM (breadth) is modestly overbought now, but all the indicators will allow for more price advance.
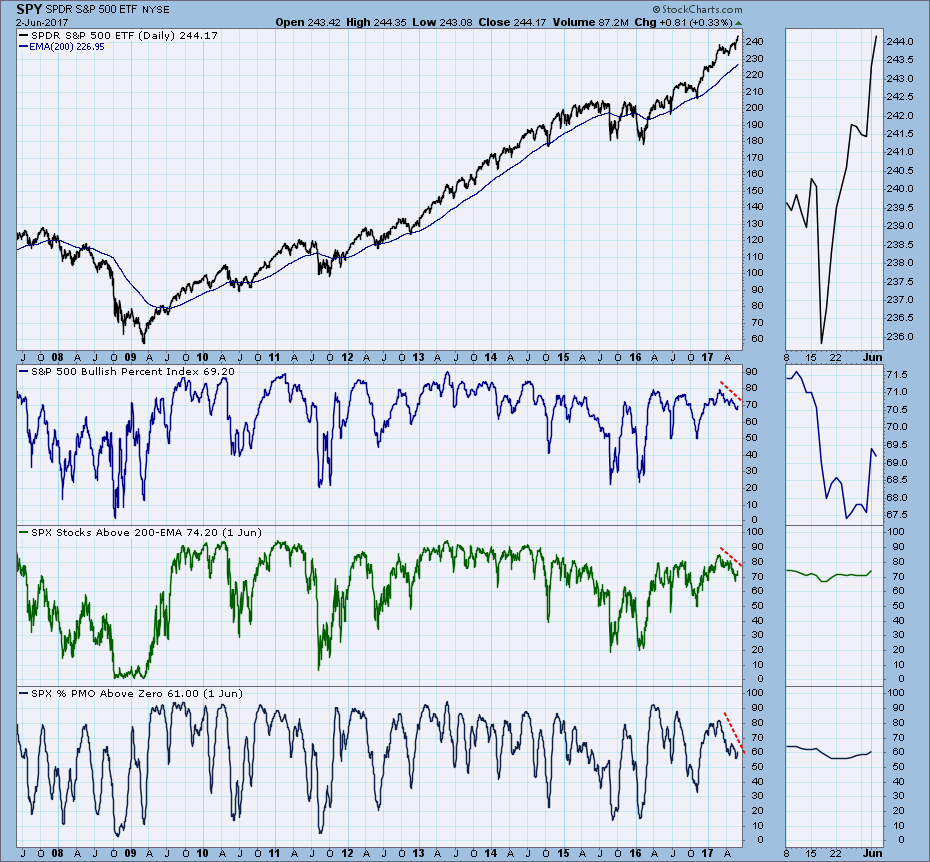
Participation: Last week we looked at the Bullish Percent Index (BPI), and this week I've added two more indicators that can help us gauge participation: Stocks Above 200EMA, and PMOs Above Zero. All three indicators have been retreating from their February tops, indicating that fewer and fewer stocks are participating in the rally. This week, they all turned up slightly, so it is possible that that internal trend may be about to reverse.
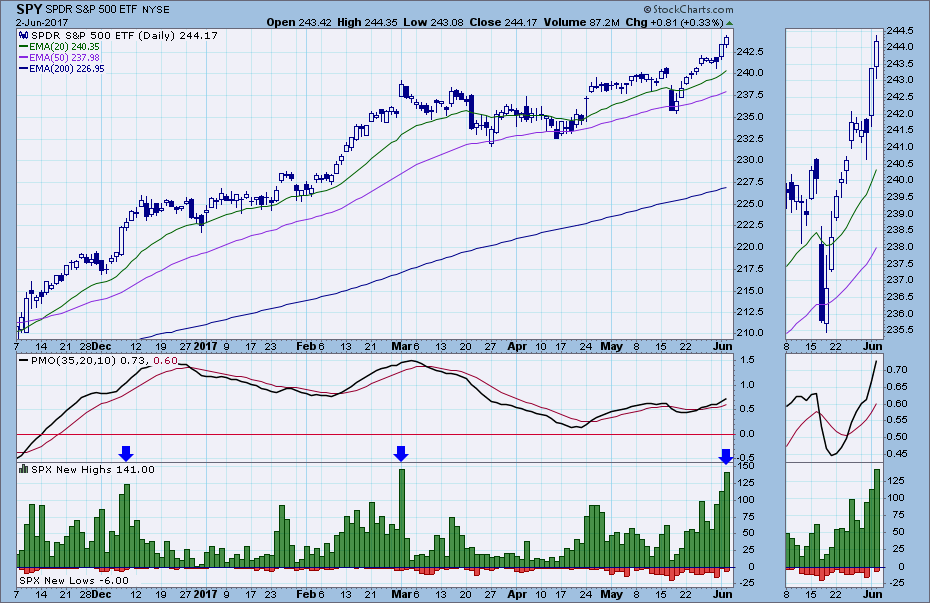
This next chart is really a short-term indication of participation. Friday's reading of S&P 500 New Highs was really climactic in nature. It could be an initiation climax which will launch the rally higher; however, since it occurred while a price advance was in progress, my best guess is that it is an exhaustion climax. We can see similar readings in December and March, which show us two possible outcomes. In December price continued higher for a few days, and then consolidated for three weeks. In March price went no higher, and it actually moved into a shallow but protracted correction. There are plenty of other possible variations, but I think we are close to a top that will usher us into a period of corrective activity.
Conclusion: While a weekly reminder may be too repetitive, I think it is important to remember that we are in a cyclical bull market within a longer-term secular bull market. In this environment we should expect situations to resolve bullishly more often than not. However, that does not preclude necessary corrections and consolidations from taking place. In fact, the spike in S&P 500 New Highs makes me think that the market may be on the verge of another consolidation or correction that could last several weeks. Until I saw that New Highs chart, I was thinking I would default in favor of the overall bull market and plan on a continued advance. Now my outlook is more cautious.
DOLLAR
IT Trend Model: NEUTRAL as of 3/21/2016
LT Trend Model: SELL as of 5/24/2017
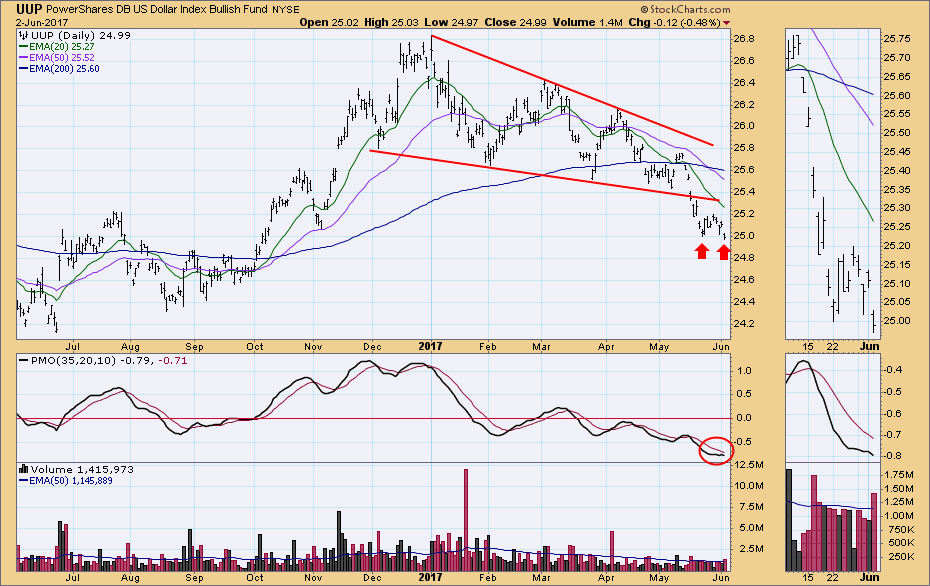
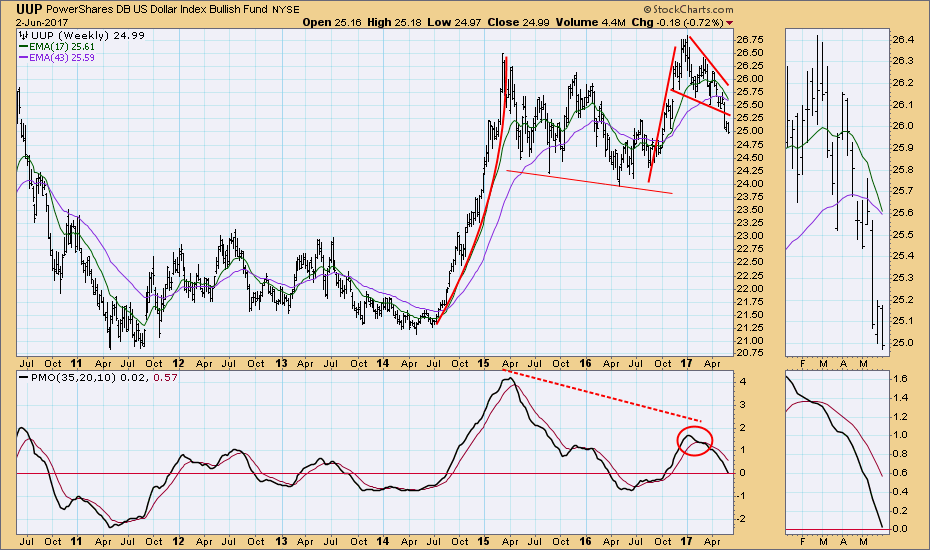
A couple of weeks ago UUP broke down from a falling wedge formation, and last week it had begun a bounce back toward the point of breakdown. This week it moved down again to test the short-term price low. At this point it doesn't look as though the test will be successful.
The UUP weekly chart shows the failed wedge in a broader context, and the weekly PMO is in a steep decline.
GOLD
IT Trend Model: BUY as of 5/22/2017
LT Trend Model: BUY as of 4/12/2017
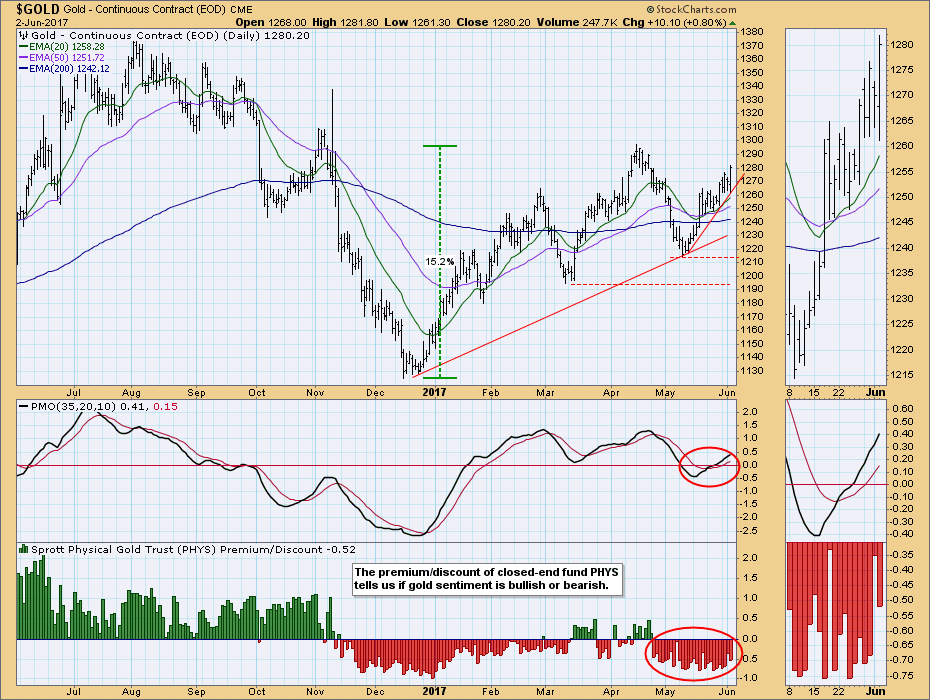
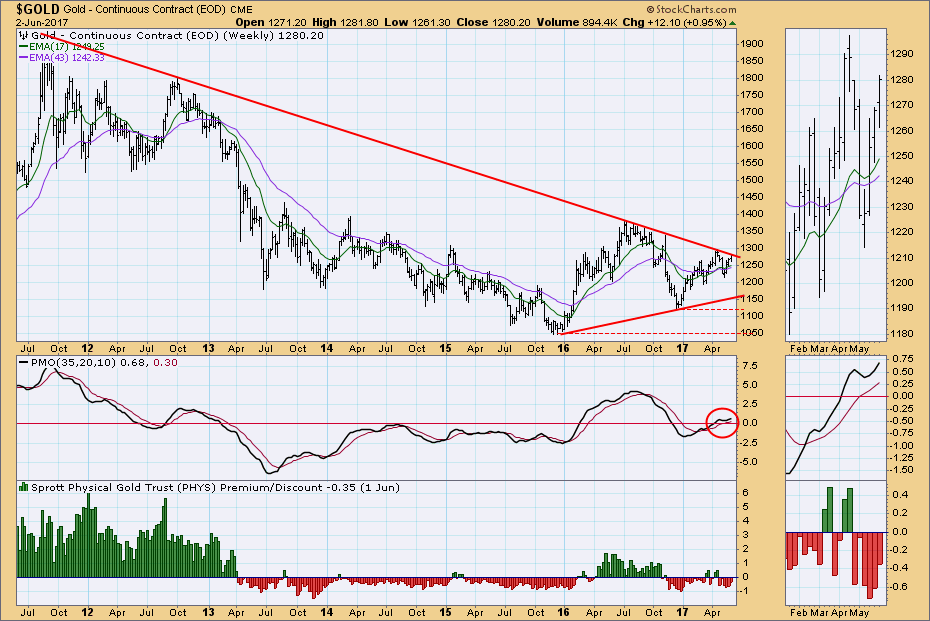
Gold's upward progress has been a bit tortured, but it is currently dealing with some significant overhead resistance, which is more evident on the weekly chart. Sentiment remains persistently bearish, an issue that must change before we can have confidence that any price advance will be sustained.
The upward momentum of the weekly PMO is not robust, but it is positive nonetheless. It will be significant if gold can break above the declining tops line drawn from the 2011 all-time high.
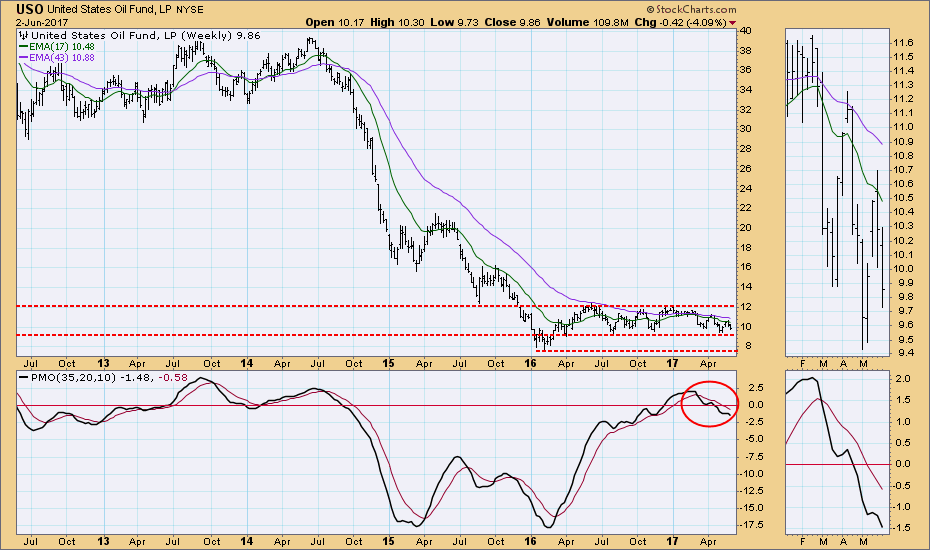
CRUDE OIL (USO)
IT Trend Model: NEUTRAL as of 3/8/2017
LT Trend Model: SELL as of 3/9/2017
This week USO continued the decline that started last week, and the daily PMO is close to crossing down through its signal line.
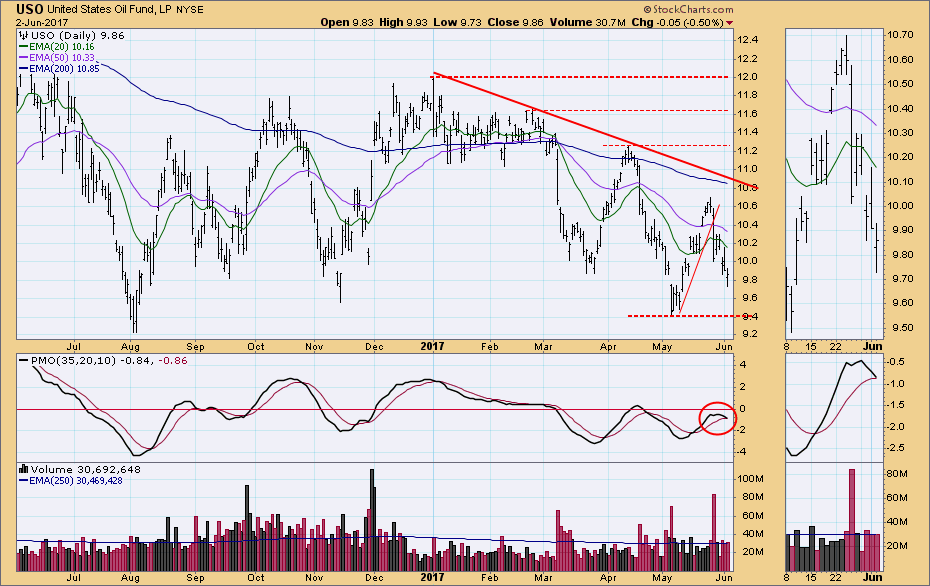
The USO weekly PMO has topped below its signal line again, a very negative configuration. At this point it seems likely that the long-term support at about 9.20 will be challenged.
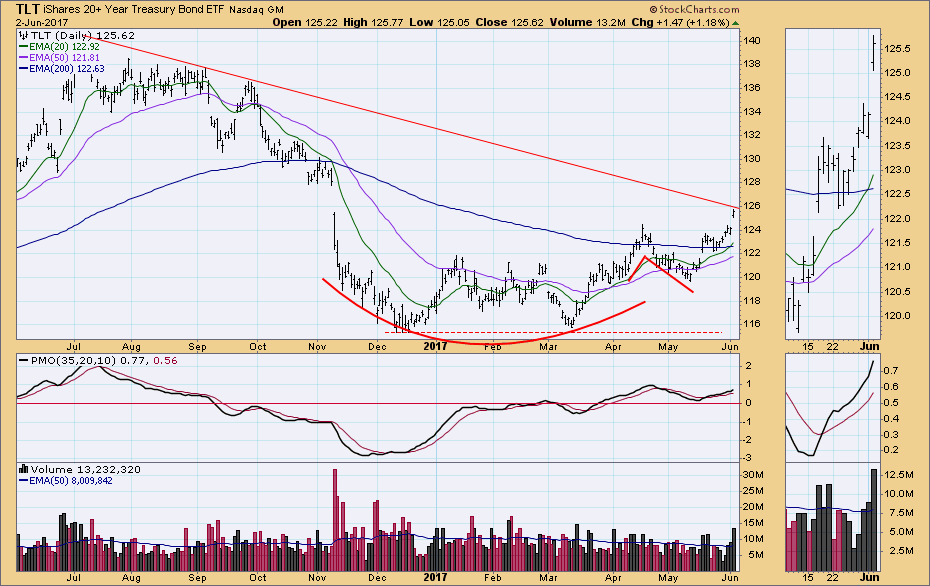
BONDS (TLT)
IT Trend Model: BUY as of 3/31/2017
LT Trend Model: SELL as of 11/17/2016
TLT struggled higher earlier this week, then it gapped up on Friday to challenge the declining tops line. I have left the Saucer with Handle notations in place, because it is a pretty good example of how that formation can work. It will probably take another two weeks for the 50EMA to cross up through the 200EMA and generate a LT Trend Model BUY signal, but I do think it is going to happen.
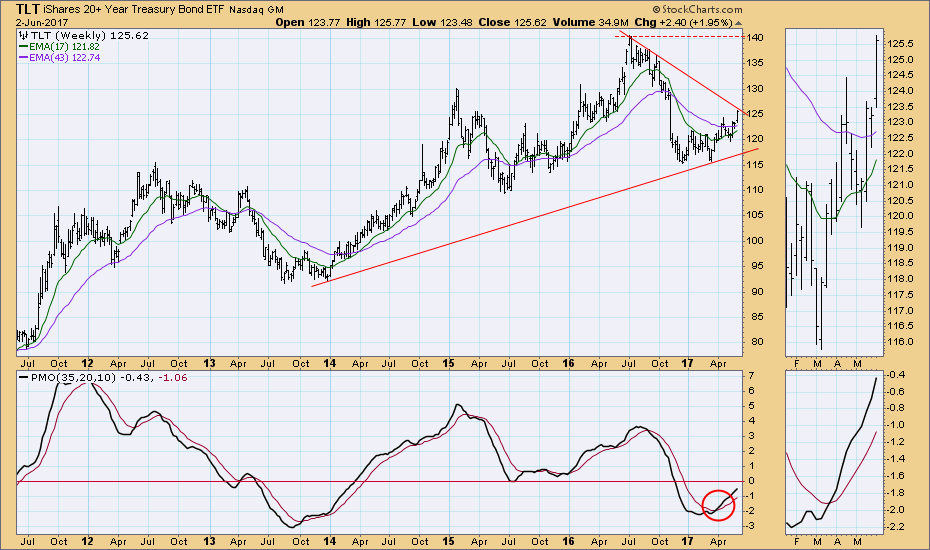
The weekly PMO is still rising above its signal line, and we can see how price is trying to break out of the triangle formation.
**Don't miss the DecisionPoint Alert Daily Commentary! Go to the "Notify Me" box toward the end of this blog page to be notified as soon as it is published at the end of the market day.**
Technical Analysis is a windsock, not a crystal ball.
Happy Charting!
- Carl
NOTE: The signal status reported herein is based upon mechanical trading model signals, specifically, the DecisionPoint Trend Model. They define the implied bias of the price index based upon moving average relationships, but they do not necessarily call for a specific action. They are information flags that should prompt chart review. Further, they do not call for continuous buying or selling during the life of the signal. For example, a BUY signal will probably (but not necessarily) return the best results if action is taken soon after the signal is generated. Additional opportunities for buying may be found as price zigzags higher, but the trader must look for optimum entry points. Conversely, exit points to preserve gains (or minimize losses) may be evident before the model mechanically closes the signal.
Helpful DecisionPoint Links:
DecisionPoint Shared ChartList and DecisionPoint Chart Gallery
Price Momentum Oscillator (PMO)
Swenlin Trading Oscillators (STO-B and STO-V)
