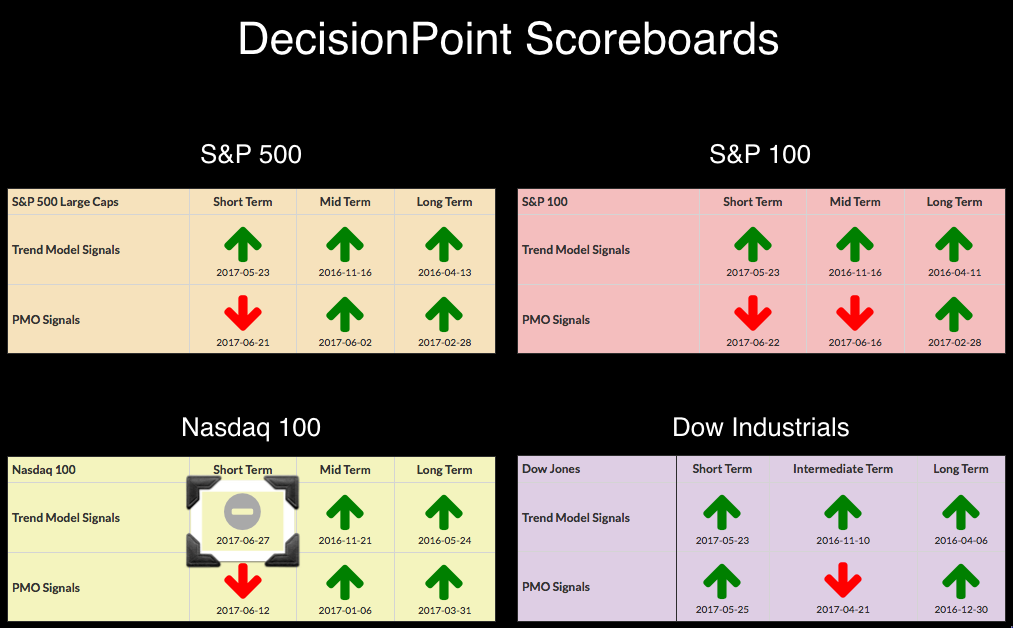
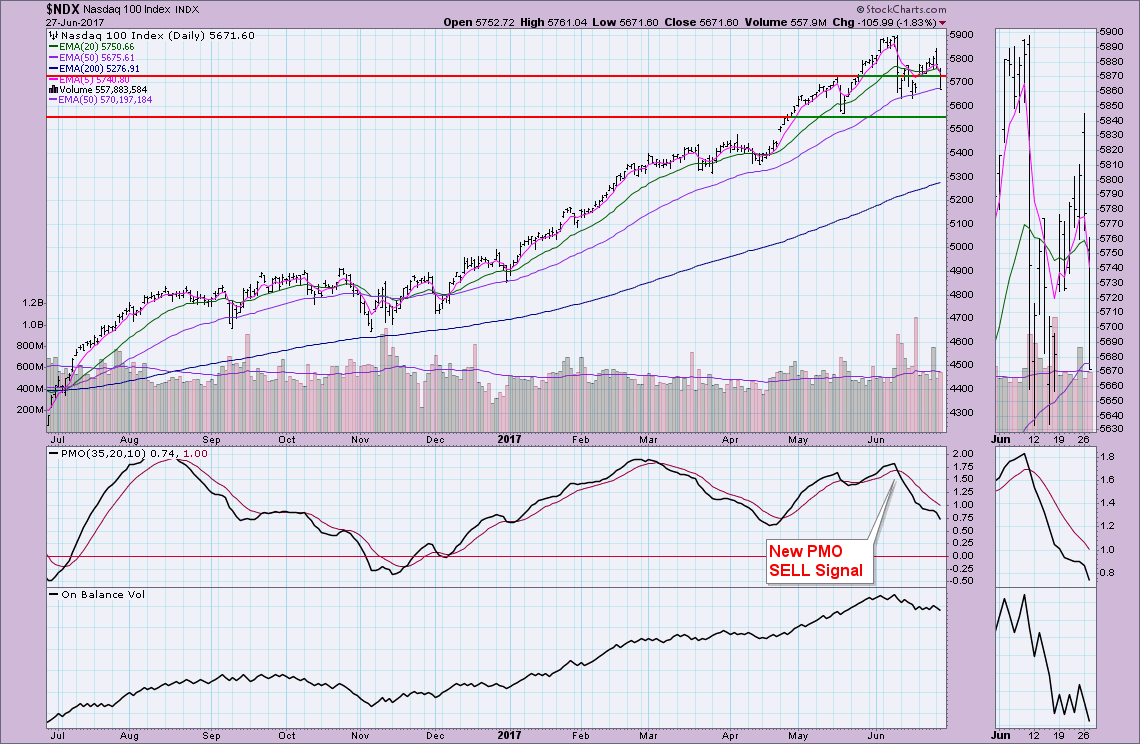
 As annotated on the DecisionPoint Scoreboard Summary, the Nasdaq 100 just triggered a new Short-Term Trend Model (STTM) Neutral signal as the 5-EMA crossed below the 20-EMA on the daily chart. Today's breakdown took out support at the May high and closed just below the 50-EMA. The PMO on the NDX is reaching previously oversold territory which is encouraging, but it is pointed straight down right now. I suspect we will see previous June lows tested at a minimum.
The purpose of the DecisionPoint Alert Daily Update is to quickly review the day's action, internal condition, and Trend Model status of the broad market (S&P 500), the nine SPDR Sectors, the U.S. Dollar, Gold, Crude Oil, and Bonds. To ensure that using this daily reference will be quick and painless, we are as brief as possible, and sometimes we let a chart speak for itself.
SIGNALS: Here we include charts of any important signal changes triggered today by our Intermediate-Term Trend Model.
NO NEW SIGNALS TO REPORT.
NOTE: Mechanical trading model signals define the implied bias of the price index based upon moving average relationships, but they do not necessarily call for a specific action. They are information flags that should prompt chart review. Further, they do not call for continuous buying or selling during the life of the signal. For example, a BUY signal will probably return the best results if action is taken soon after the signal is generated. Additional opportunities for buying may be found as price zigzags higher, but the trader must look for optimum entry points. Conversely, exit points to preserve gains (or minimize losses) may be evident before the model mechanically closes the signal.
STOCKS
IT Trend Model: BUY as of 11/15/2016
LT Trend Model: BUY as of 4/1/2016
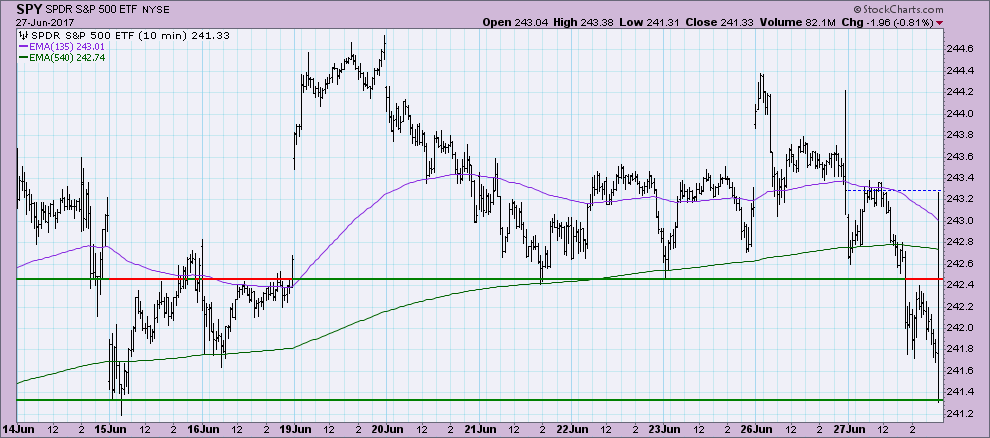
It wasn't a good day for the market as it traded below yesterday's close nearly all day. Not sure what the final 10 minute trading bar is related to, but most important is the close finished at session lows.
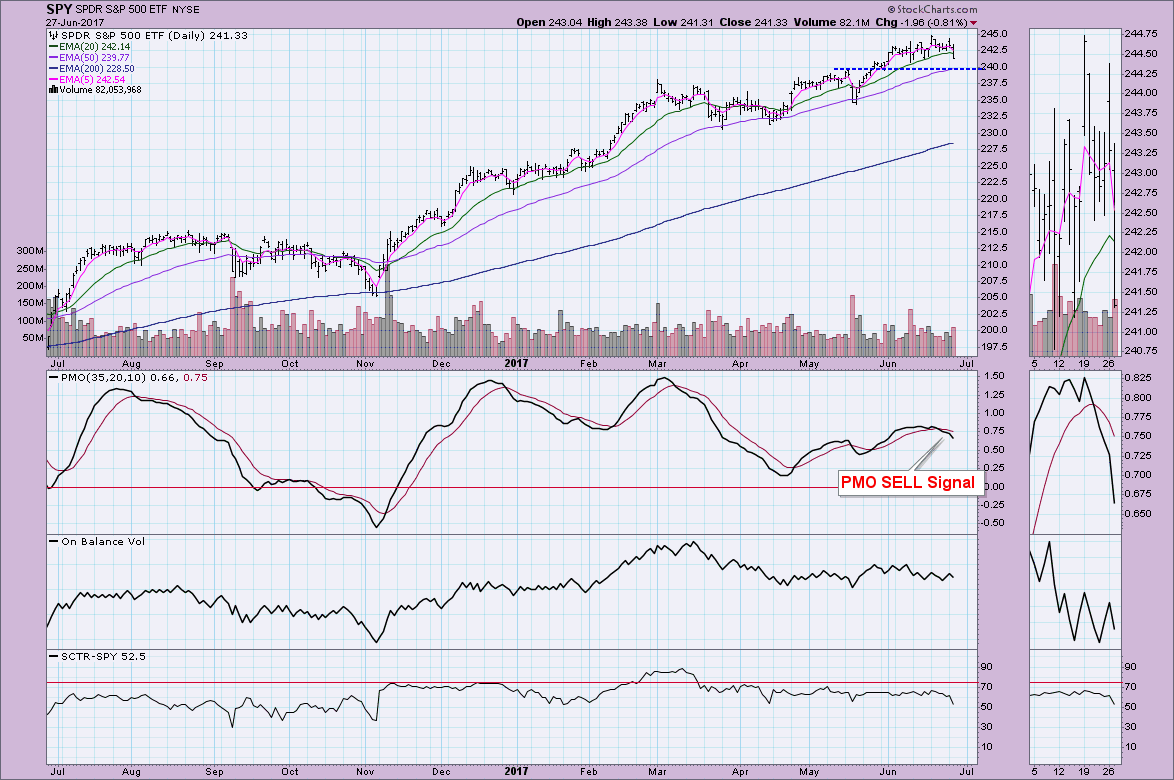
I find it disconcerting that after the last PMO BUY signal the market failed to rally much higher and has really been consolidating sideways throughout June. The new SELL signal could bring damage rather than consolidation this time. We're starting to see a gradual decline in the OBV and now the SCTR. Originally I thought that the support at the May high would hold just fine. I'm a little less optimistic seeing the SCTR dropping off and the failure of the 20-EMA holding as support.
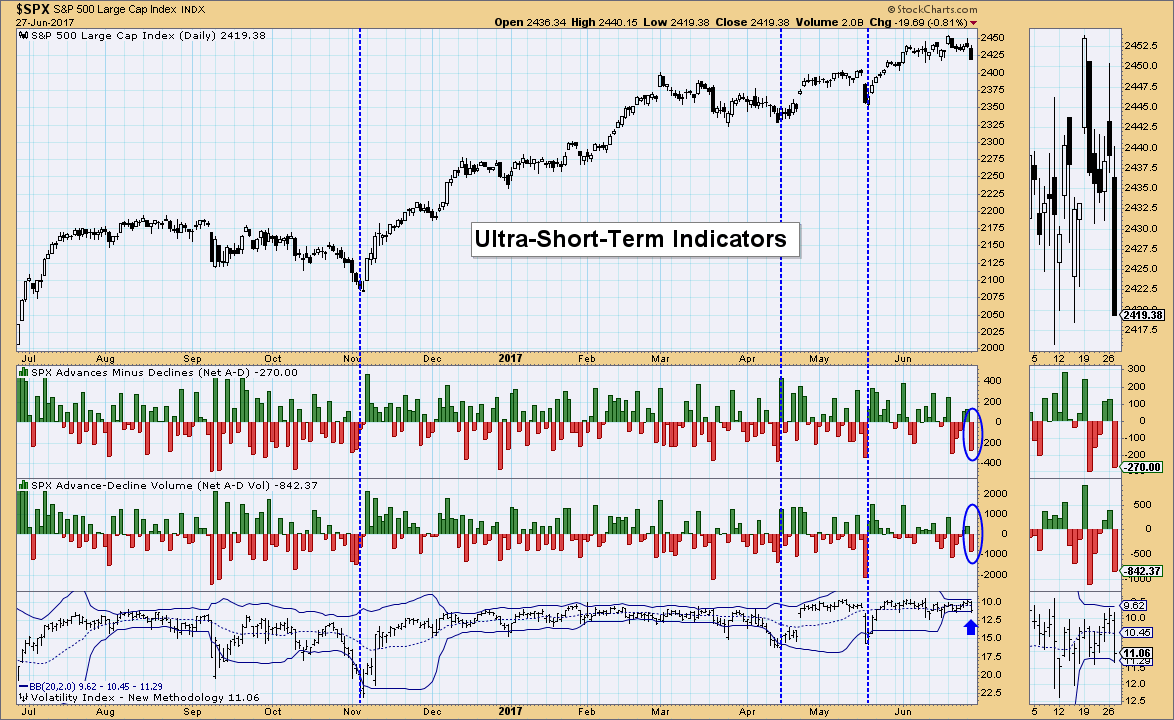
Ultra-Short-Term Indicators: We saw some climactic downside readings in breadth today that coincided with a penetration of the lower Bollinger Band. Since the market has essentially be tailing off for the past week, I consider these climactic readings in the very short term as bullish. The previous cases that I've highlighted finished with more than a rally pop and morphed into a rising trend. I do NOT think that will be the case based on my analysis above and the indicators below. We could see a reactionary bounce, but not a lengthy one.
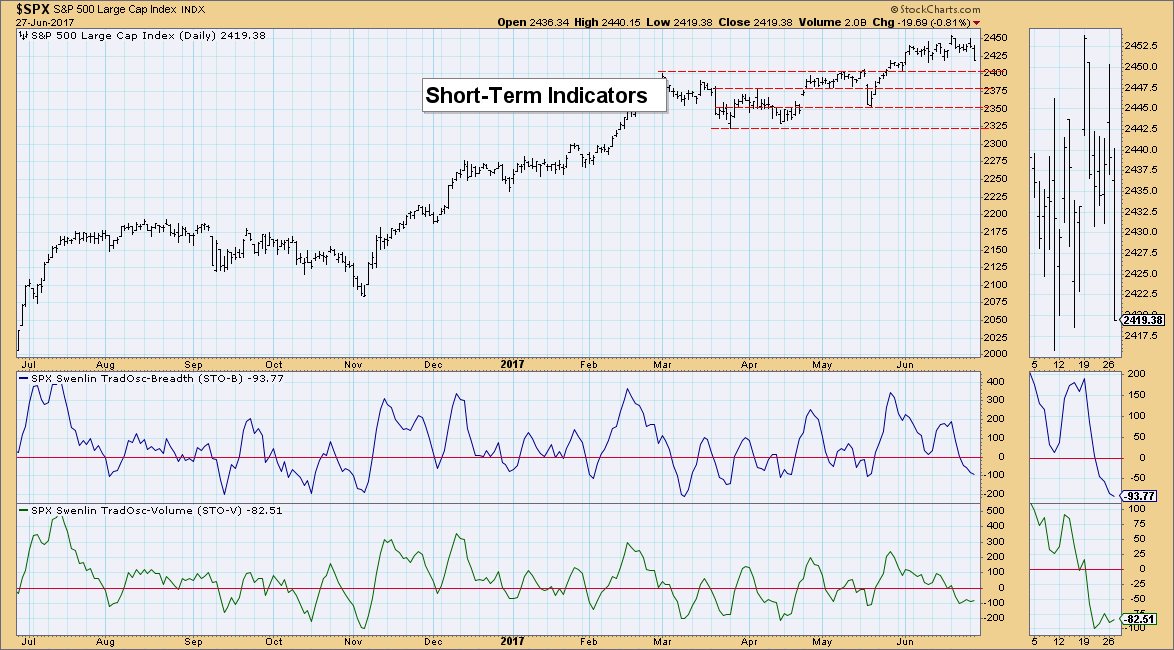
Short-Term Indicators: These indicators are beginning to decelerate in near-term oversold territory. The STO-B has yet to bottom and I find that bearish.
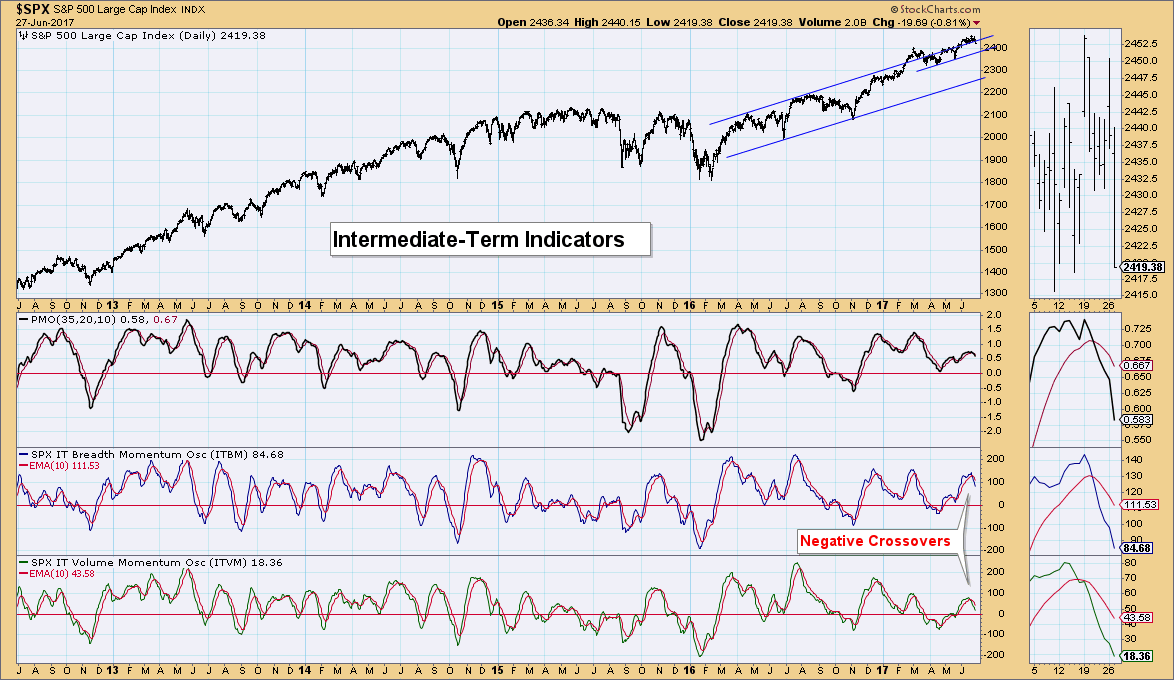
Intermediate-Term Indicators: These indicators have me worried. We are seeing a top and negative crossovers arriving right around the same time as the top of the rising trend channel is being punctured to the downside. I've drawn in a short-term rising bottoms trend line that could provide some support, but the cavern below that trendline is quite concerning.
Conclusion: It occurred to me while looking at the charts that our previous PMO BUY signal didn't amount to much. Typically in the bull market that we've been experiencing since the election, PMO BUY signals result in nice gains and PMO SELL signals are met with sideways consolidation, not corrections. This is different and therefore, concerning. I think we will likely see a small bounce tomorrow and maybe the next day, but intermediate-term indicators suggest we'll be lucky if we can get just consolidation out of this bearish scenario.
DOLLAR
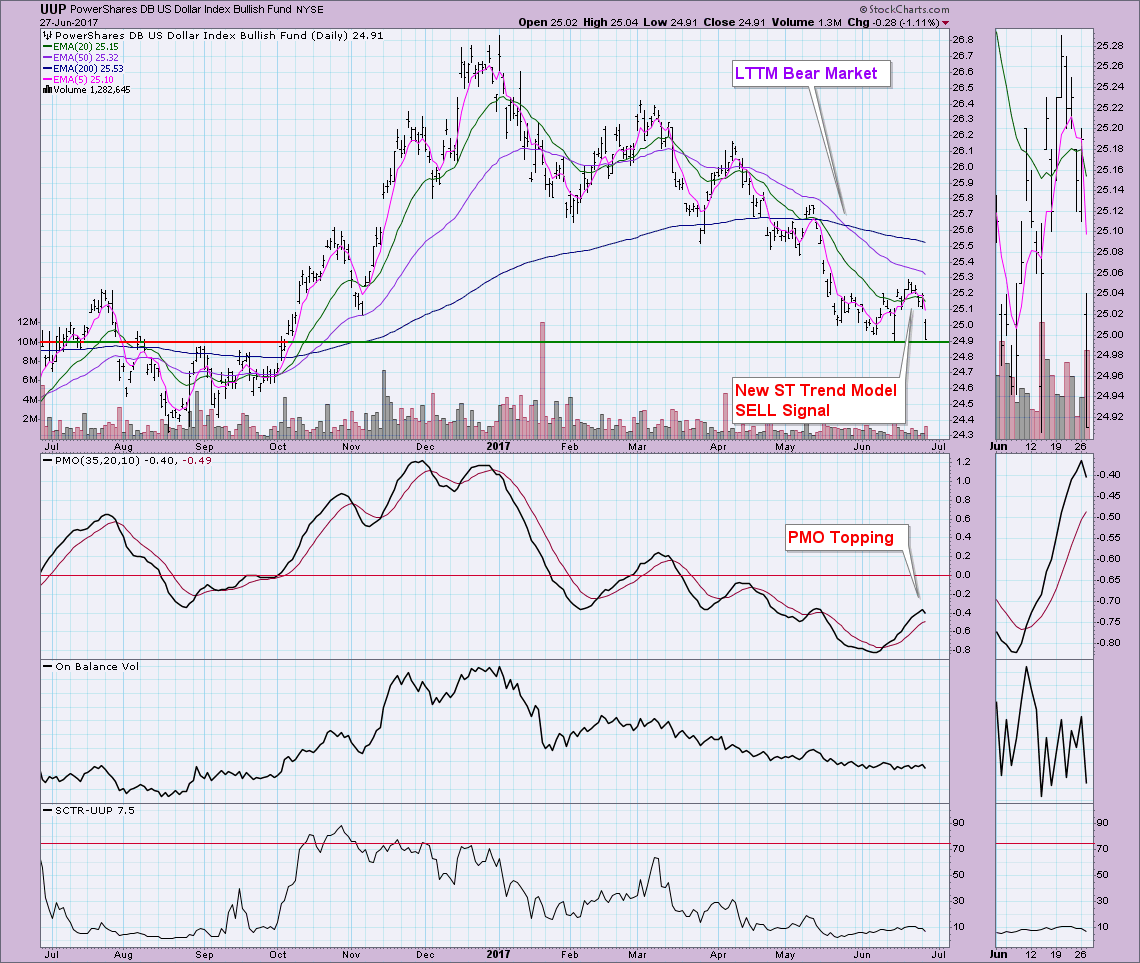
IT Trend Model: NEUTRAL as of 3/21/2016
LT Trend Model: SELL as of 05/24/2017
It appeared the Dollar was ready to make its stunning return off a bounce, but a hatchet job today pulled price all the way back down to support. In the process, a new STTM SELL signal was generated and the PMO was yanked downward. I'm not giving up on UUP, this has proven a good spot for support, I think UUP just has to start over again.
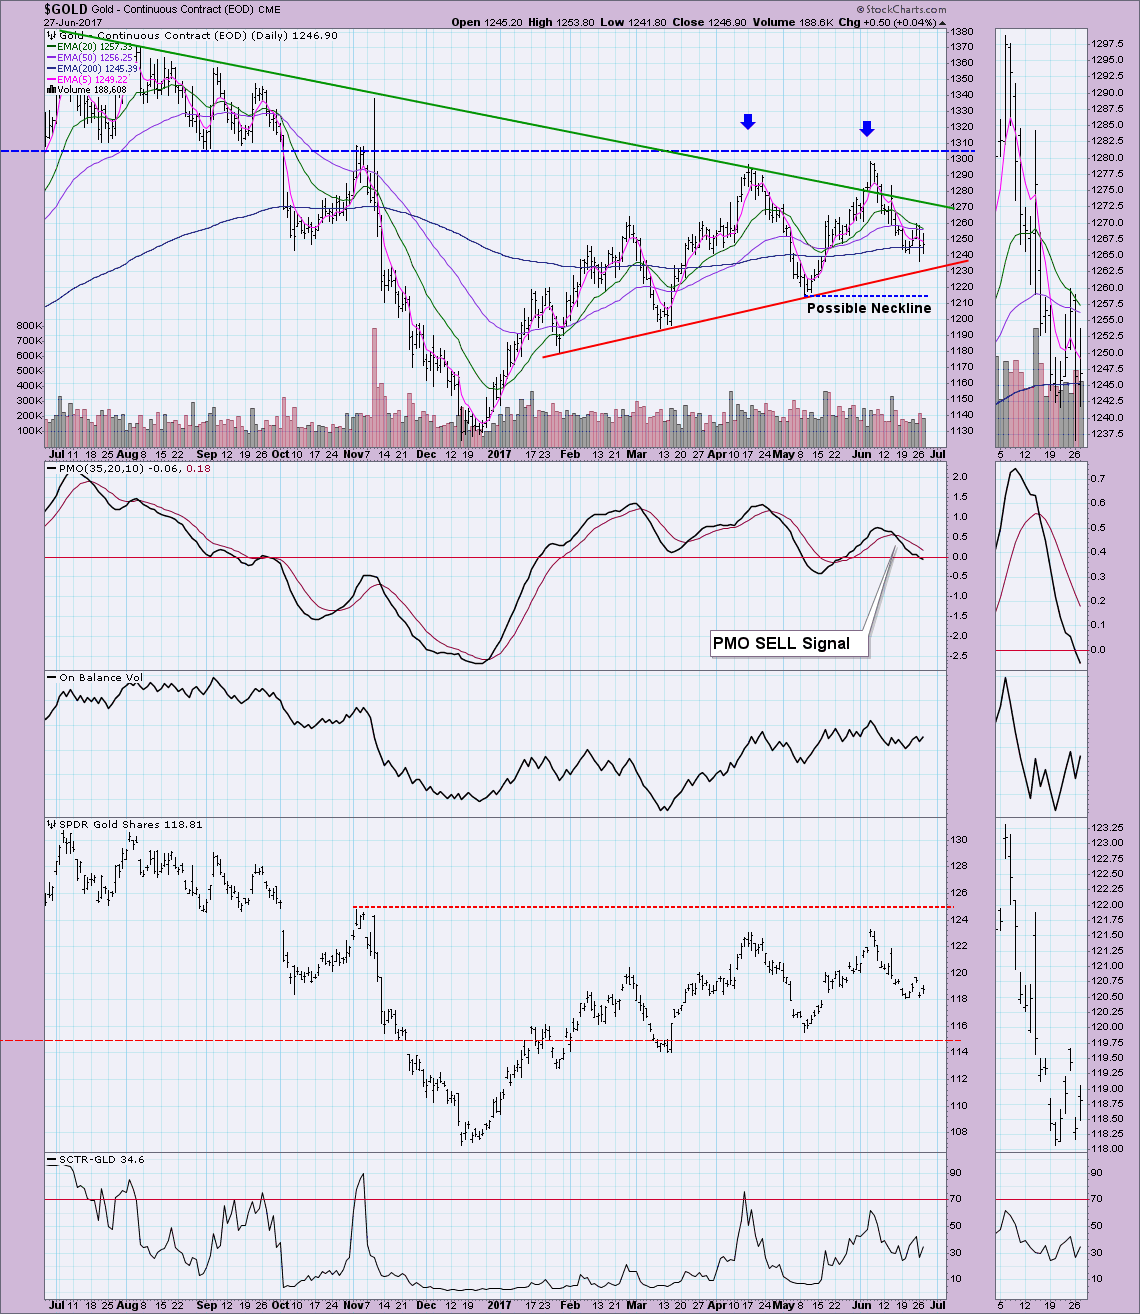
GOLD
IT Trend Model: BUY as of 5/22/2017
LT Trend Model: BUY as of 4/12/2017
If we see the market begin to struggle, pullback or gasp! correct, Gold will find favor. However, the Dollar is poised to rally right now. Gold is nearing rising bottoms support, but I'm expecting that to fail. The PMO is traveling lower and although the SCTR has a heartbeat, it is technically dropping. I also note that the 20-EMA is about to drop below the 50-EMA and that would trigger a new IT Trend Model Neutral signal. It's not out of the question that we'll see Gold rally, but I do think that's going to hinge on an ailing market.
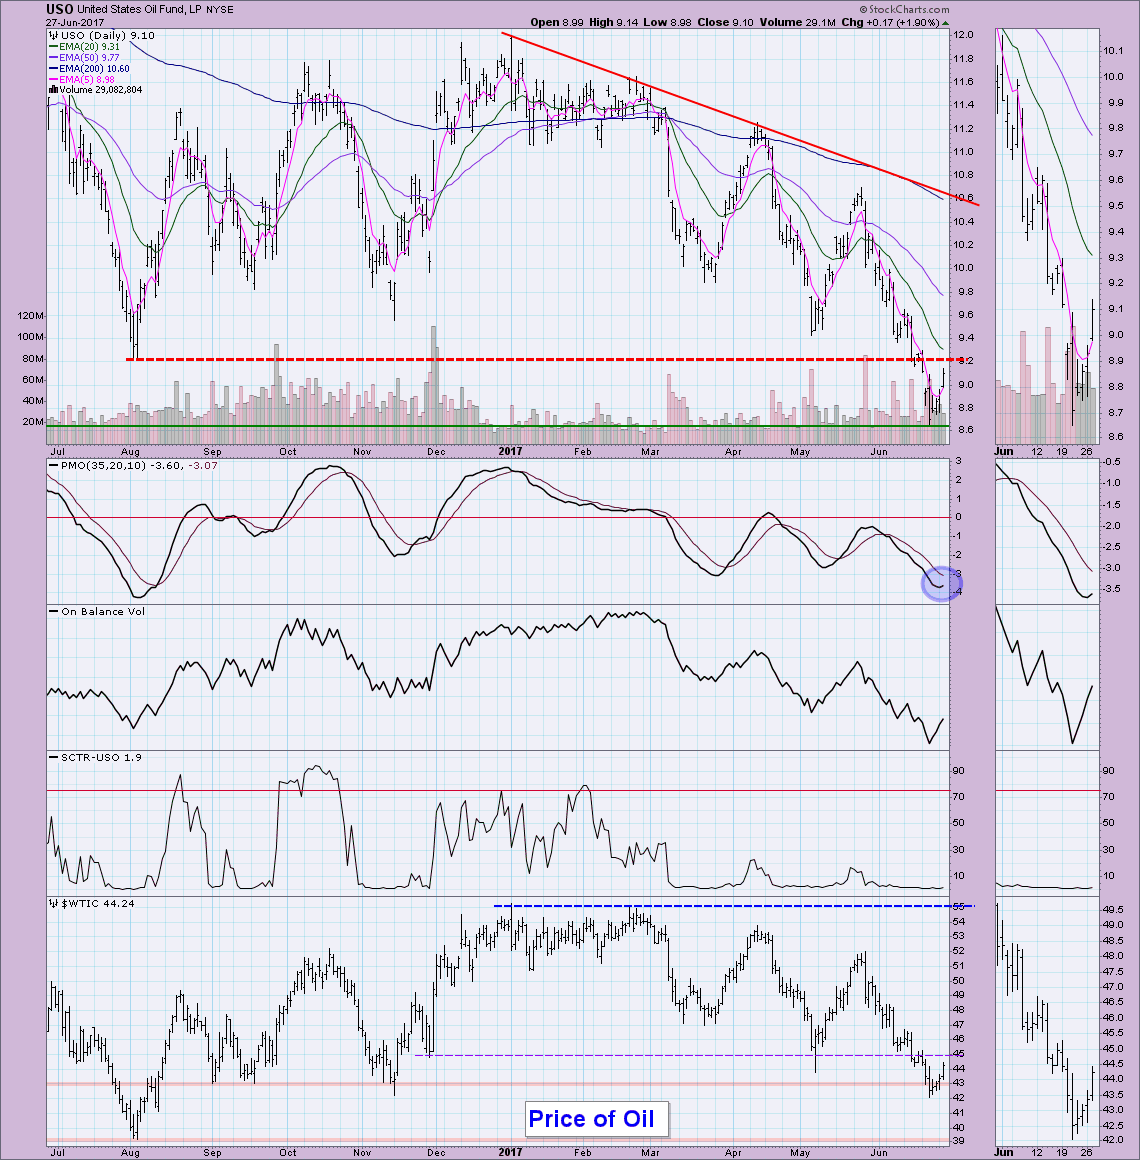
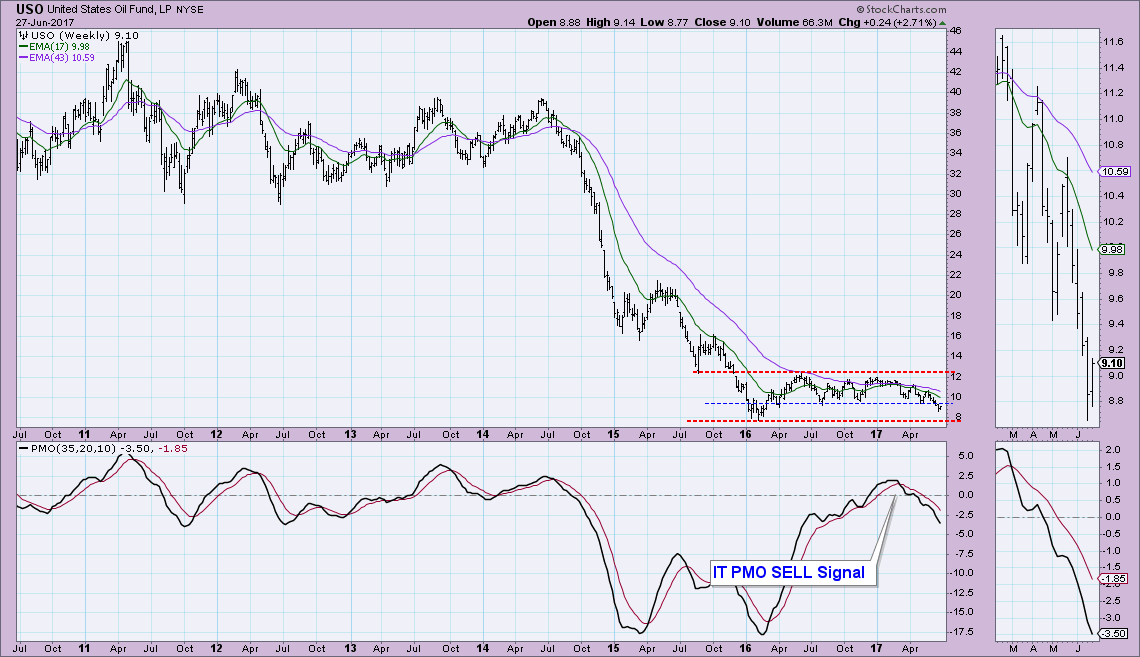
CRUDE OIL (USO)
IT Trend Model: NEUTRAL as of 3/8/2017
LT Trend Model: SELL as of 3/9/2017
Has Oil actually found a solid bottom? The PMO is suggesting it has. I'd like to see some confirmation from the OBV. Positive volume on the past four trading days is great, but it hasn't quite moved the OBV to new highs. Never mind the SCTR. I'd like to see USO successfully hurdle overhead resistance at $9.20. Just remember if you get in thinking the last support level is $8.50, beware. The weekly chart shows prices could easily move down to the $8.00 mark.
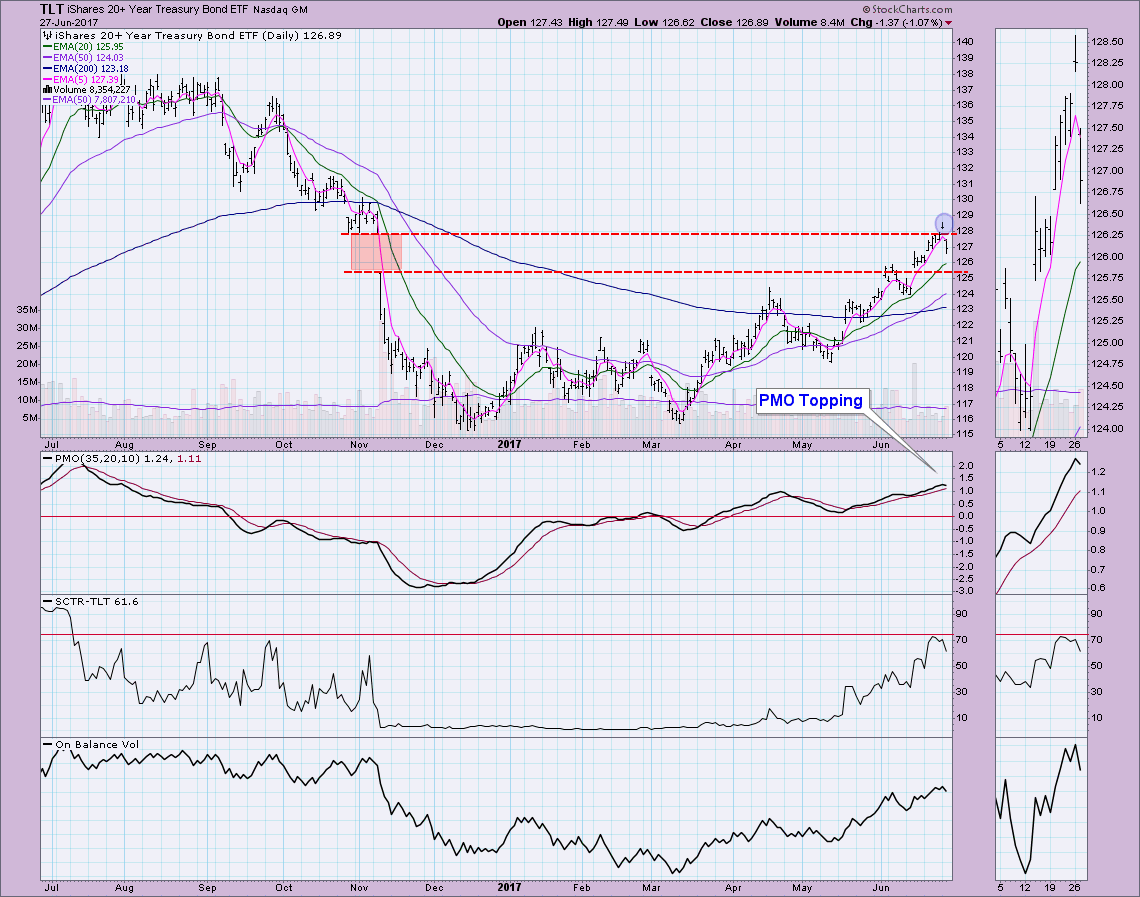
BONDS (TLT)
IT Trend Model: BUY as of 3/31/2017
LT Trend Model: BUY as of 6/16/2017
Both Tom and I were encouraged yesterday during the MarketWatchers LIVE show when we saw the breakout on TLT. However, it appears to have been an island reversal. The PMO has topped and the SCTR is turning lower. The OBV doesn't look particularly bearish, but the failure to hold support, even for a day is bothersome. I was told there was some big institutional selling going on today. I cannot confirm that, but it certainly looks as though 20-year Treasuries are out of favor in a big way. Notice in the thumbnail that not only yesterday's gap but last week's gap also that was closed on today's slide. This looks like the top for TLT.
Helpful DecisionPoint Links:
DecisionPoint Shared ChartList and DecisionPoint Chart Gallery
Price Momentum Oscillator (PMO)
Swenlin Trading Oscillators (STO-B and STO-V)
Technical Analysis is a windsock, not a crystal ball.
Happy Charting!
- Erin
**Don't miss DecisionPoint Commentary! Add your email below to be notified of new updates"**
