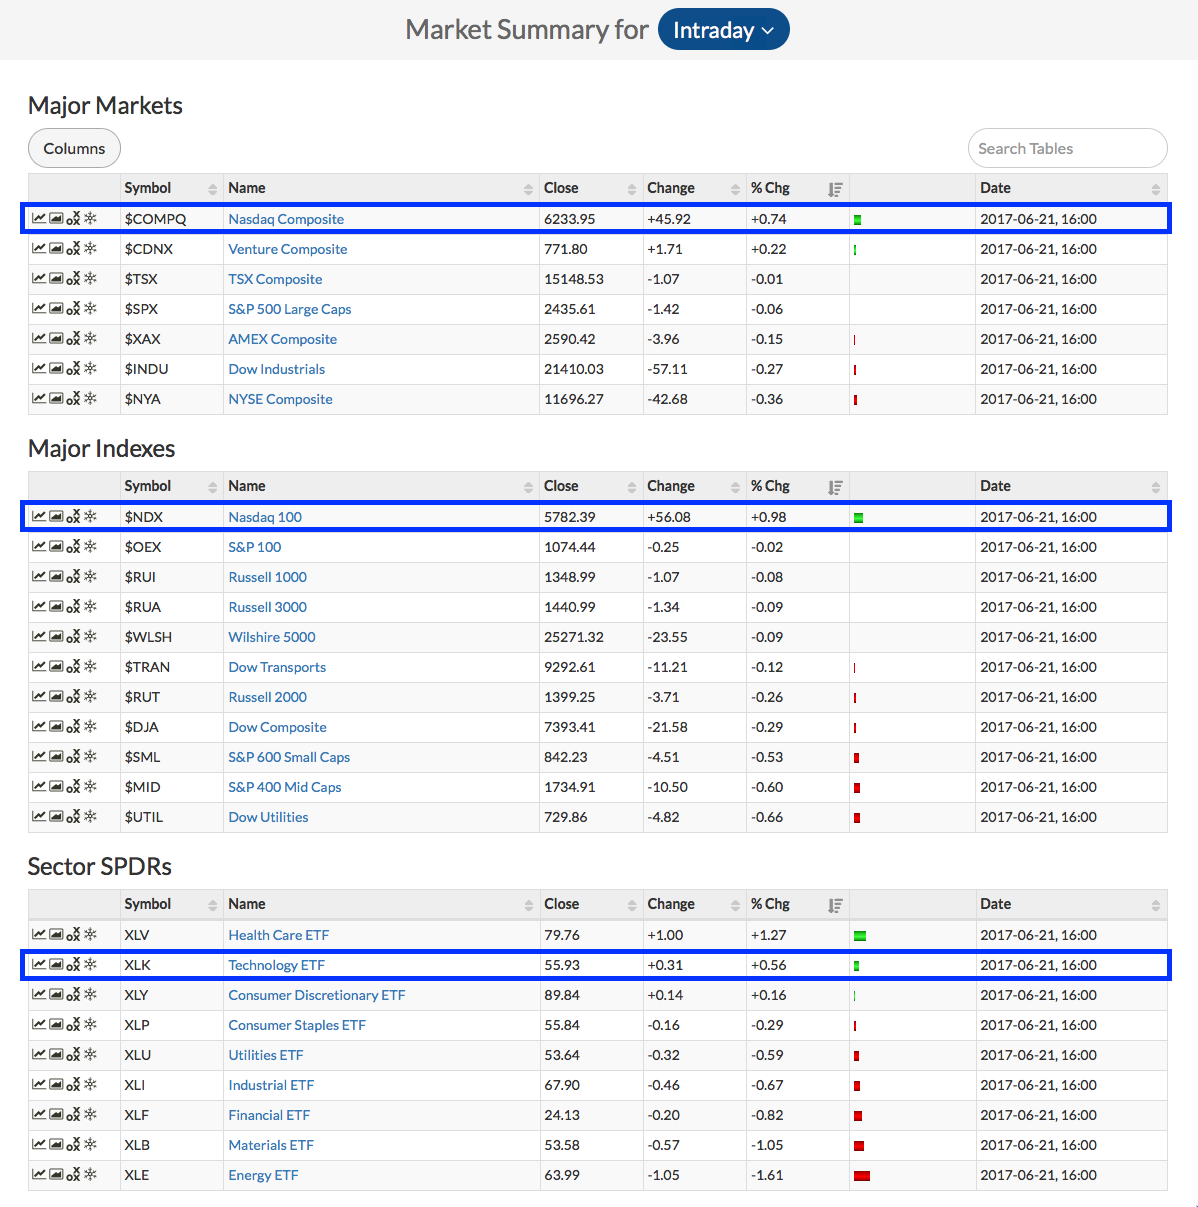
Today on MarketWatchers LIVE (airs M/W/F Noon - 1:30p EST) during the regular market updates, I noticed technology was rallying strongly. If you recall, the Nasdaq has been taking it on the chin more than the other major indexes on declines which is why the NDX is the only index Scoreboard carrying a PMO SELL signal. The question is whether we will see more rally. Below is the intraday Market Summary (the link is on the members homepage). An almost 1% move higher for the NDX today when the other indexes closed lower.
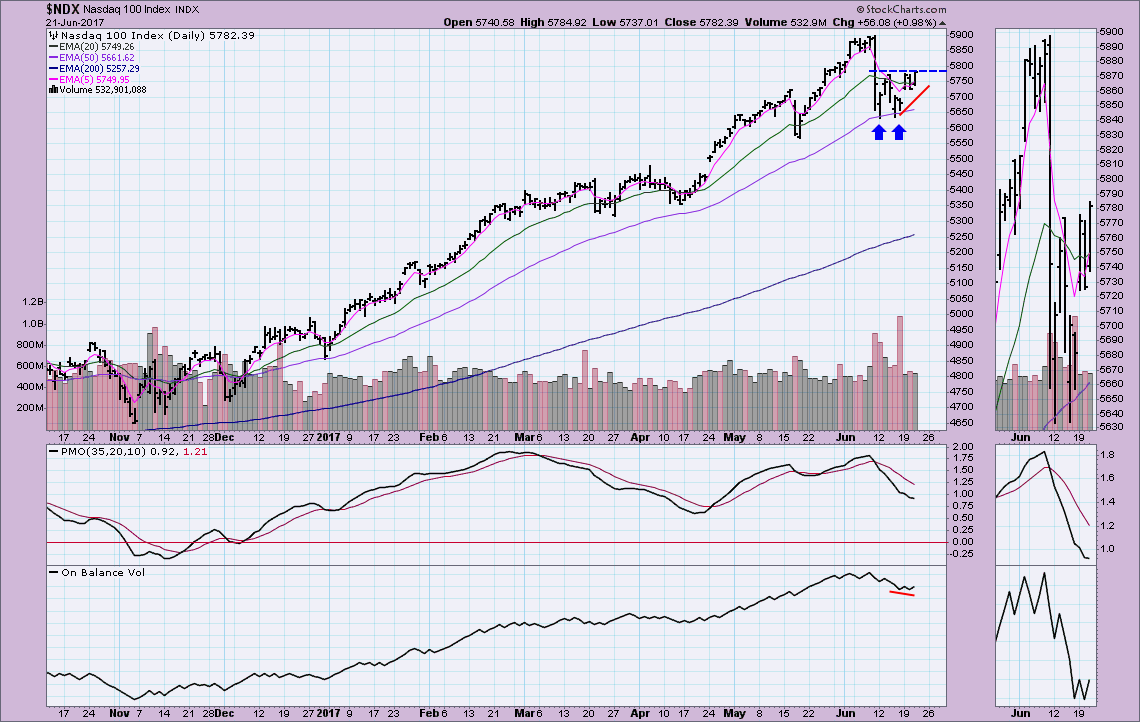
I decided to investigate further. I do see a possible double-bottom in play here which is bullish. We just got a new ST Trend Model BUY signal as the 5-EMA crossed above the 20-EMA. The PMO has decelerated. Problem I note is the last two OBV bottoms were moving lower as price bottoms moved slightly higher. The NDX is poised to make a move higher, but indicators aren't completely in line with that expectation.
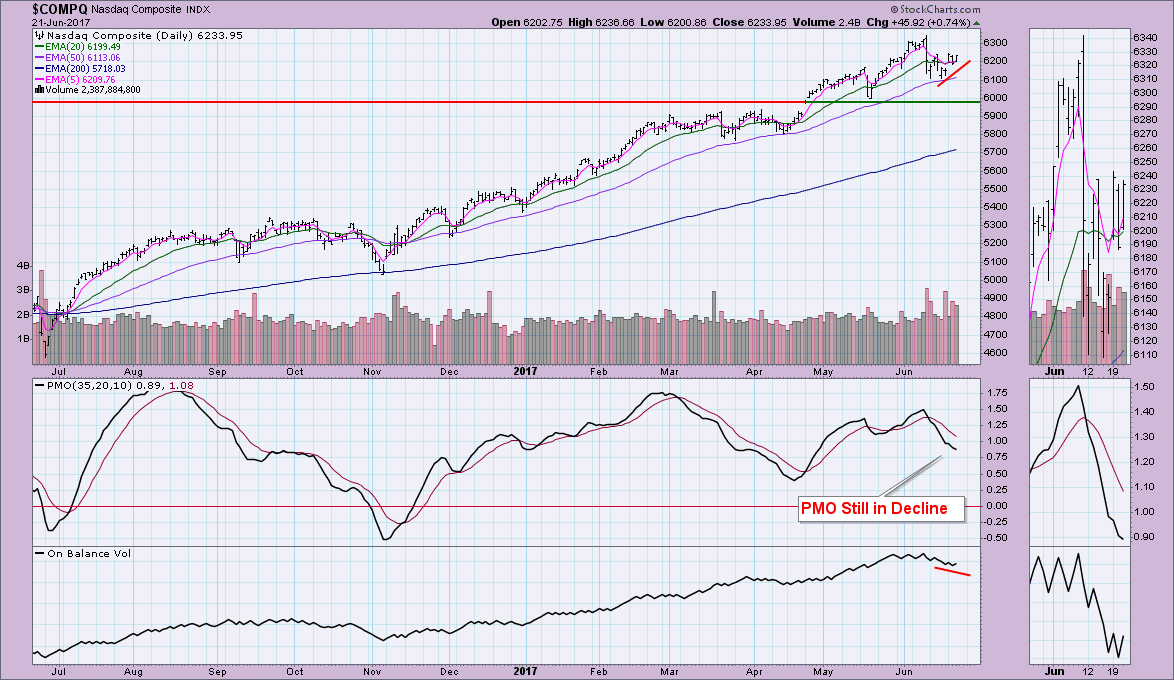
The Nasdaq index itself looks very similar (as it should) with a possible double-bottom in play and a recent ST Trend Model BUY signal. However, the negative divergence with the OBV is more pronounced. The PMO is also clearly still declining. Looking in the thumbnail, you could make a case for a reverse island forming which would call for the Monday gap to be closed on a decline. This is visible on all three charts.
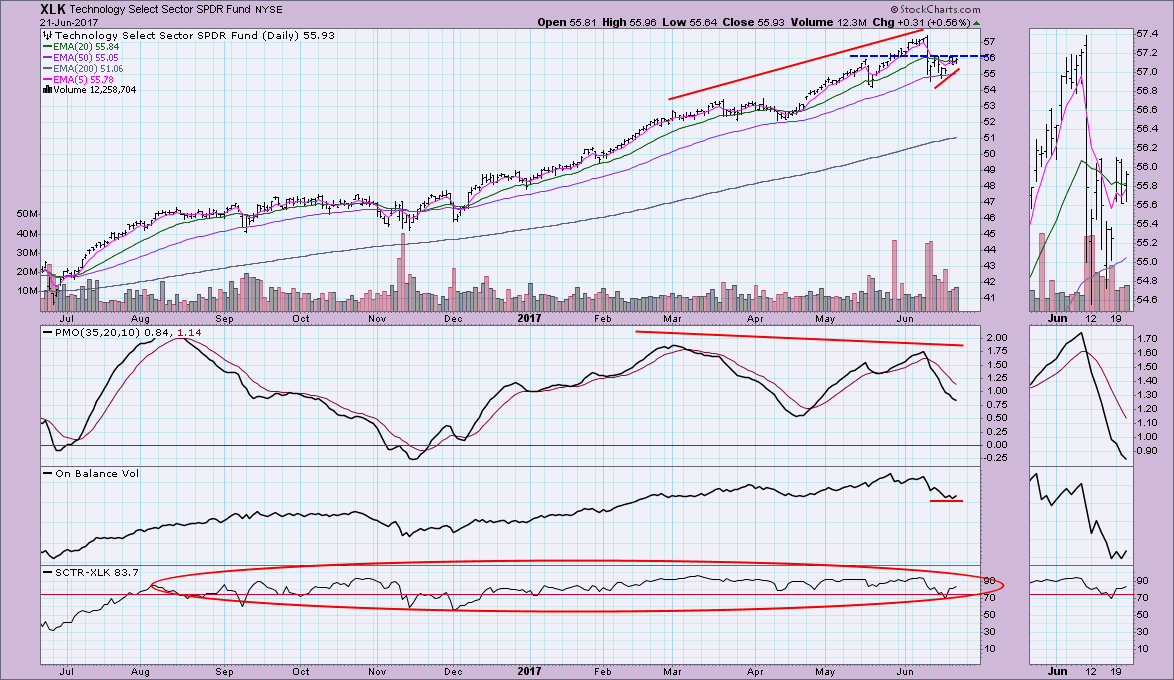
The Technology SPDR (XLK) isn't as bullish. Price is hitting resistance at the mid-May top. The other two hurdled that resistance with the current rally. Note we still don't have a positive 5/20-EMA crossover as we do on the other two. The PMO is declining and the OBV is in a negative divergence with price bottoms. The last negative (and I didn't annotate it because it is too early) is a possible head and shoulders forming on XLK with this last rally possibly forming a right shoulder if we don't get the breakout and execution of the double-bottom. One bullish thing to note is that internal strength in this sector is high. Note the very strong SCTR this year, this does give credence to an activation of the short-term double-bottom. Decision time for the tech sector. Indicators are mixed. While I'm leaning toward this being an island reversal... based on internal strength, I wouldn't expect a drop below the recent lows that formed the double-bottom.
Helpful DecisionPoint Links:
DecisionPoint Shared ChartList and DecisionPoint Chart Gallery
Price Momentum Oscillator (PMO)
Swenlin Trading Oscillators (STO-B and STO-V)
Technical Analysis is a windsock, not a crystal ball.
Happy Charting!
- Erin
**Don't miss DecisionPoint Commentary! Add your email below to be notified of new updates"**
