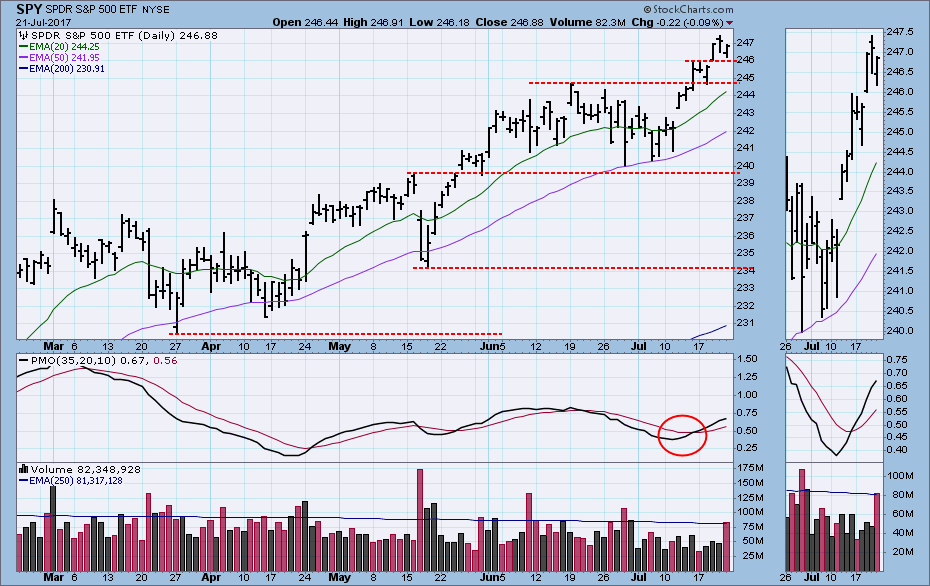
Last week the market broke out of a month-long rounded top to new, all-time highs. This week there was a short snapback to the point of breakout, then on Wednesday it once again broke to new, all-time highs. Thursday and Friday it again pulled back to the point of breakout. Friday was options expiration day, so there is no sinister message to be found in the high volume on SPY.
The DecisionPoint Weekly Wrap presents an end-of-week assessment of the trend and condition of the stock market (S&P 500), the U.S. Dollar, Gold, Crude Oil, and Bonds.
STOCKS
IT Trend Model: BUY as of 11/15/2016
LT Trend Model: BUY as of 4/1/2016
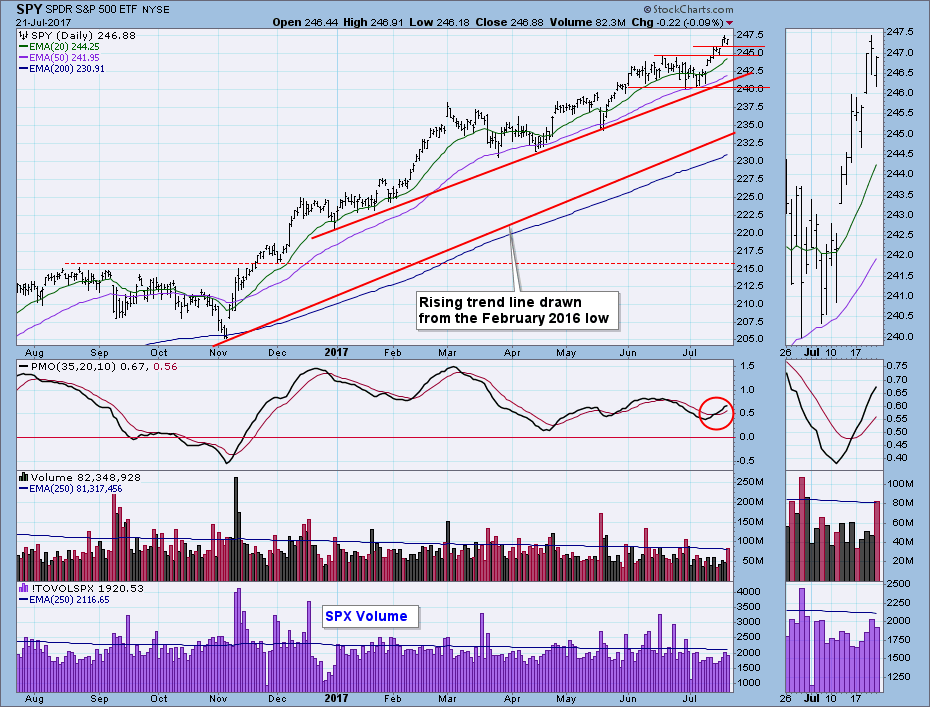
Based upon how far price is above the 200EMA, we can safely say that the market is overbought. One of these days price is going to correct back to the bull market rising trend line, but it hasn't had the inclination to do so for about nine months. On the large PMO panel below the PMO looks as if it is trying to top, but the thumbnail chart shows no such inclination.
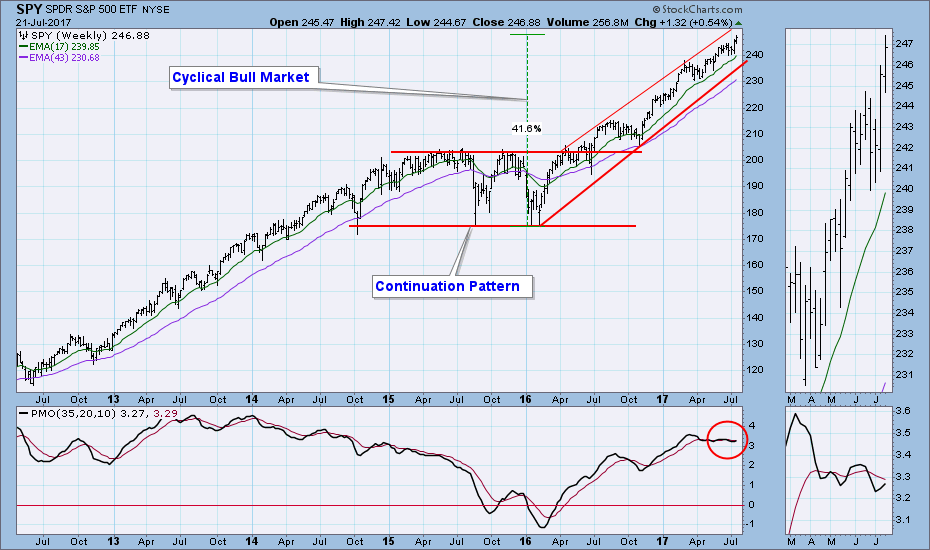
During the current cyclical bull market price has advanced +42% off the February 2016 low. Price is hugging the top half of the rising trend channel, and the weekly PMO is moving sideways at a high level. Nothing but strength showing here.
Short-Term Market Indicators: The bottom two indicators have topped, so we may see price moving sideways in this time frame.
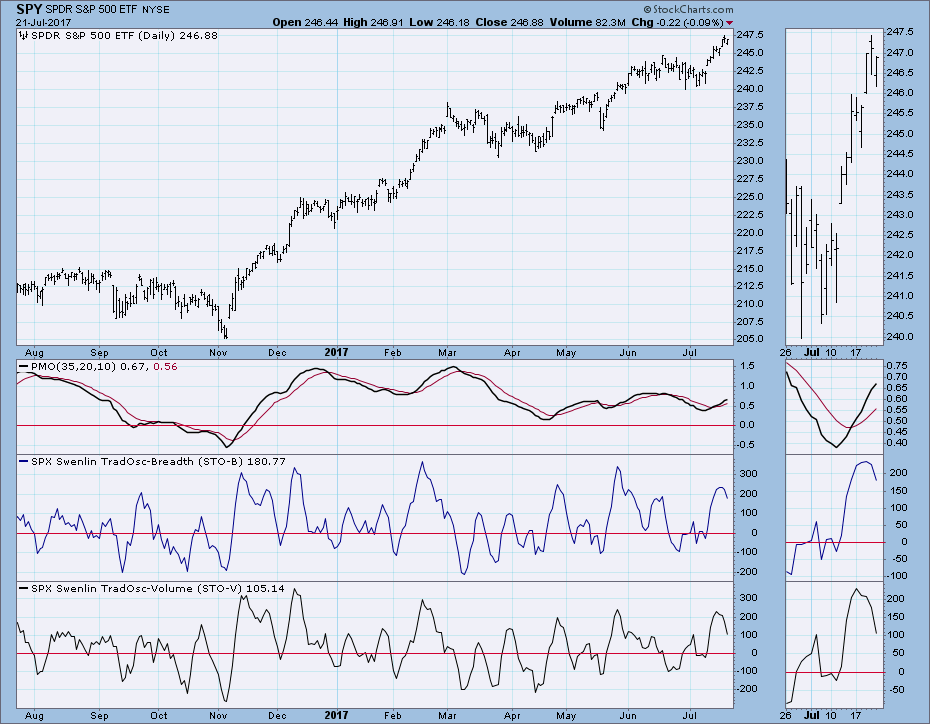
Intermediate-Term Market Indicators: These indicators are moving higher from recent bottoms in the neutral zone. They have room to accommodate higher price, but price is pretty overbought.
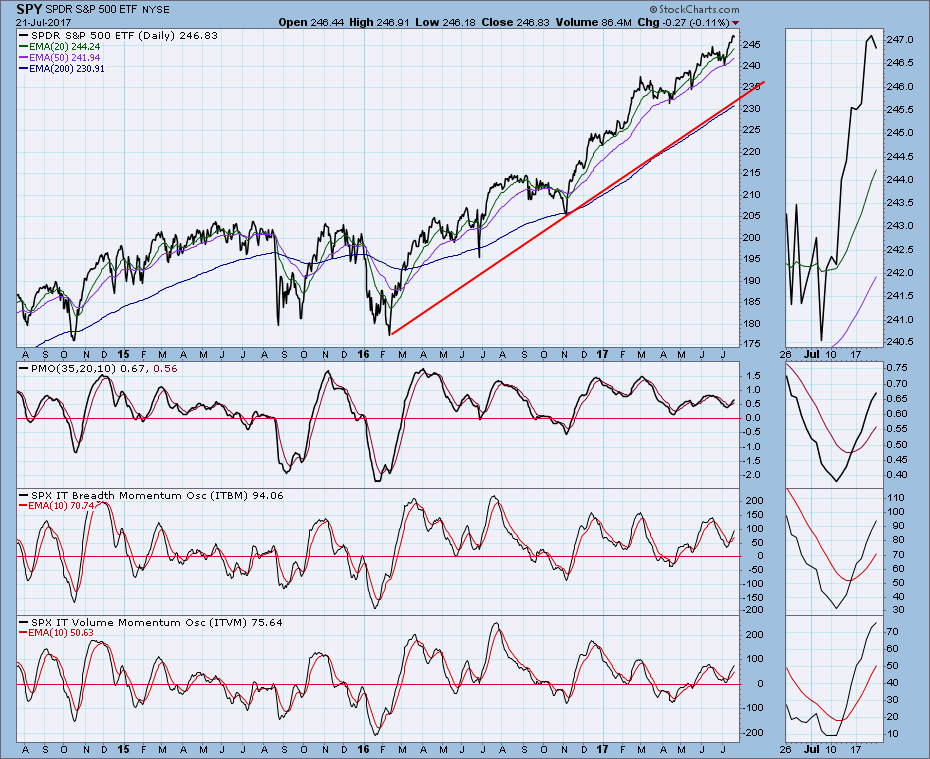
Conclusion: Short-term indicators imply that some sideways movement in price is possible, but intermediate-term indicators allow for higher prices. Internals aside, price is far above the bull market rising trend line (see chart above), which is a compelling picture of how overbought the market is. Some amount of correction is needed, but in a strong bull market it is not a setup for shorting.
DOLLAR
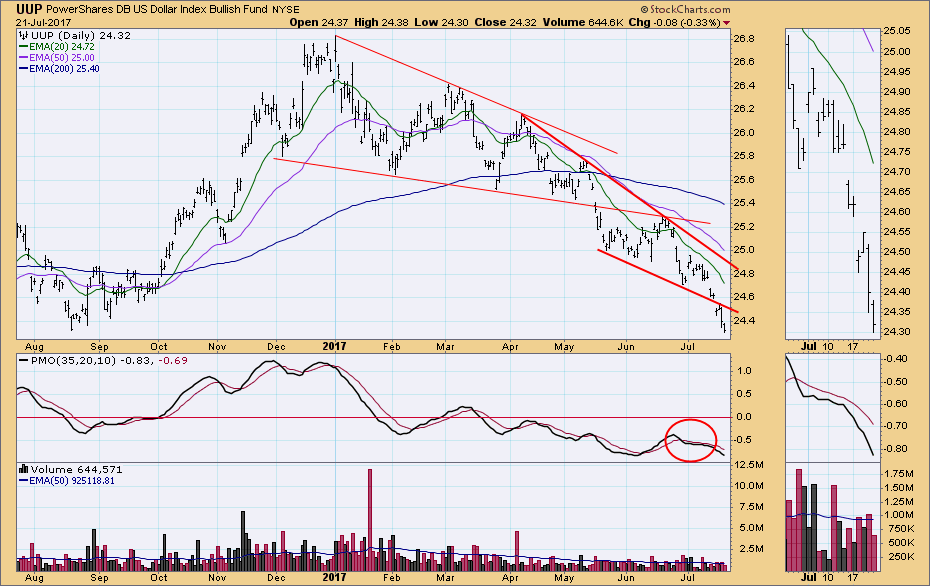
IT Trend Model: NEUTRAL as of 3/21/2016
LT Trend Model: SELL as of 5/24/2017
Last week it looked as if UUP was going to fall below the bottom of the falling wedge pattern, and on Tuesday it did just that. We can see that this is the second time since May that a bullish falling wedge has resolved bearishly, and there is a clear impression that the price decline from the January high is accelerating.
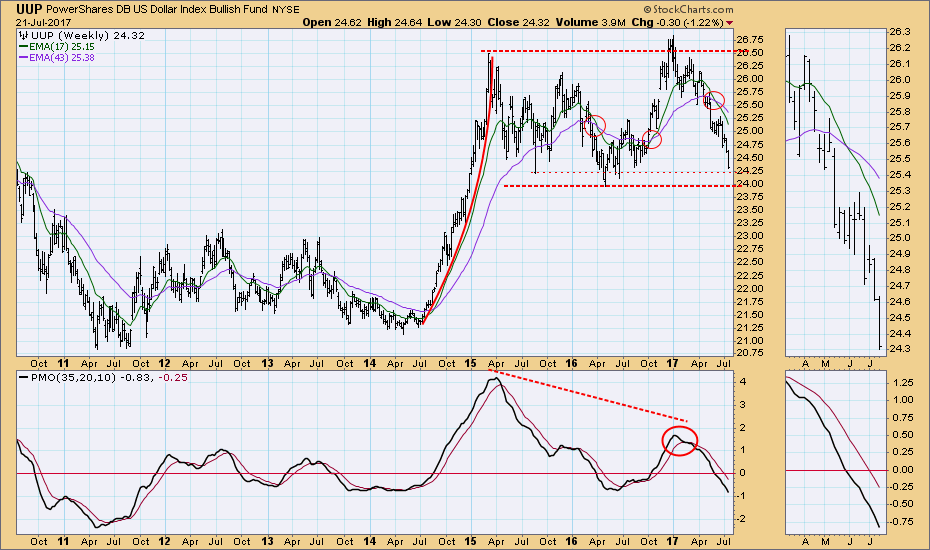
The weekly chart shows that price has reached a zone of support, but so far there is no indication that it is getting ready to form a bottom.
GOLD
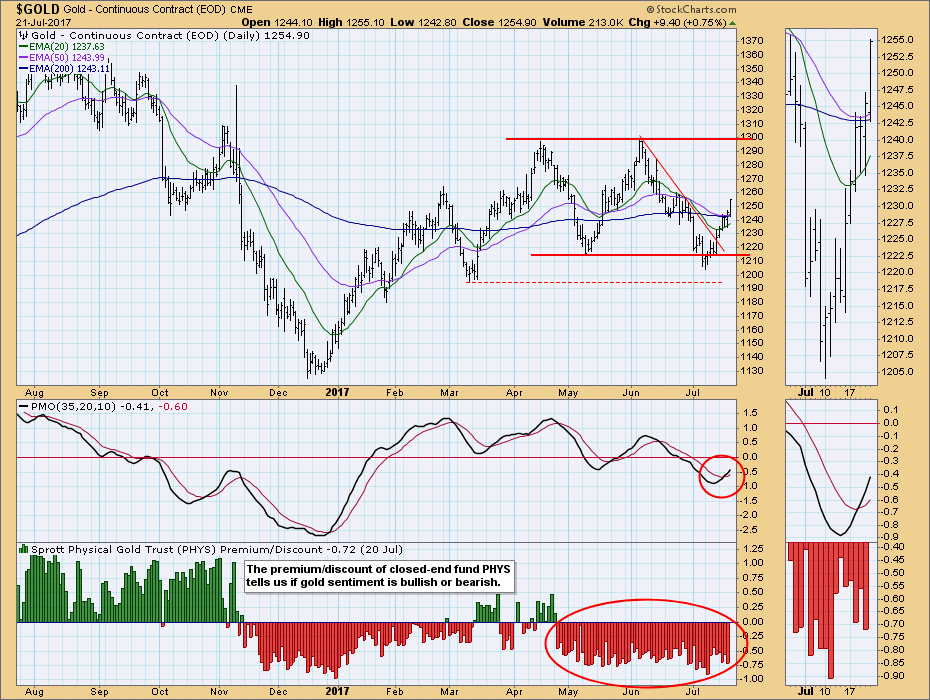
IT Trend Model: NEUTRAL as of 6/29/2017
LT Trend Model: BUY as of 4/12/2017
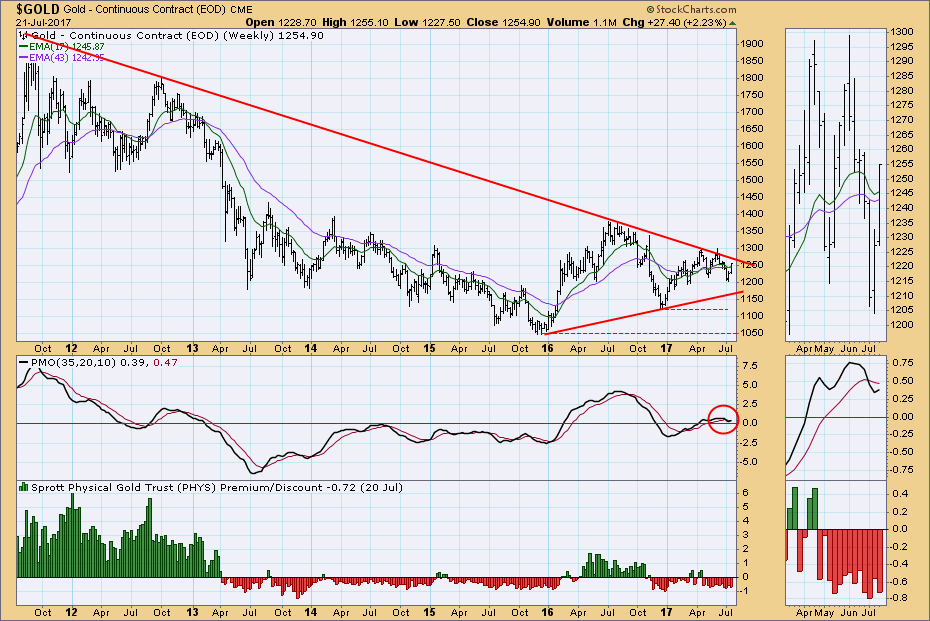
Gold is about midway the three-month trading range. Gold is also back above the EMAs, which is important because there will be no downside crossovers as long as price remains above them. The persistent sideways price movement causes the EMAs to flatten and converge, a configuration that increases the likelihood of whipsaw signal changes. Until gold departs the trading range, we need to be skeptical of any new signals that are generated.
Sentiment for gold, as expressed by the persistent discount of shares of the closed-end Sprott Physical Gold Fund (PHYS), remains bearish.
On the weekly chart Gold is approaching the long-term declining tops line yet again, and the weekly PMO has turned back up. In 2017 gold has remained in the top half of the triangle formation shown on the chart, which I interpret as a sign that an upside breakout is likely.
CRUDE OIL (USO)
IT Trend Model: NEUTRAL as of 3/8/2017
LT Trend Model: SELL as of 3/9/2017
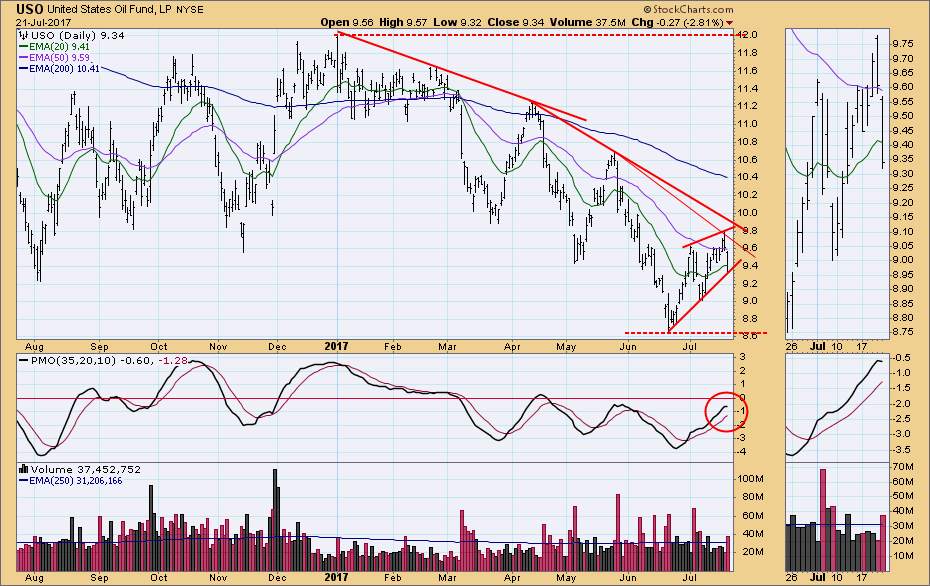
The rising trend line drawn from the June low is about to be tested. Note that the line drawn across the two July tops has formed the top of a rising wedge, which, as we know, is most likely to resolve downward. This in turn would place the support at the June low in jeopardy.
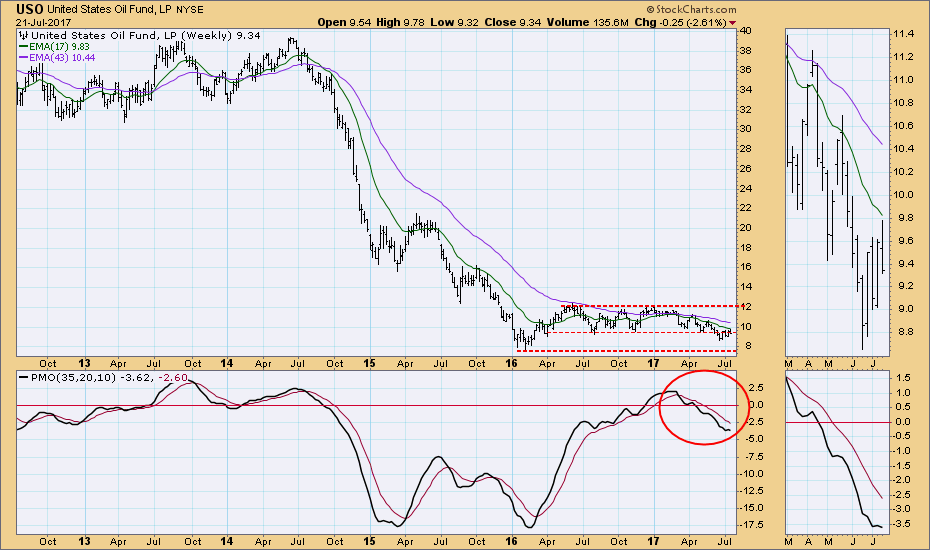
The weekly chart reveals that USO is chopping around on a line of support that is about a year old. The weekly PMO has turned down again, and it seems likely that price will continue down to the long-term support just below 8.00.
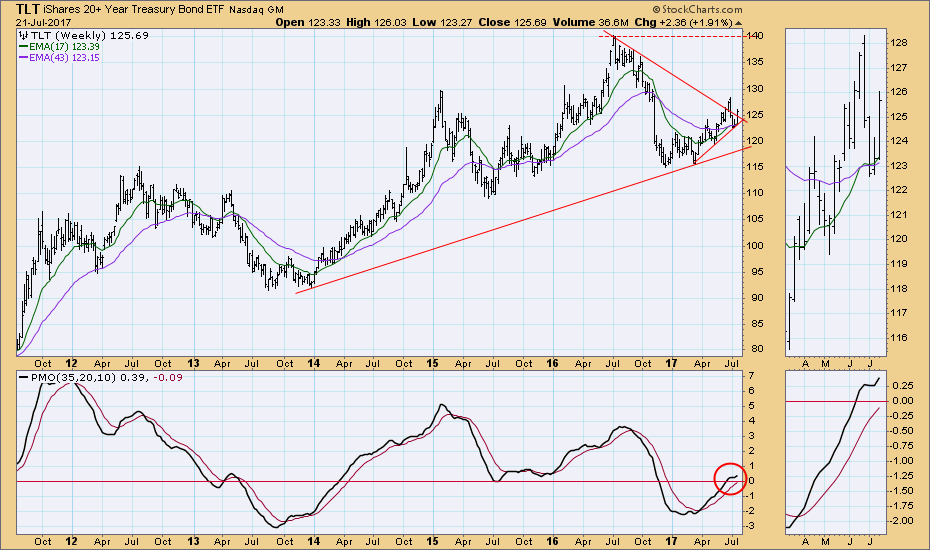
BONDS (TLT)
IT Trend Model: BUY as of 3/31/2017
LT Trend Model: BUY as of 6/16/2017
Last week price was squeezed into the apex of a triangle formation. This week price broke above the declining tops line once again, and the rising trend originating at the March low remains intact. The daily PMO has also turned up, and it will likely cross up through its signal line early next week.
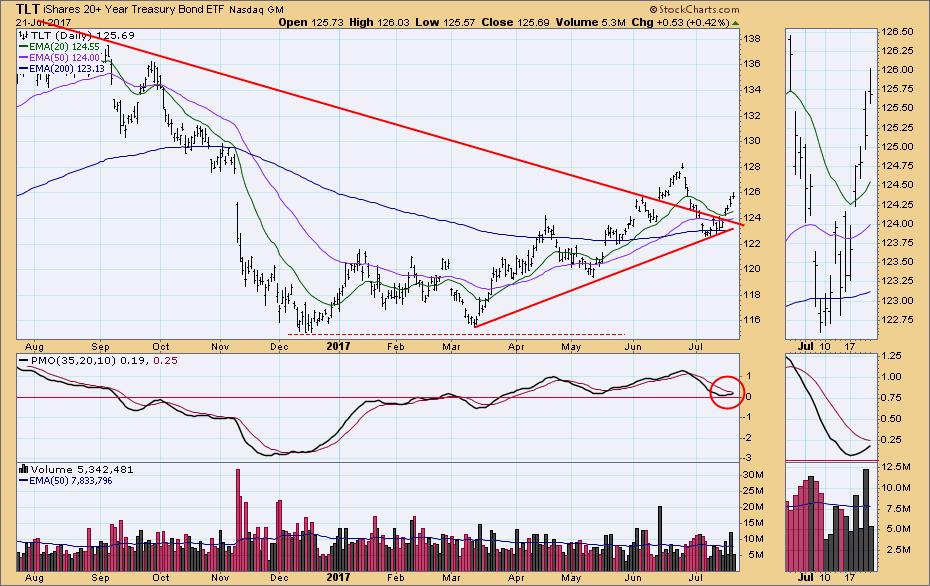
A bounce last week turned the weekly PMO up just slightly, putting a bullish shine on the picture. This week the weekly PMO is clearly rising, confirming the rising price trend.
**Don't miss the DecisionPoint Alert Daily Commentary! Go to the "Notify Me" box toward the end of this blog page to be notified as soon as it is published at the end of the market day.**
Technical Analysis is a windsock, not a crystal ball.
Happy Charting!
- Carl
NOTE: The signal status reported herein is based upon mechanical trading model signals, specifically, the DecisionPoint Trend Model. They define the implied bias of the price index based upon moving average relationships, but they do not necessarily call for a specific action. They are information flags that should prompt chart review. Further, they do not call for continuous buying or selling during the life of the signal. For example, a BUY signal will probably (but not necessarily) return the best results if action is taken soon after the signal is generated. Additional opportunities for buying may be found as price zigzags higher, but the trader must look for optimum entry points. Conversely, exit points to preserve gains (or minimize losses) may be evident before the model mechanically closes the signal.
Helpful DecisionPoint Links:
DecisionPoint Shared ChartList and DecisionPoint Chart Gallery
Price Momentum Oscillator (PMO)
Swenlin Trading Oscillators (STO-B and STO-V)
