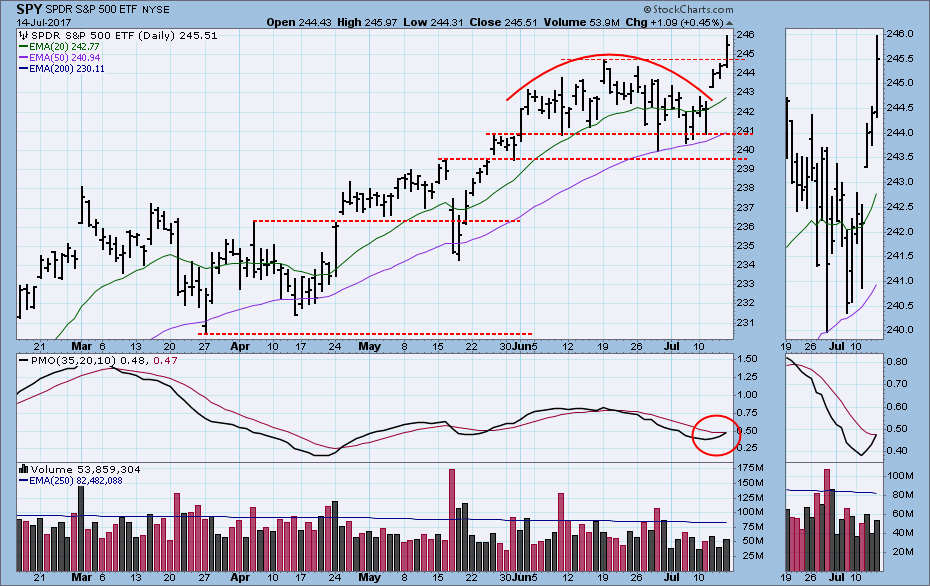
Rounded top, schmounded top. This week the market couldn't have cared less as it broke through to new, all-time highs. The headline regarding the dollar is not exactly news, but the dollar is getting particularly weak. More on that below.
The DecisionPoint Weekly Wrap presents an end-of-week assessment of the trend and condition of the stock market (S&P 500), the U.S. Dollar, Gold, Crude Oil, and Bonds.
STOCKS
IT Trend Model: BUY as of 11/15/2016
LT Trend Model: BUY as of 4/1/2016
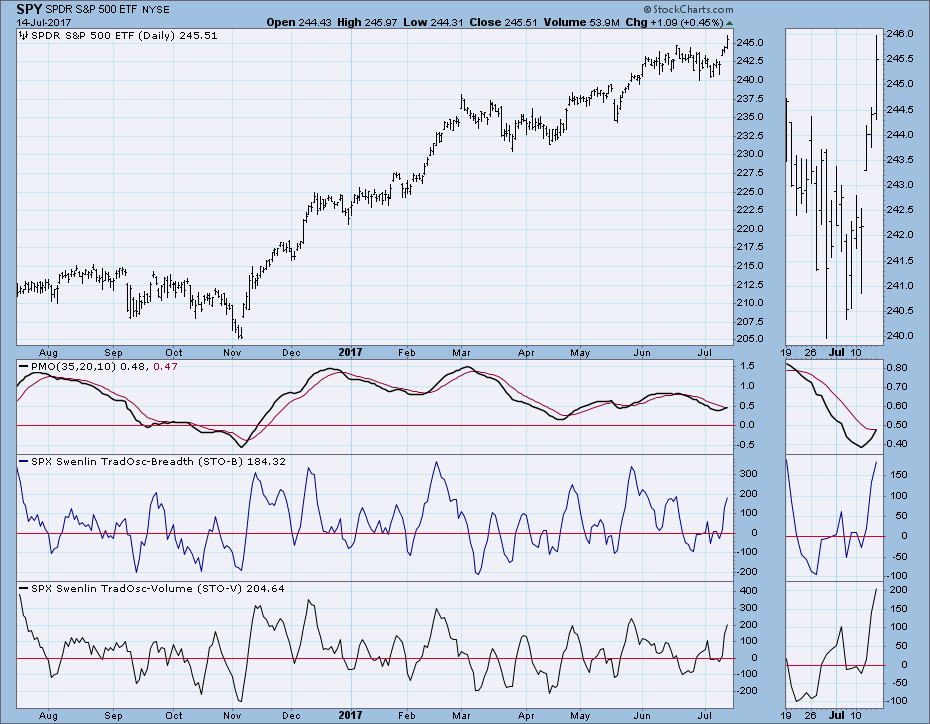
While my focus has been on the cyclical bull market rising trend line drawn from the February 2016 low, there is clearly a shorter-term trend line that has dominated price action for all of 2017. It was from that line that this week's rally was launched. Then on Friday the PMO crossed up through the signal line, generating a PMO BUY signal. I thought that volume was really lousy for a break to new highs -- Friday's $SPX volume was only 73% of the 250EMA of volume -- but I've been unimpressed by volume for months. It hasn't stopped the price advance, though.
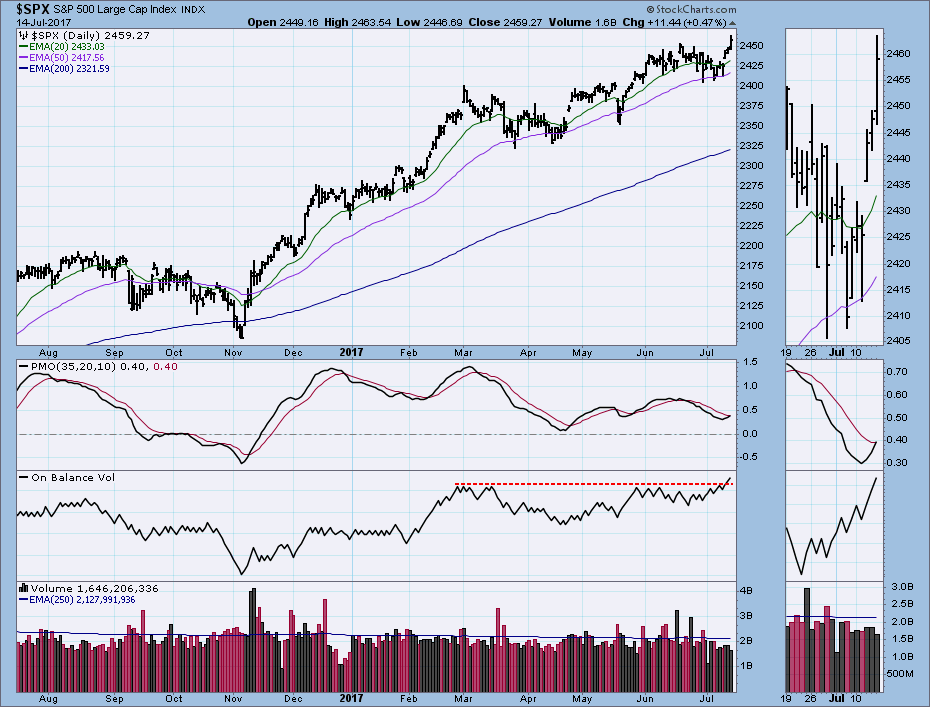
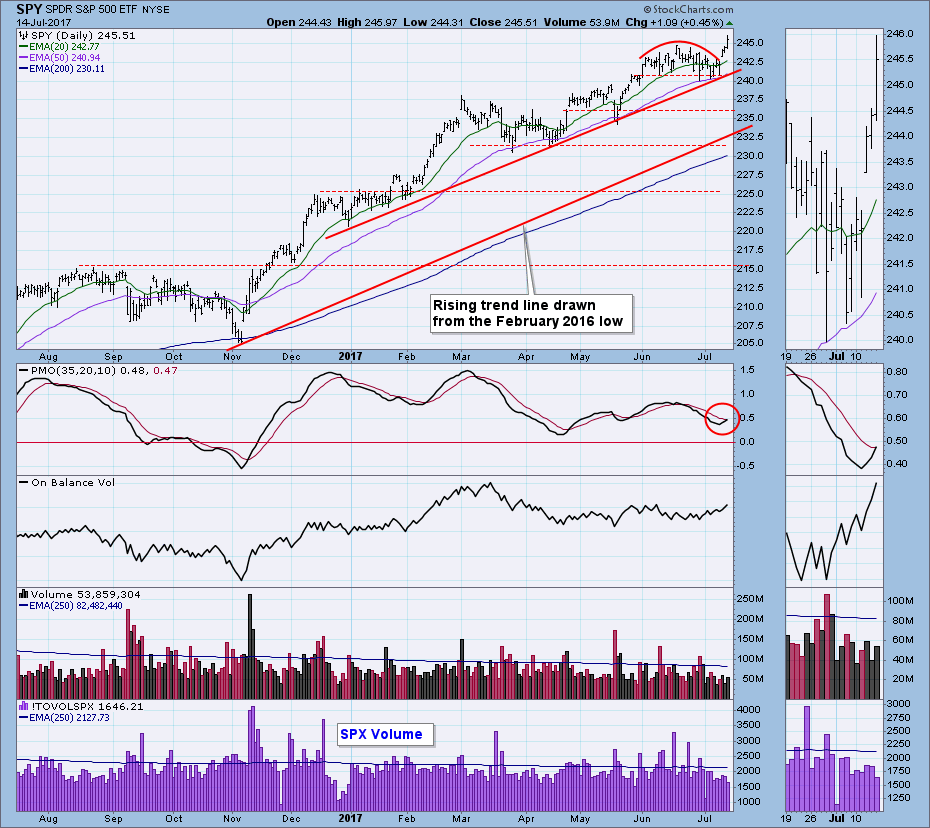 One of the issues that concerned me was the fact that the OBV for SPY wasn't confirming the new price highs, but the following chart of $SPX shows that the index volume did indeed confirm the new price highs.
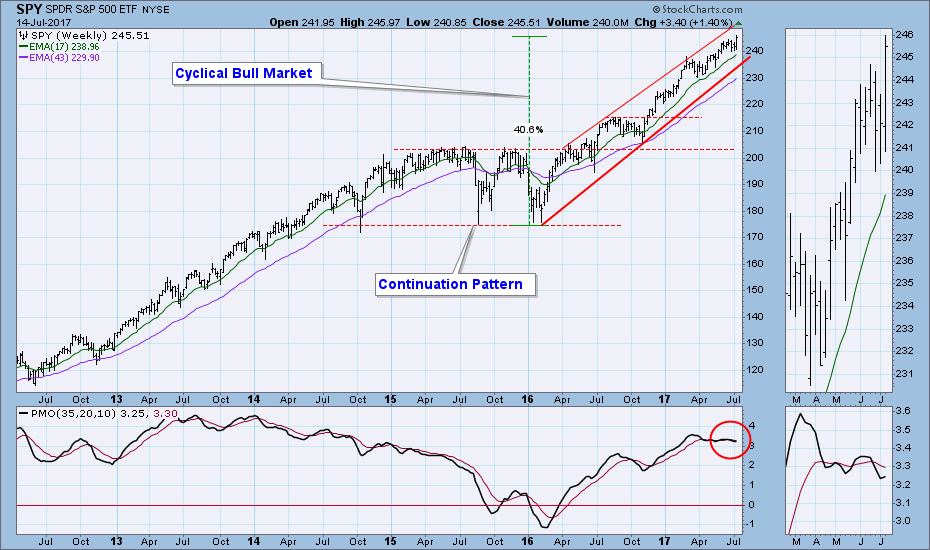
On the weekly chart the market has remained in the top half of the rising trend channel for about eight months. The weekly PMO has been moving sideways at a high level for several months. This reflects a steady, positive rate of change in this time frame.
Short-Term Market Indicators: These indicators are getting somewhat overbought, but there is still plenty of upside movement possible.
Intermediate-Term Market Indicators: All these indicators have bottomed and crossed up through their signal lines. The bottoms are far enough down on the scale to allow for a satisfactory period of positive movement before they become overbought, but they were hardly what we would call oversold when they bottomed.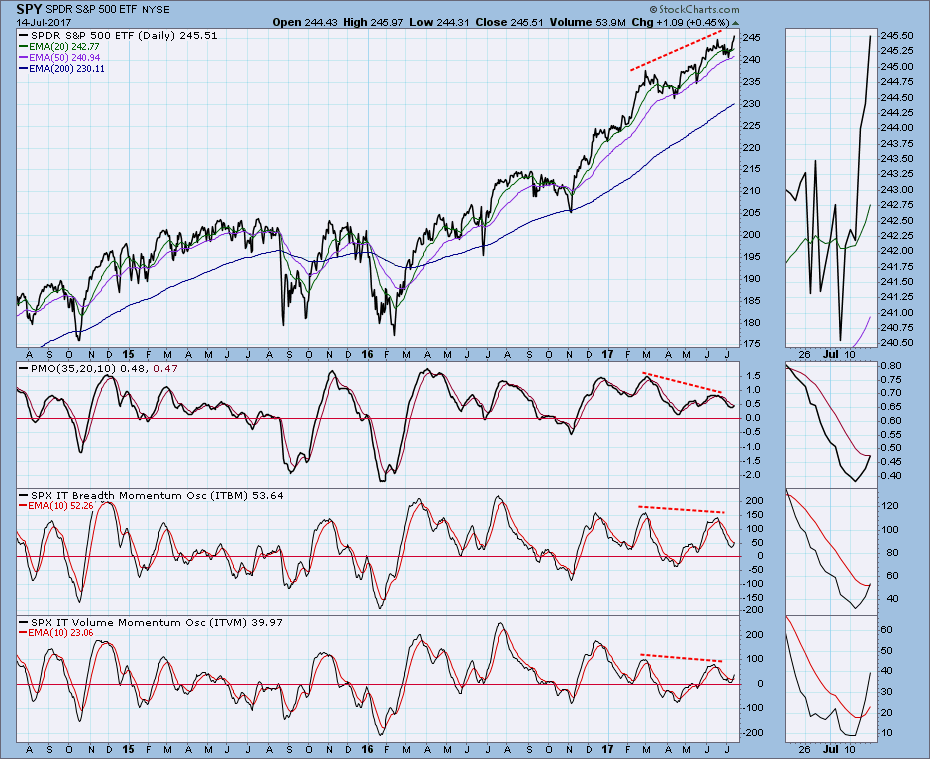
Conclusion: I really thought that we were going to see a little bit of downside this week. I mean, just a little bit, right? But no. This market is stronger than ever, and it just won't give anything back. The chart just above shows a negative divergence on every indicator, but so far it hasn't mattered. To quote Jared Dillan's The 10th Man newsletter, "Bull market, dude."
DOLLAR
IT Trend Model: NEUTRAL as of 3/21/2016
LT Trend Model: SELL as of 5/24/2017
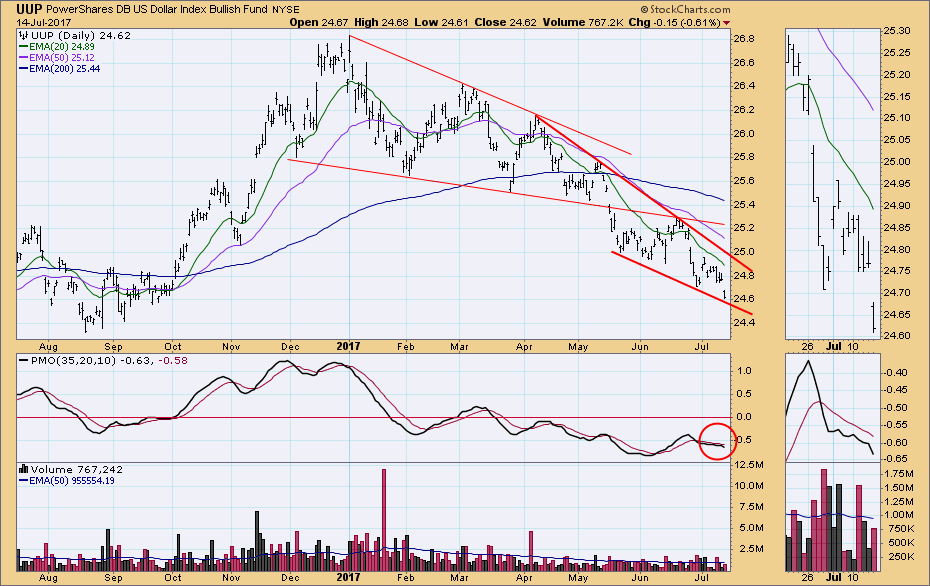
UUP appears to be in trouble as it moves within a descending wedge formation. This is normally considered to be a bullish pattern, with expectations of an upside breakout. However, note that the price bounce off the June low failed to reach the top of the wedge, and price is now below that prior low and approaching the bottom of the wedge. The implication is that the wedge will resolve bearishly, and that the price decline will accelerate.
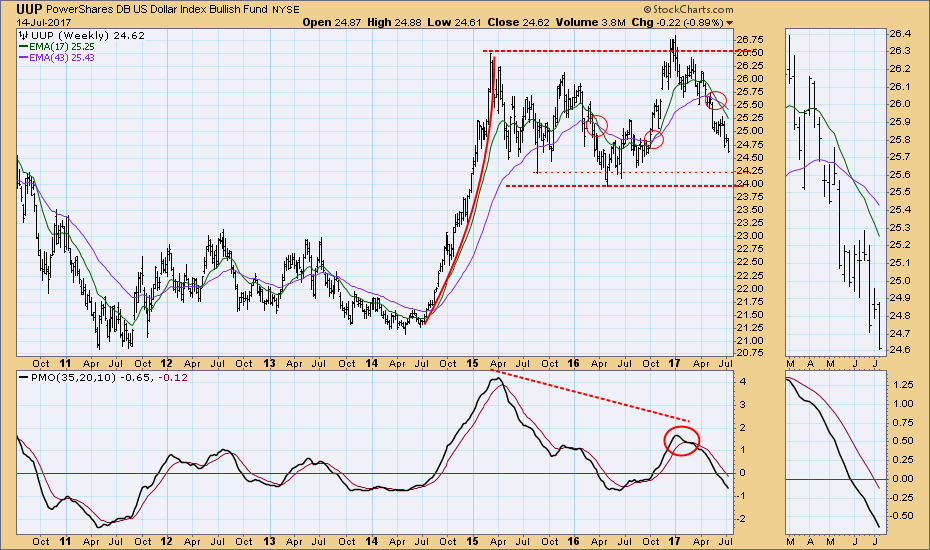
The UUP weekly PMO has reached a level that has proven to be oversold for about the last five years, and price is approaching support near the bottom of the two-year trading range. There is still room for the selling promised by the daily chart above, but it could easily abate at the obvious support.
GOLD
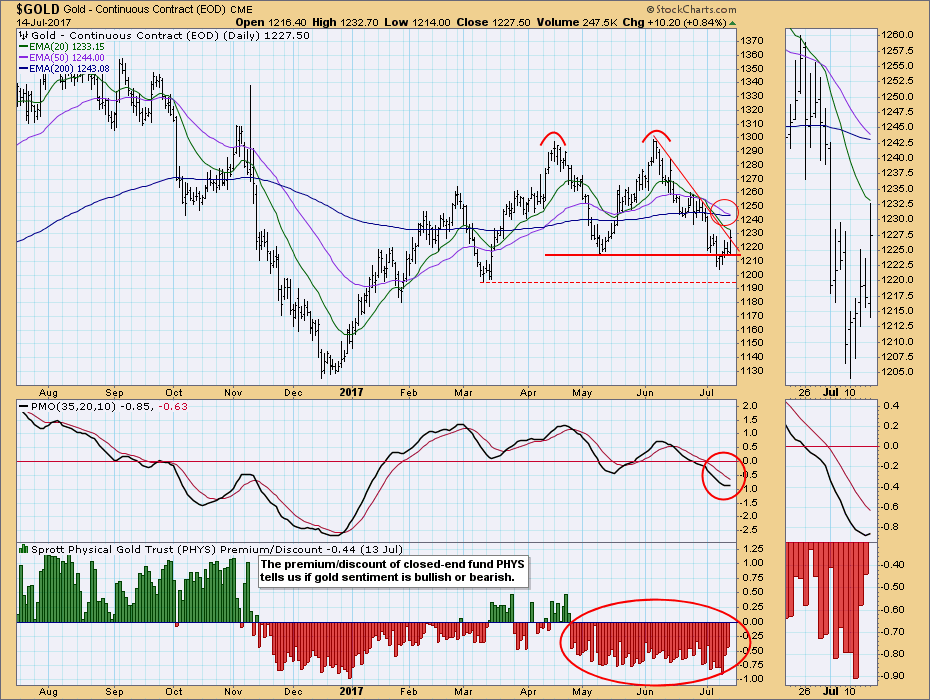
IT Trend Model: NEUTRAL as of 6/29/2017
LT Trend Model: BUY as of 4/12/2017
Last week gold broke down through the double top confirmation line, implying that the price decline would continue. This week gold broke back above that line and also challenged the short-term declining tops line drawn from the June top. Perhaps gold will start to benefit from the dollar's weakness. The 50EMA is about to cross down through the 200EMA, but the EMAs are in a narrow range, and I wouldn't take a 50/200EMA crossover as seriously as, for example, the crossover that occurred back in November.
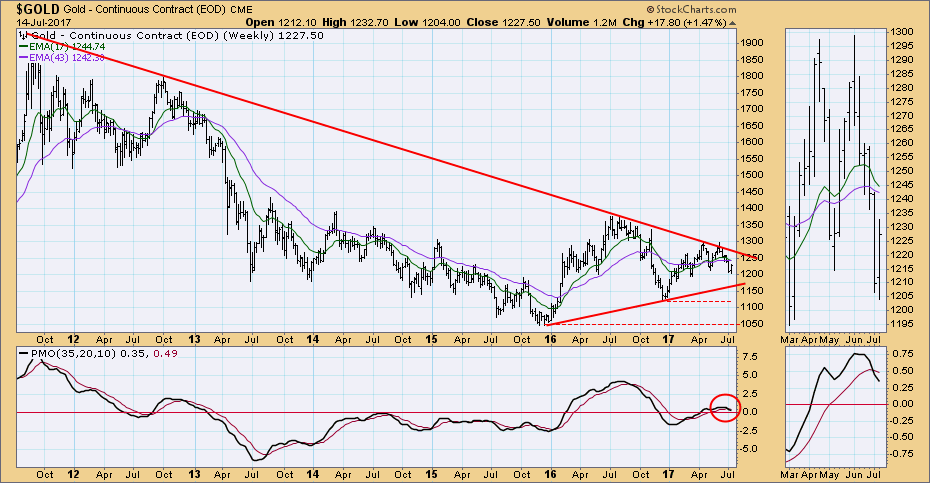
The triangle formation on the weekly chart is unresolved. The weekly PMO is falling below its signal line, and the 17EMA is close to crossing down through the 43EMA. These issues are negative, but they are the result of whipsaw caused by the sideways price movement.
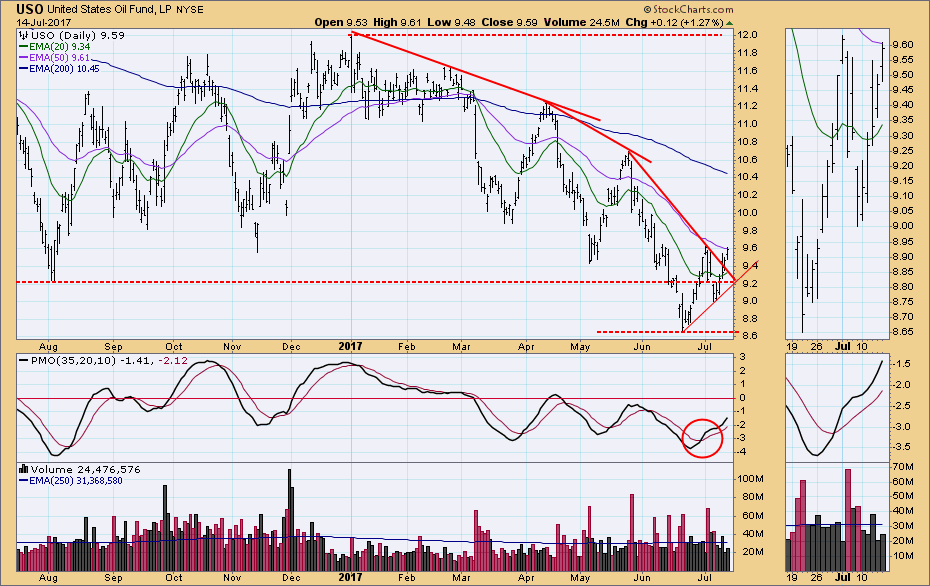
CRUDE OIL (USO)
IT Trend Model: NEUTRAL as of 3/8/2017
LT Trend Model: SELL as of 3/9/2017
USO has broken above the steepest declining tops line. There is a bottom above a bottom, and, if price can move above the July 3 top, a new short-term rising trend will have been established. The daily PMO has a way to go before it reaches the level of the two prior tops. Once there, it will be overbought based upon the recent range.
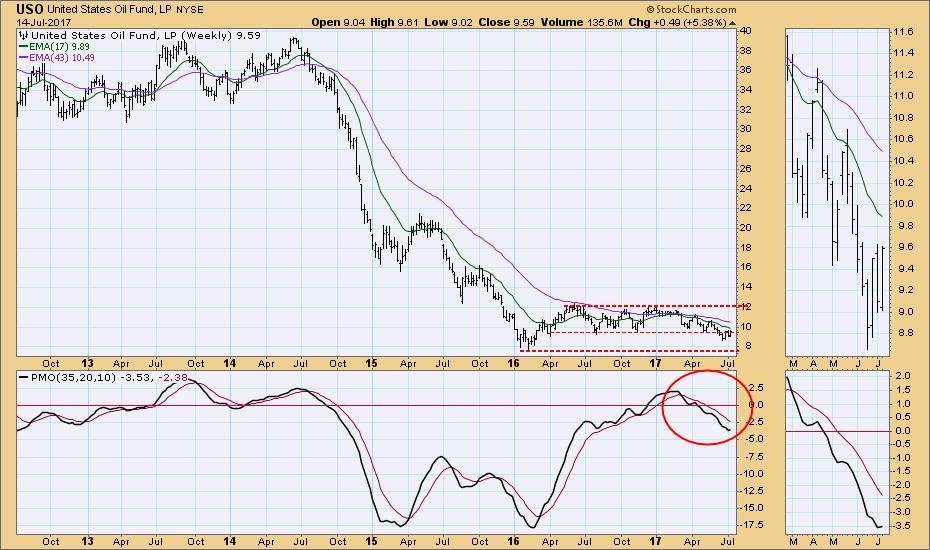
The weekly PMO has bottomed, but so far it is shallow like the bottoms in March and May -- more follow-through is needed.
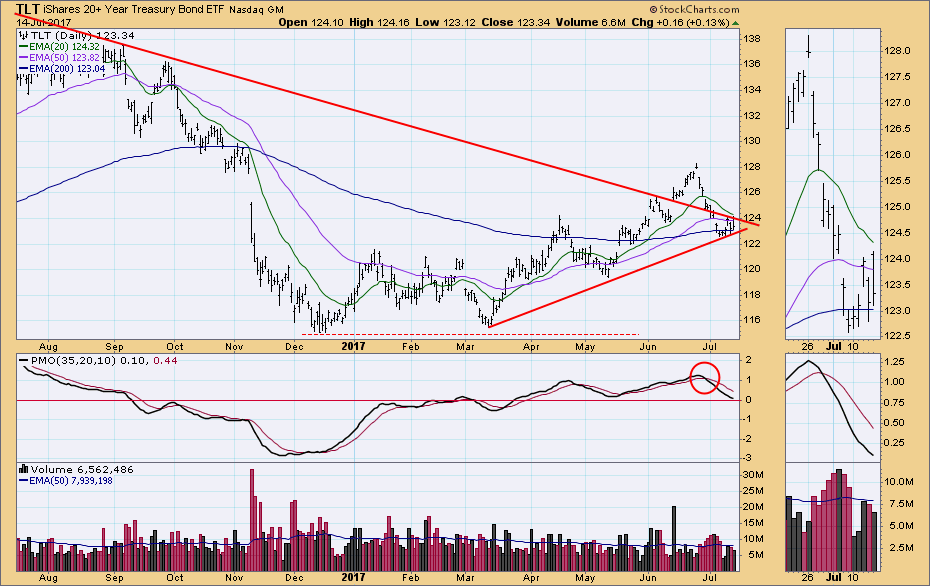
BONDS (TLT)
IT Trend Model: BUY as of 3/31/2017
LT Trend Model: BUY as of 6/16/2017
TLT is caught in the apex of a triangle formed by the long-term declining tops line and the recent rising trend line drawn from the March low. The daily PMO is at the same level as its March bottom, which could be considered oversold in a bull market. If the PMO bottoms, I would consider that a solid short-term BUY signal. But, of course, no guarantees.
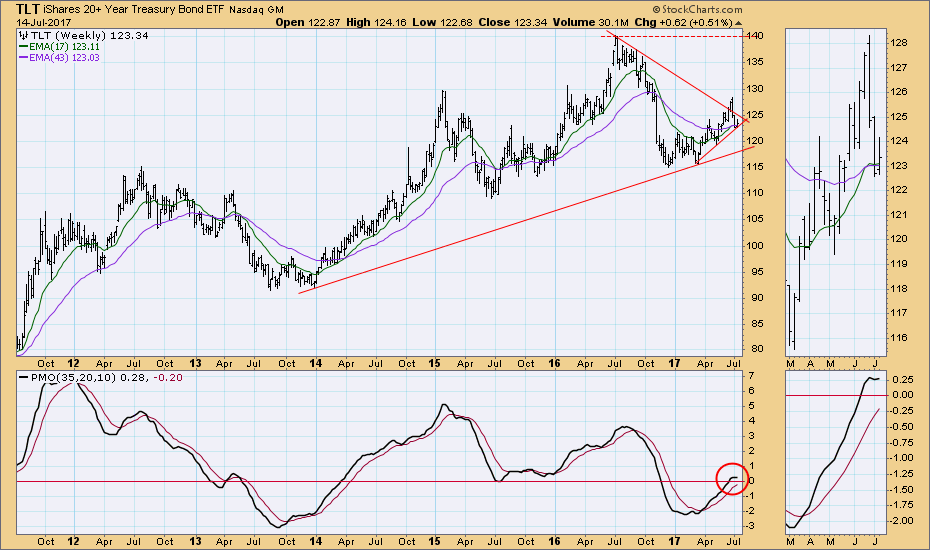
The TLT weekly PMO, which had topped last week, turned up again, and the 17EMA crossed up through the 43EMA. These are both bullish signs, but clearly not yet decisive in this case.
**Don't miss the DecisionPoint Alert Daily Commentary! Go to the "Notify Me" box toward the end of this blog page to be notified as soon as it is published at the end of the market day.**
Technical Analysis is a windsock, not a crystal ball.
Happy Charting!
- Carl
NOTE: The signal status reported herein is based upon mechanical trading model signals, specifically, the DecisionPoint Trend Model. They define the implied bias of the price index based upon moving average relationships, but they do not necessarily call for a specific action. They are information flags that should prompt chart review. Further, they do not call for continuous buying or selling during the life of the signal. For example, a BUY signal will probably (but not necessarily) return the best results if action is taken soon after the signal is generated. Additional opportunities for buying may be found as price zigzags higher, but the trader must look for optimum entry points. Conversely, exit points to preserve gains (or minimize losses) may be evident before the model mechanically closes the signal.
Helpful DecisionPoint Links:
DecisionPoint Shared ChartList and DecisionPoint Chart Gallery
Price Momentum Oscillator (PMO)
Swenlin Trading Oscillators (STO-B and STO-V)
