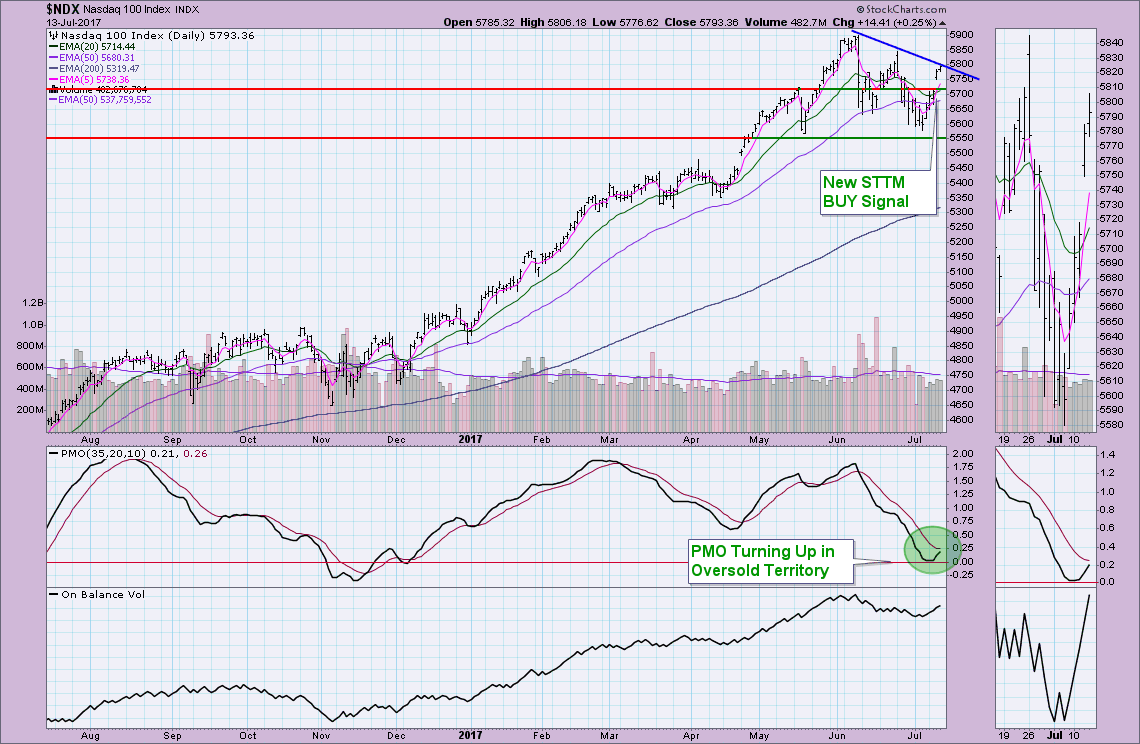
 No changes on the DecisionPoint Scoreboards. They all look the same which might be a little confusing given the bifurcated market we have witnessed over the past few weeks. While most indexes are testing all-time highs, the NDX needs more help and today it couldn't get past the declining tops line.
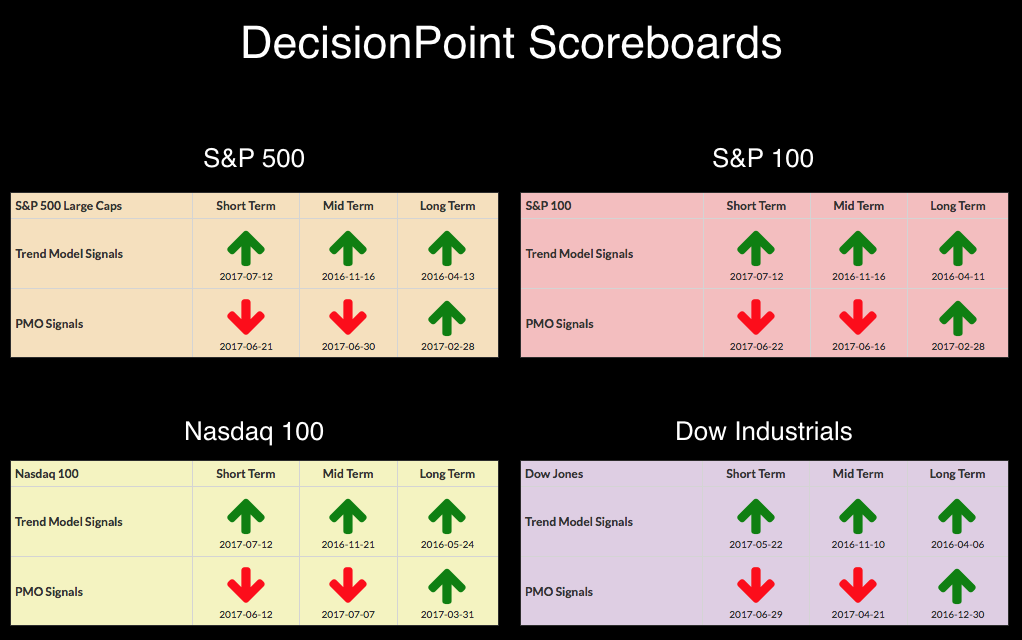
The purpose of the DecisionPoint Alert Daily Update is to quickly review the day's action, internal condition, and Trend Model status of the broad market (S&P 500), the nine SPDR Sectors, the U.S. Dollar, Gold, Crude Oil, and Bonds. To ensure that using this daily reference will be quick and painless, we are as brief as possible, and sometimes we let a chart speak for itself.
SIGNALS: Here we include charts of any important signal changes triggered today by our Intermediate-Term Trend Model.
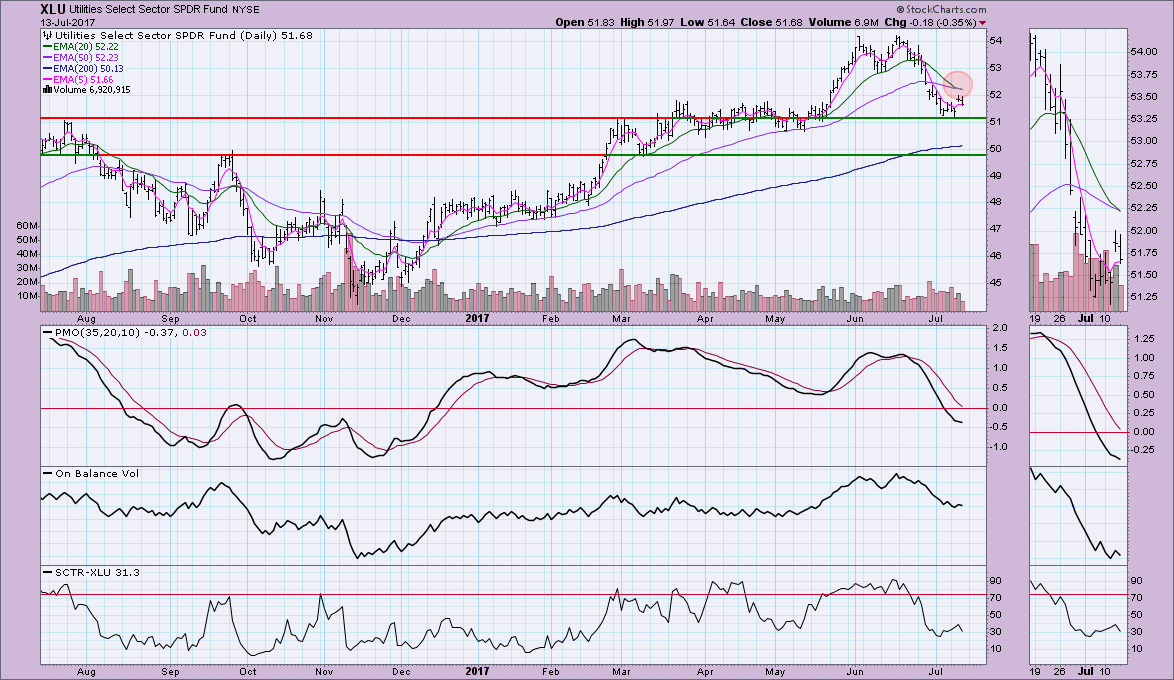
NEW ITTM Neutral Signal for XLU:
It's interesting, I think this chart may be getting bullish despite the new Intermediate-Term Trend Model Neutral signal. The signal is generated when the 20-EMA crosses below the 50-EMA. It is a Neutral signal and not a SELL signal because the crossover occurred ABOVE the 200-EMA. Price has bounced nicely off support and appears ready to challenge resistance at the June bottom around $53. However, with this new Neutral signal, I'm hesitant. The SCTR has moved lower and OBV is moving lower. The only bullish confirmation here would be the PMO deceleration.
NOTE: Mechanical trading model signals define the implied bias of the price index based upon moving average relationships, but they do not necessarily call for a specific action. They are information flags that should prompt chart review. Further, they do not call for continuous buying or selling during the life of the signal. For example, a BUY signal will probably return the best results if action is taken soon after the signal is generated. Additional opportunities for buying may be found as price zigzags higher, but the trader must look for optimum entry points. Conversely, exit points to preserve gains (or minimize losses) may be evident before the model mechanically closes the signal.
STOCKS
IT Trend Model: BUY as of 11/15/2016
LT Trend Model: BUY as of 4/1/2016
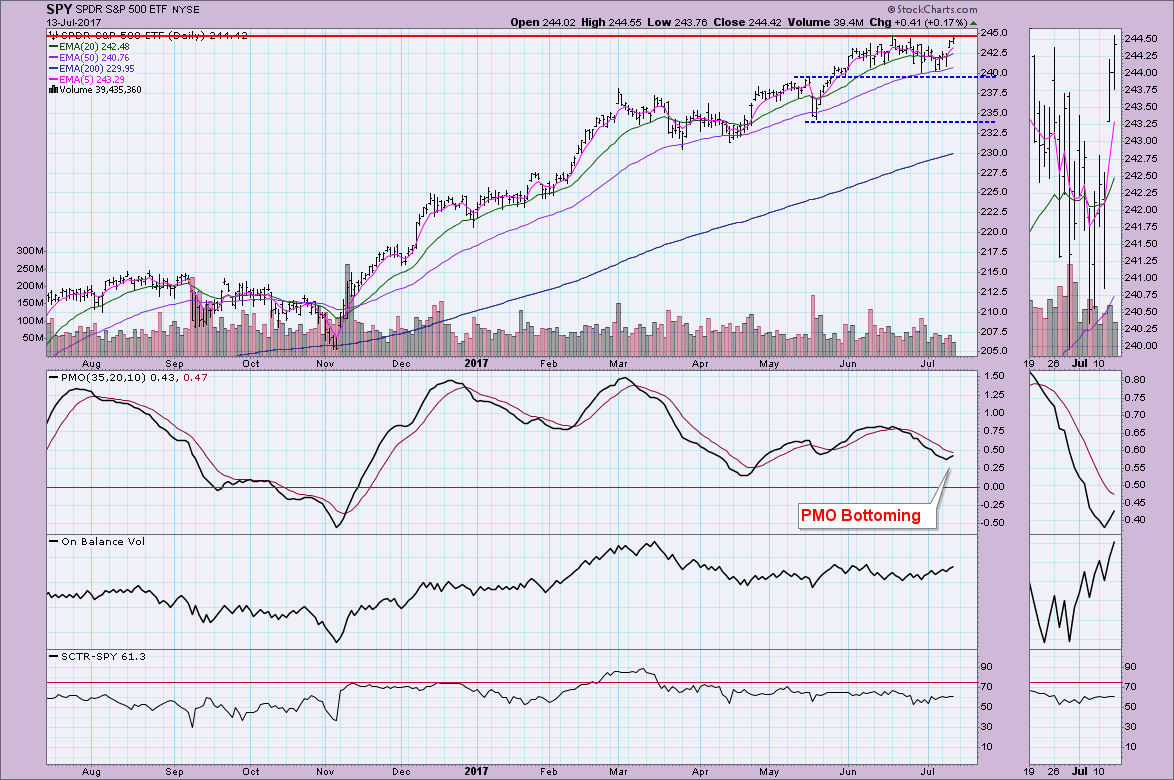
The market continued its slow rise higher today, flirting with all-time highs for the SPY. I'm a little concerned about the bearish rising wedge for the very short-term. Below in the section on ultra-short-term indicators, I'll discuss the VIX which also gives me pause.
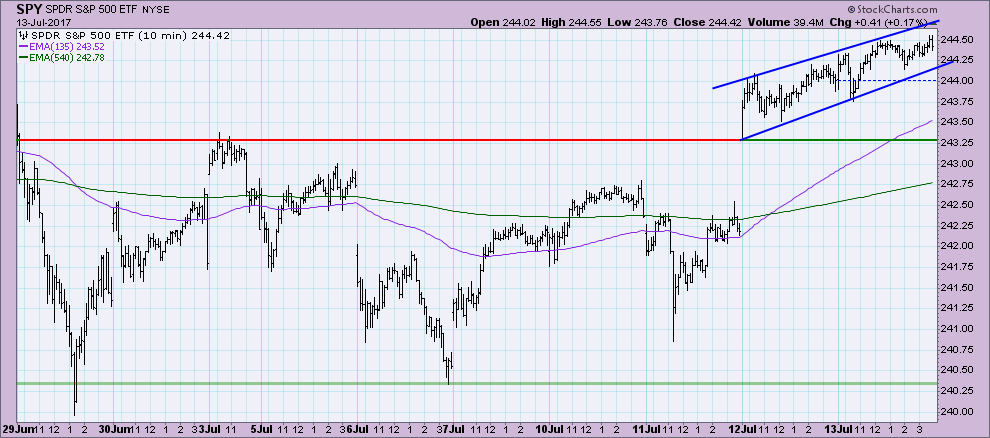
We're at the top of the trading range. The PMO has turned up and the OBV is rising nicely. I still have some trouble with the idea that we are going to continue to make new all-time highs this summer. Seasonally, as Tom Bowley will tell you, this isn't the best time for the market. But, I can't ignore the positive changes in our indicators, like the PMO nearing a BUY signal.
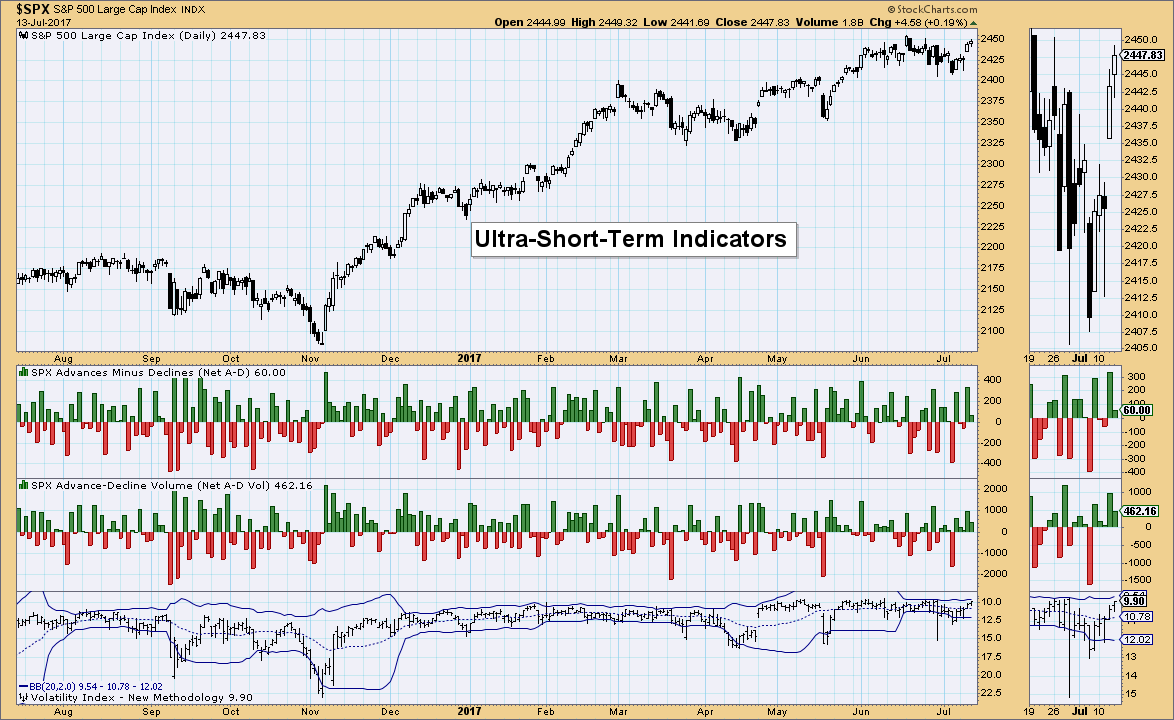
Ultra-Short-Term Indicators: The VIX readings are pushing against the upper Bollinger Band. If we see a penetration, that would be an overbought reading that would suggest a day or two of retreat by the market.
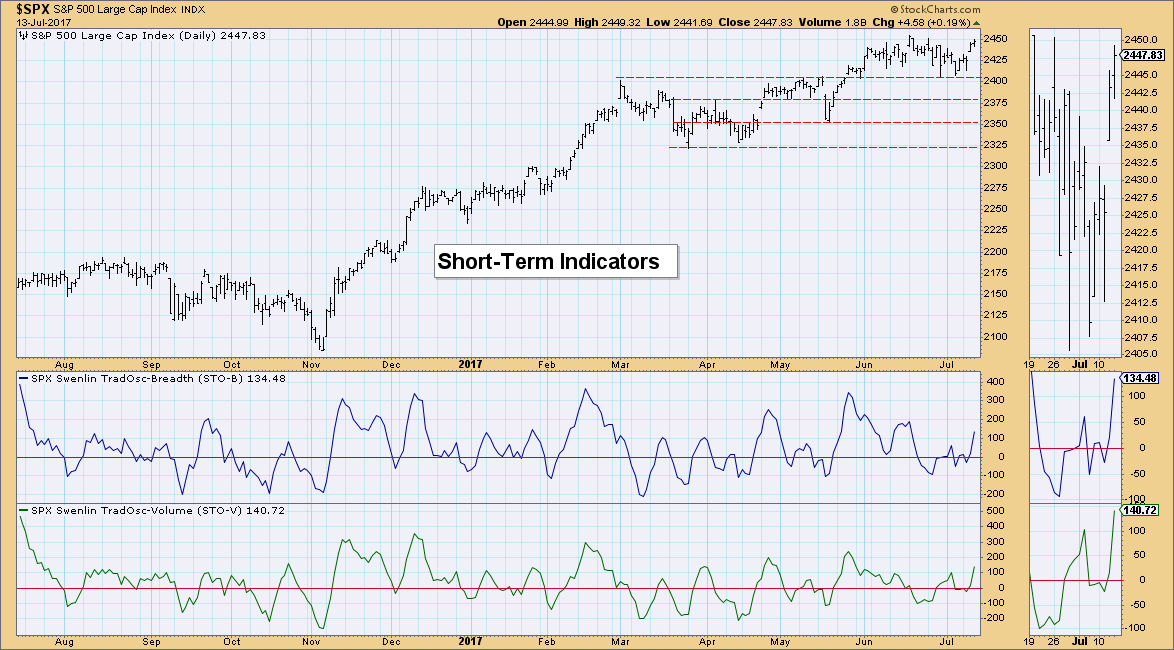
Short-Term Indicators: These indicators jumped nicely and are rising strongly. They are not really overbought and therefore have plenty of room to roam higher. These indicators suggest more upside.
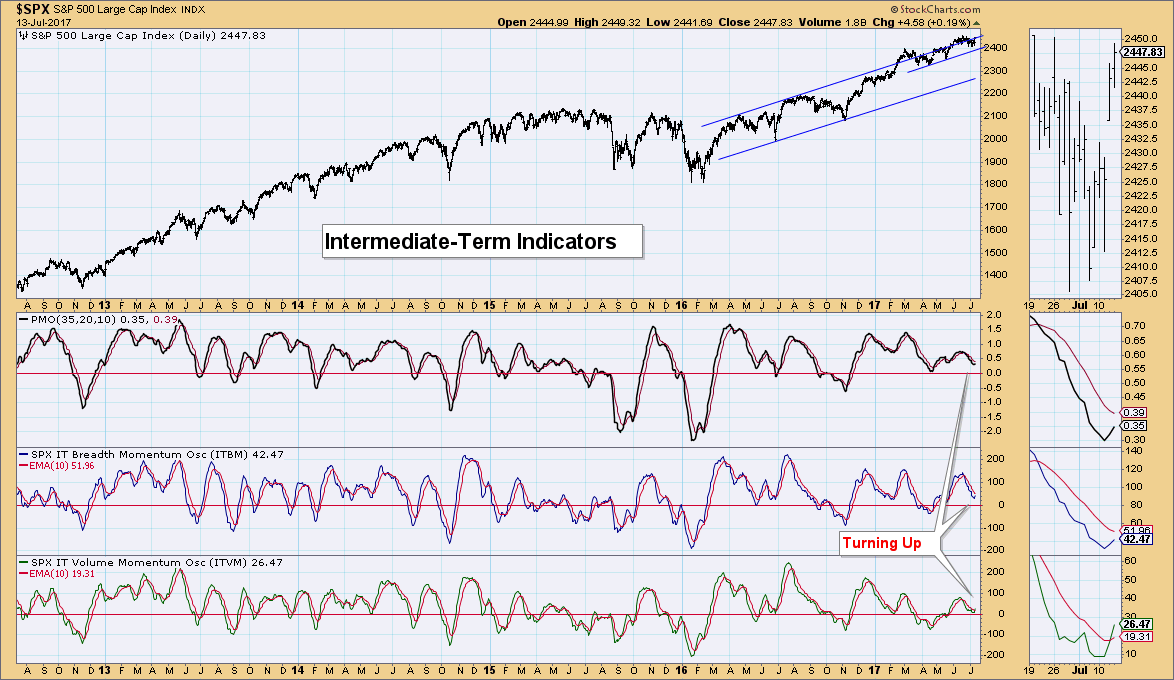
Intermediate-Term Indicators: I've been very concerned about these indicators, but we got a positive crossover by the ITVM. Now we wait and watch if the ITBM can follow suit. I don't want to get to bullish about these indicators, you can see previous times in the thumbnail where we were faked out. If I see a positive crossover by the ITBM, then I'll read these as bullish. Right now they have moved from very bearish to neutral.
Conclusion: The market has crushed many bears with its relentless rally with only consolidation to unwind indicators. Seasonally we should be looking for lower prices, but the indicators just aren't bearing that out (no pun intended). I'm not yet convinced that an intermediate-term pullback or correction is not going to happen, but it seems that consolidation or pauses like this one have provided plenty of support to springboard a new rally.
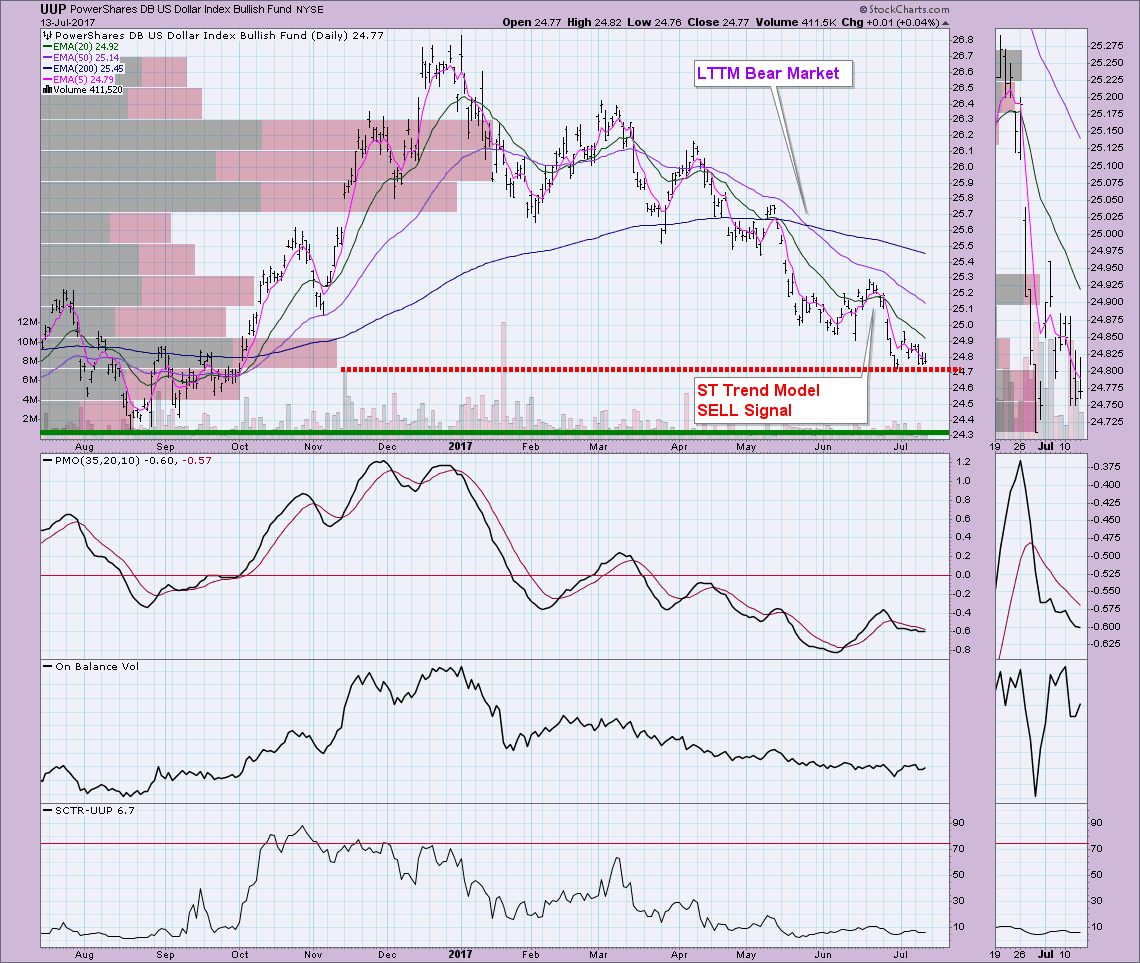
DOLLAR
IT Trend Model: NEUTRAL as of 3/21/2016
LT Trend Model: SELL as of 05/24/2017
I thought it was curious that UUP picked this level for support, but then I added the Volume by Price bars overlay and it was a bit more clear. The longer the volume bar, the more volume that has traded at that particular price level. The strongest support lies around $24.30, so this could be just a stopping point before UUP moves lower to test that support. The PMO has tried repeatedly to turn back up and score a BUY signal without success. It appears ready to try again. OBV and SCTR aren't telling us anything except UUP is internally and relatively weak.
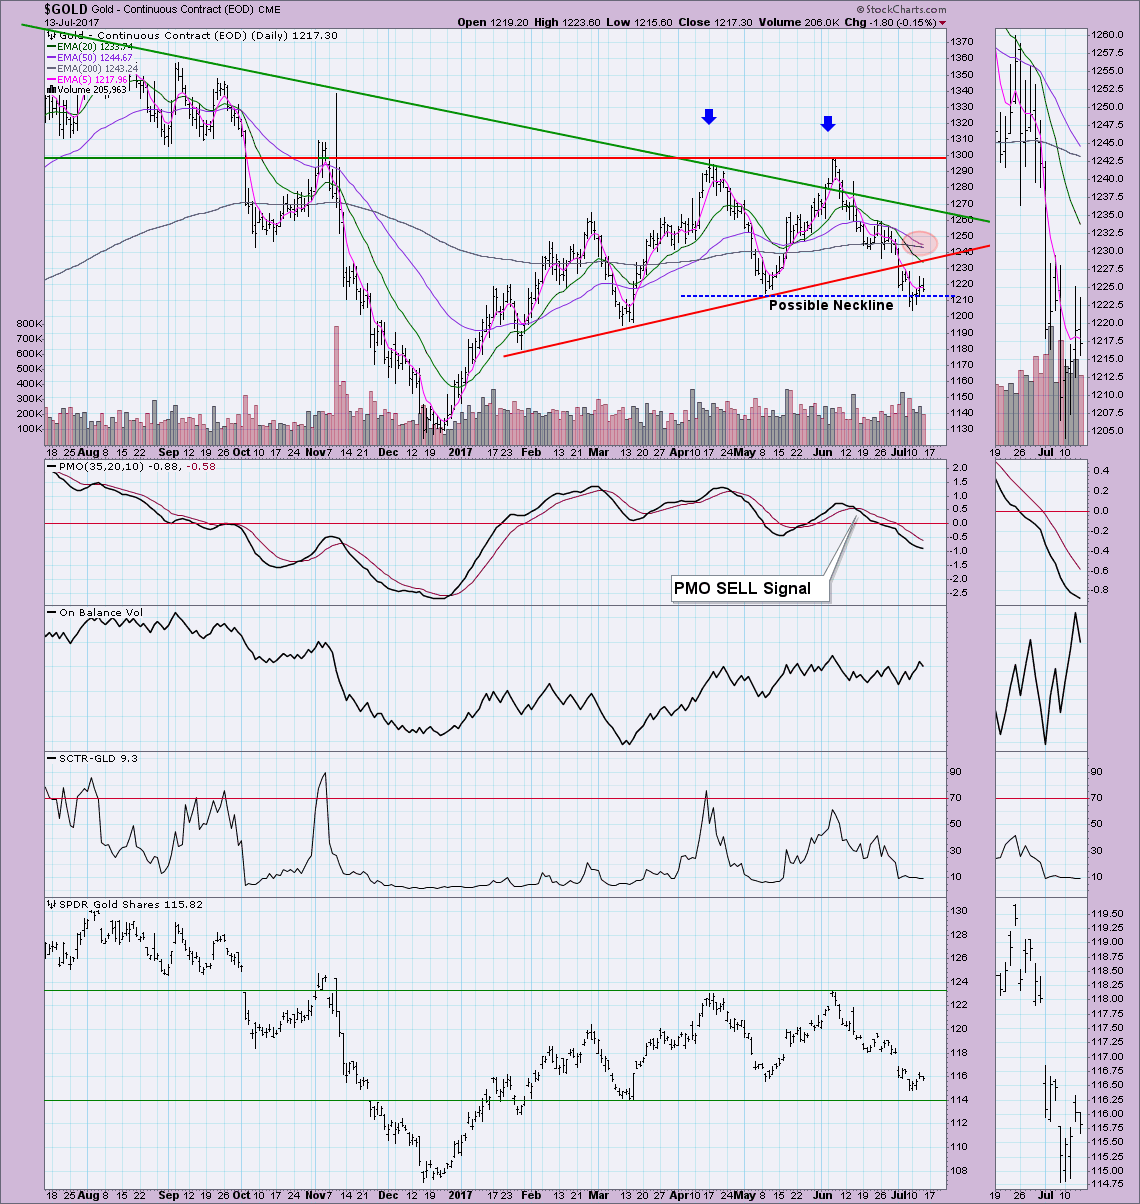
GOLD
IT Trend Model: Neutral as of 6/29/2017
LT Trend Model: BUY as of 4/12/2017
I like that Gold has found support at the double-top neckline, but I'm not "sold" on this latest bounce. The PMO is still declining and has put plenty of margin between itself and its signal line. The OBV bottoms are rising with price and I do like that the two major tops on the OBV in the thumbnail are rising while price was technically in a decline. If we see a breakout above the 20-EMA, I will scrap the bearish double-top.
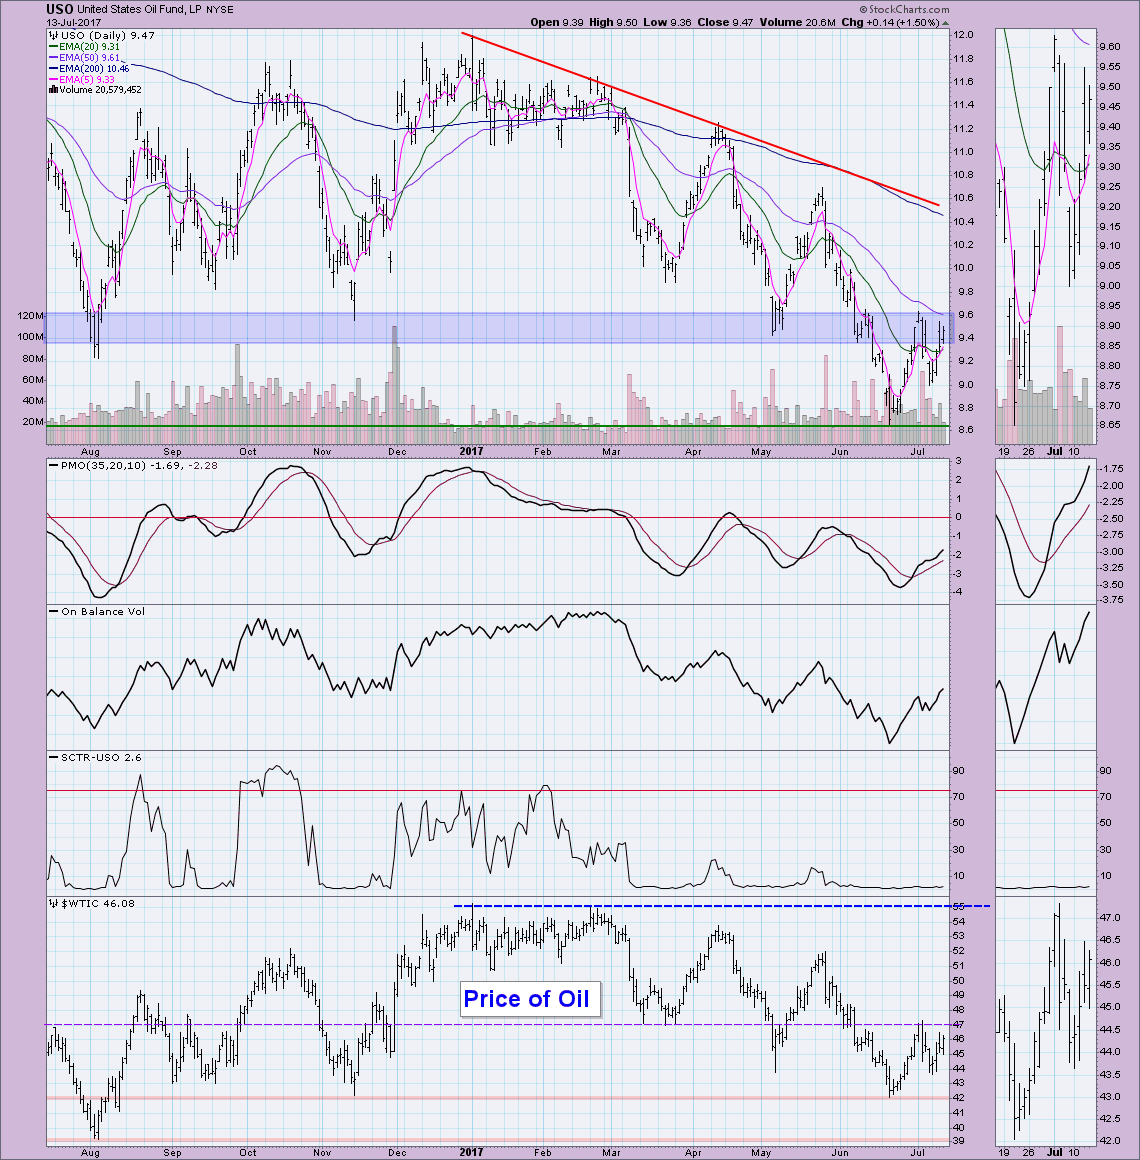
CRUDE OIL (USO)
IT Trend Model: NEUTRAL as of 3/8/2017
LT Trend Model: SELL as of 3/9/2017
USO has been choppy and truly a rough ride for anyone who owns it right now. USO has now hit a zone of support/resistance that has held well. Although the PMO is rising, the SCTR is in the basement. The main driver for USO of course is Oil. It has now found a new trading zone between $42 and $47. Both USO and Oil have hit overhead resistance, that held up last time. The PMO is bullish and the OBV is rising. If price is going to breakout, this is the time to do so with the indicators being so amenable.
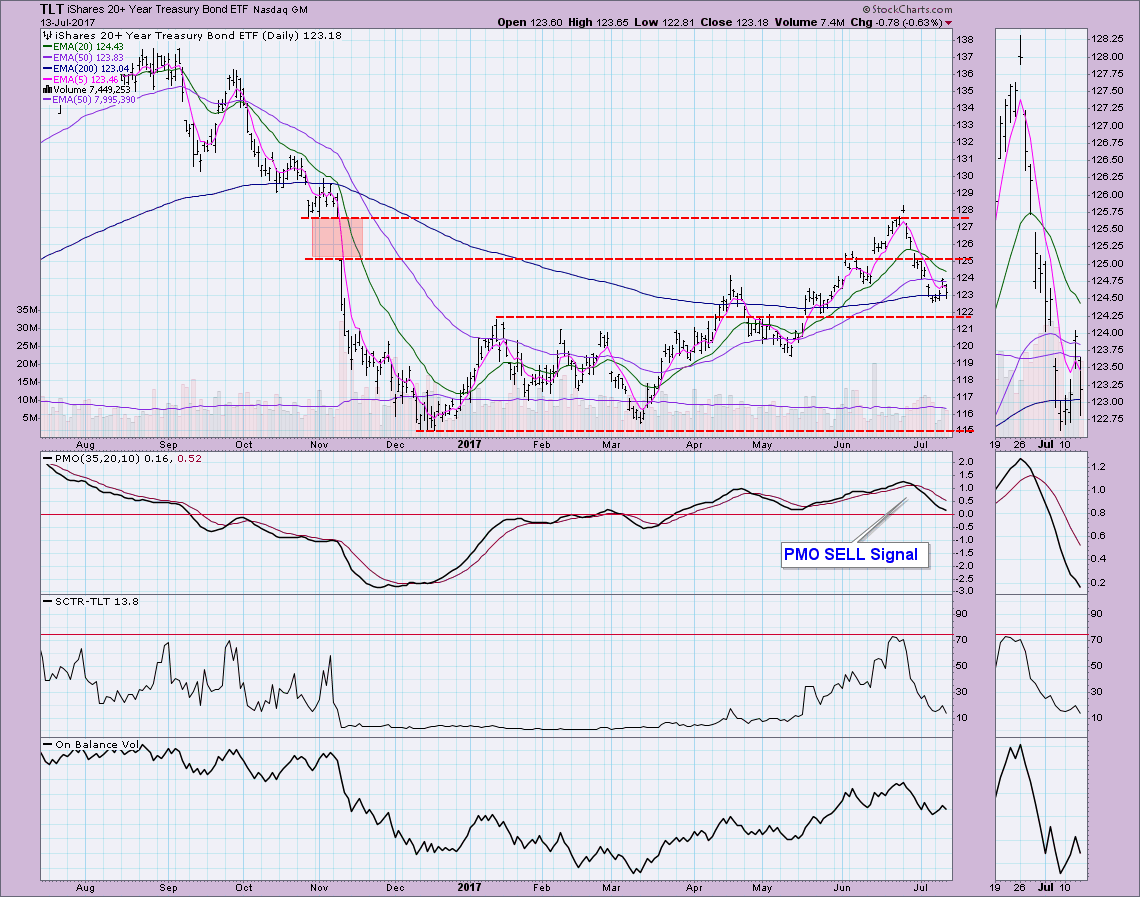
BONDS (TLT)
IT Trend Model: BUY as of 3/31/2017
LT Trend Model: BUY as of 6/16/2017
TLT has found support around $122.50, but I don't think that will hold. The PMO is on a SELL signal and dropping with little hesitation. The SCTR jumped out a second story window and the OBV is trending lower. TLT will likely fall further. I could see setting up a support line around $119, but the strongest area is at $115.
Helpful DecisionPoint Links:
DecisionPoint Shared ChartList and DecisionPoint Chart Gallery
Price Momentum Oscillator (PMO)
Swenlin Trading Oscillators (STO-B and STO-V)
Technical Analysis is a windsock, not a crystal ball.
Happy Charting!
- Erin
**Don't miss DecisionPoint Commentary! Add your email below to be notified of new updates"**
