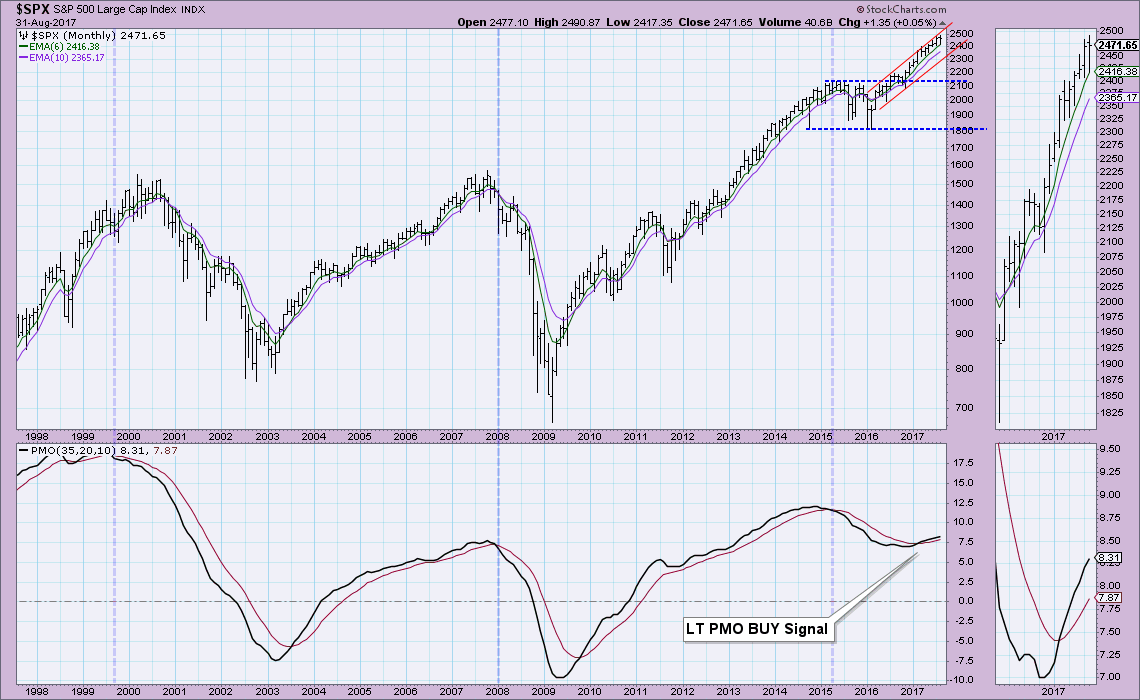
It's the last day of the month so all of our monthly charts have "gone final". First, here are the DecisionPoint Scoreboards currently (you can add these to your member dashboard!). You'll note two new Short-Term Trend Model (STTM) BUY signals arrived on the SPX and OEX. These signals are triggered when the 5-EMA crosses above the 20-EMA. You'll find those daily charts in the DecisionPoint Chart Gallery and for annotated charts, go to the DecisionPoint Shared ChartList (link at top of DecisionPoint Blog page). Momentum signals are bearish, but in all four indexes, the daily PMO is now rising toward a positive crossover. However, only the NDX shows a PMO bottom on the weekly chart; although the other three are decelerating their decline.
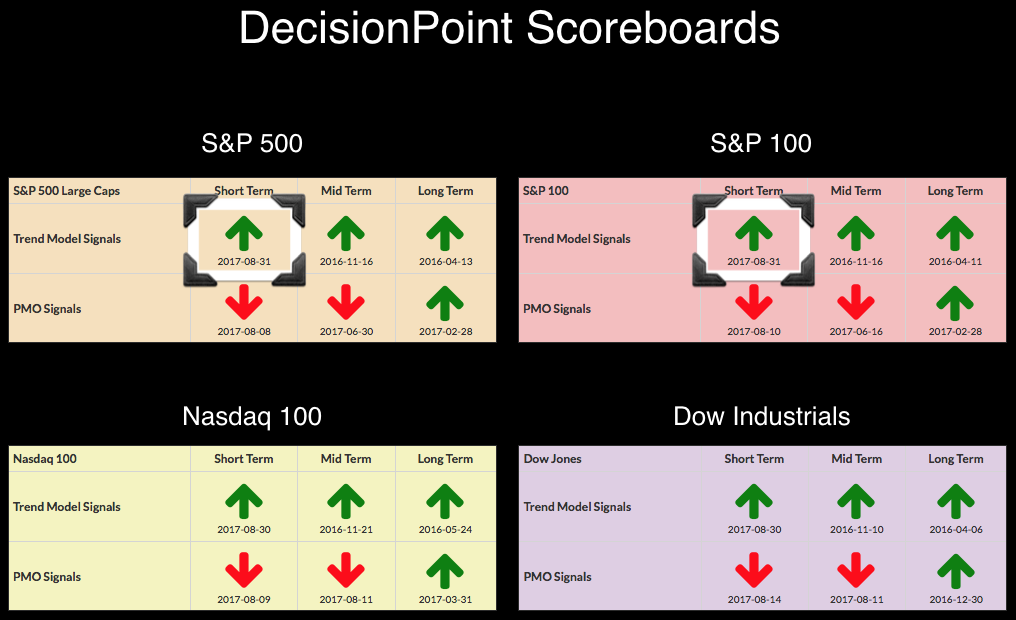
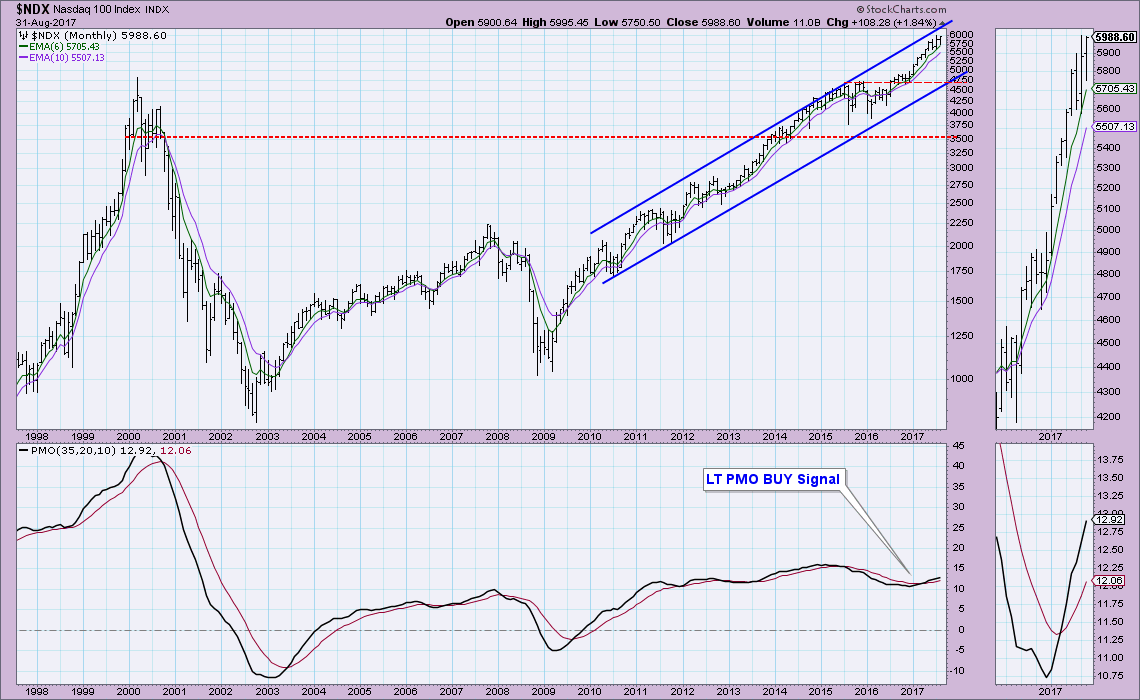
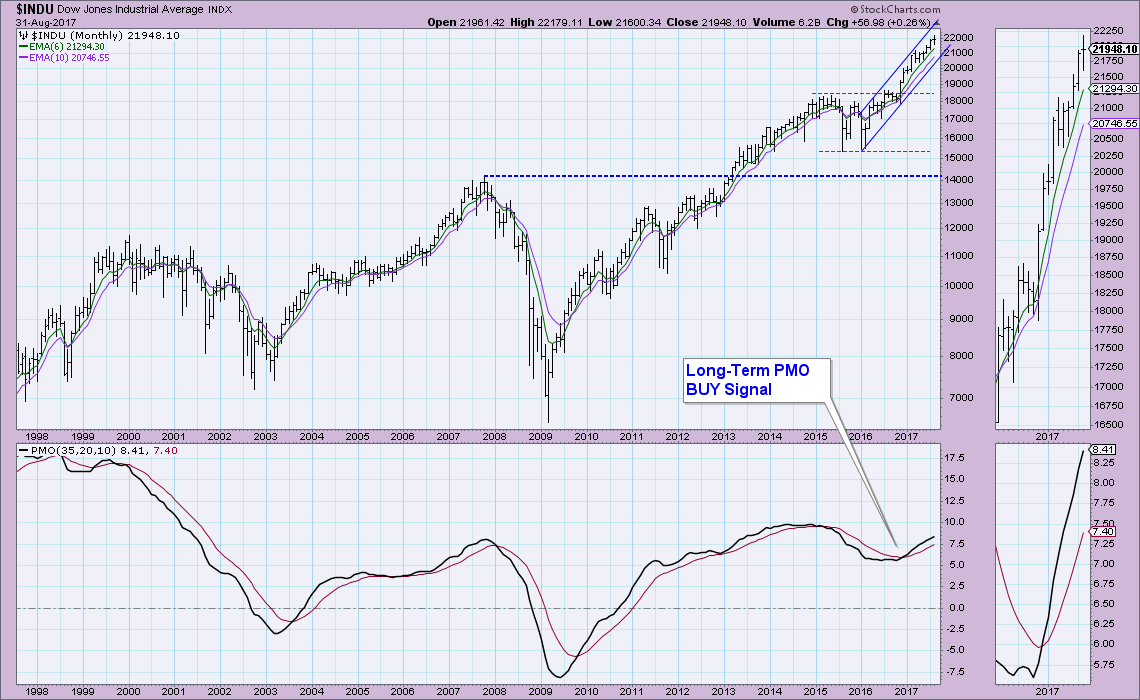
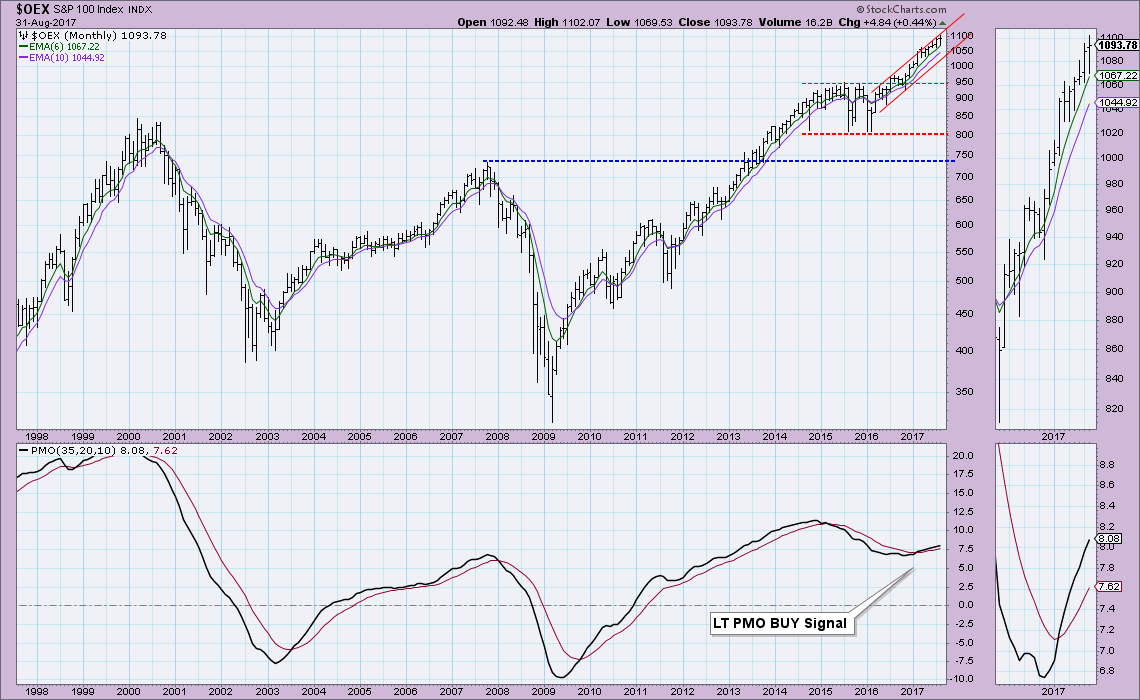
As far as the DecisionPoint Scoreboard indexes, you'll see that all four have rising monthly PMOs that are not showing any real hesitation in their climb higher. All of these indexes are also showing beautiful rising trends with 6-month EMAs above the 10-month EMAs. This tells me that the market as a whole is healthy in the long term. We should expect higher prices in the coming months. However, I lay out some caution. You'll note that in all of the rising trend channels, price is near the top of the channel. This means that even a corrective move to the bottom of their rising trend channels would not break the rising trend. With the PMOs so bullish, I'm not expecting anything serious, but as an example, the NDX has to fall to 4850 to 5000 to test the lower part of its rising trend channel. That's a deep cut from the current 5988.50.
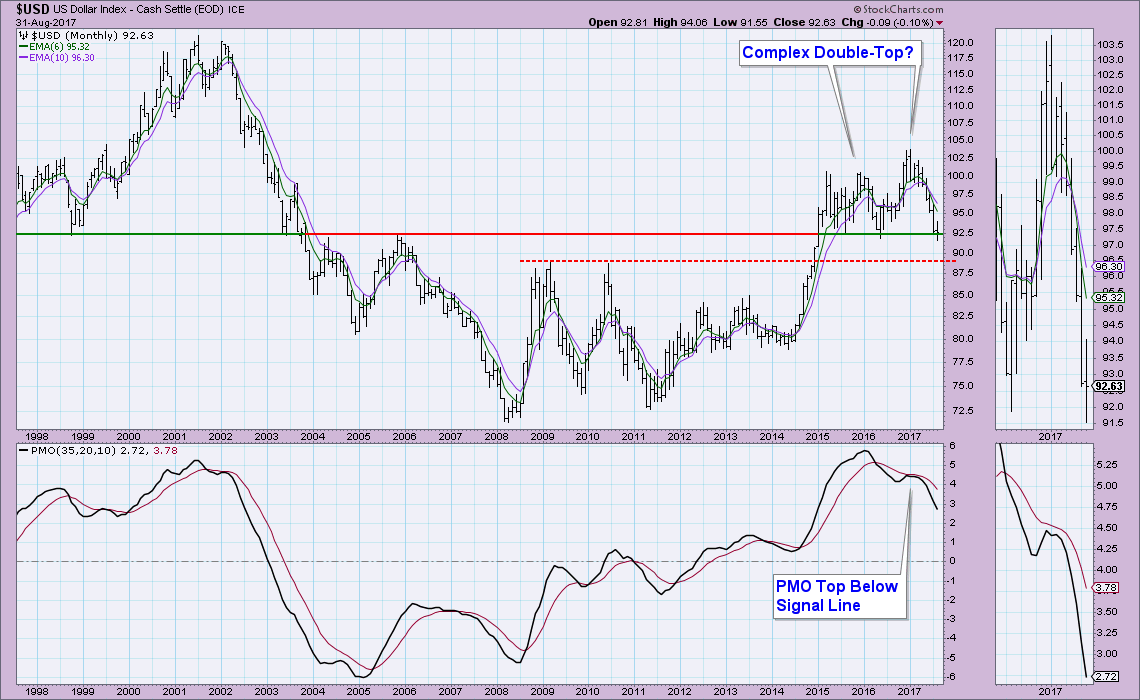
The DecisionPoint "Big Four" are Dollar, Gold, Oil and Bonds. There are no new signal changes but these charts are interesting!
As I sat and stared at the monthly chart for the Dollar, I noted what could be a bearish double-top. The first top is a bit messy but I think it gets by under the heading "complex" double-top. Price managed to close above long-term support, although during the month it did dip below. The PMO is sharply declining and is far from neutral, let alone oversold territory. There is room to support follow-on to the current correction. Using measurements for calculating minimum downside targets for double-tops, I subtracted the height of the pattern from the neckline. That would put the minimum downside target at 82.50, well-below the support level along the double-top from 2008-2010. I can see 85.00 acting as strong support too, along the 2012-2013 tops. Let's watch closely this week to see if a break down begins or if support holds.
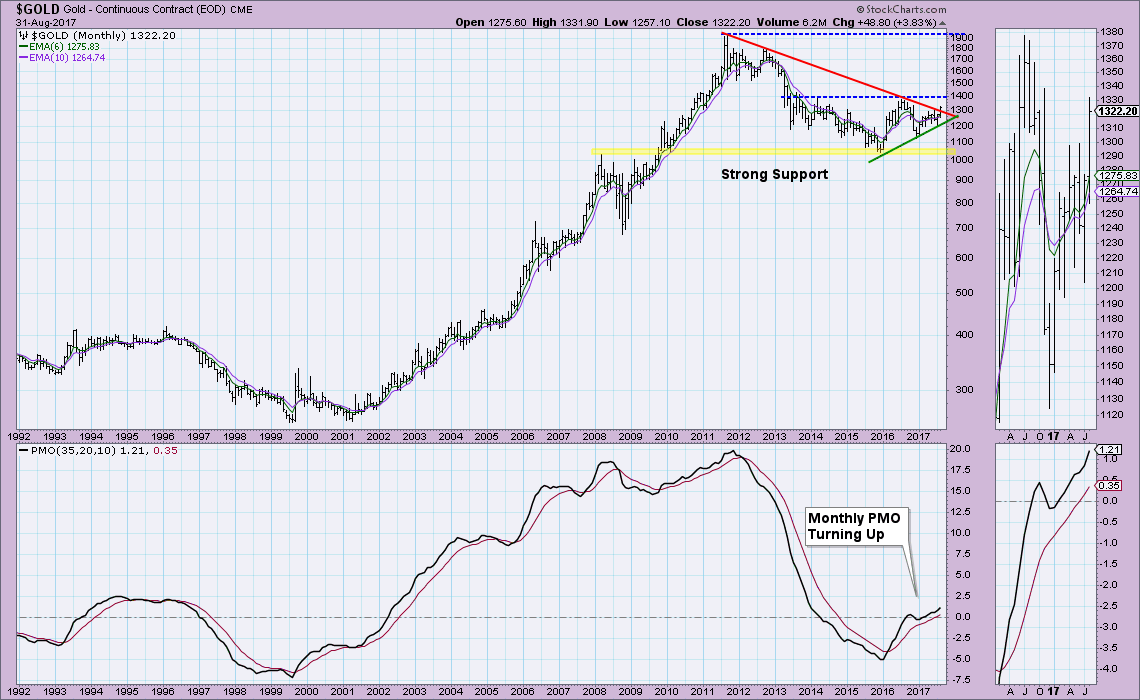
Gold technically broke above its declining tops trendline, but barely. Price is being squeezed into a symmetrical triangle. It's a continuation pattern which means we should actually expect a downside break; however, as most of you know, these patterns can break in either direction. The PMO looks great! It is rising and if you look in the thumbnail, it is accelerating higher. The expectation is an upside breakout move to 1400. What could hurt Gold is a Dollar rally. Typically as the Dollar rises, Gold falls. Looking strictly at both of their monthly charts, the bias is for the Dollar to continue lower and Gold to move higher.
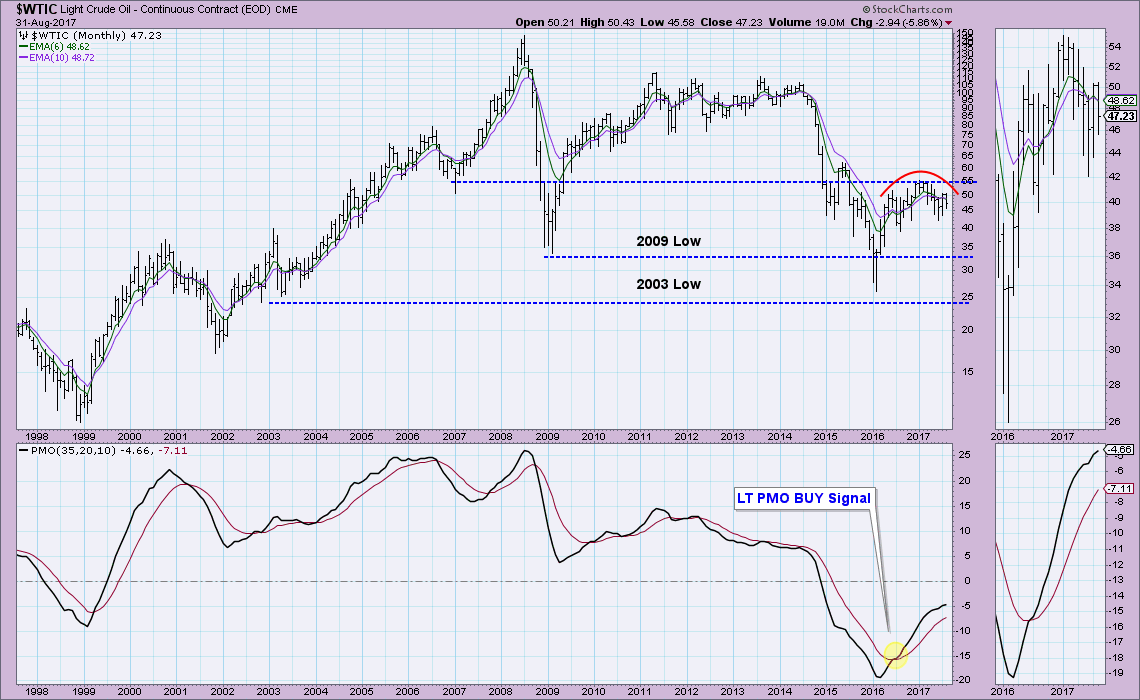
Oil rallied through much of 2016, but 2017 has been rough. I'm now seeing a rounded top which would imply lower prices. The PMO is still rising, but decelerating somewhat. I believe the $40 level will provide support, but look for more oscillation between $45 and $55/barrel as the PMO begins to top.
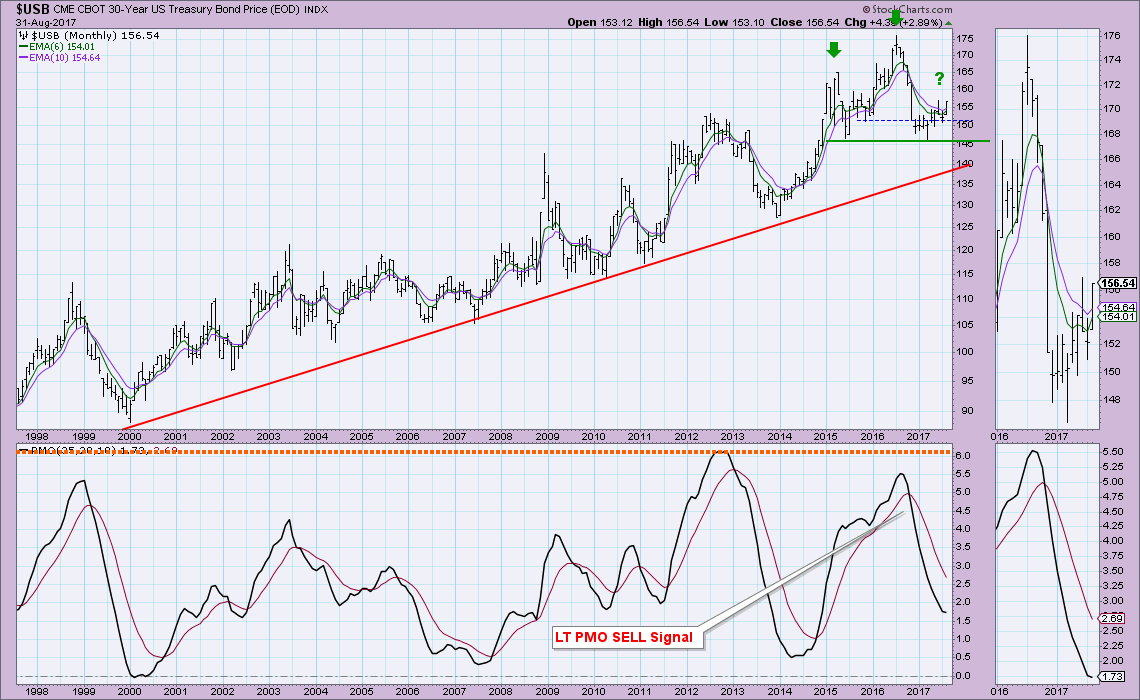
I think there is opportunity for Bonds, but I'm worried that this current rally will stall out and form a right shoulder to a head and shoulders pattern. The PMO has nearly stopped in its tracks and appears ready to turn up. Tom Bowley has been talking about Treasury Yields on the rise the next few weeks. That will effect bonds in a negative way so I am expecting a rally peak around $160 and a move to test the neckline at $145.
Helpful DecisionPoint Links:
DecisionPoint Shared ChartList and DecisionPoint Chart Gallery
Price Momentum Oscillator (PMO)
Swenlin Trading Oscillators (STO-B and STO-V)
Technical Analysis is a windsock, not a crystal ball.
Happy Charting!
- Erin
**Don't miss DecisionPoint Commentary! Add your email below to be notified of new updates"**
