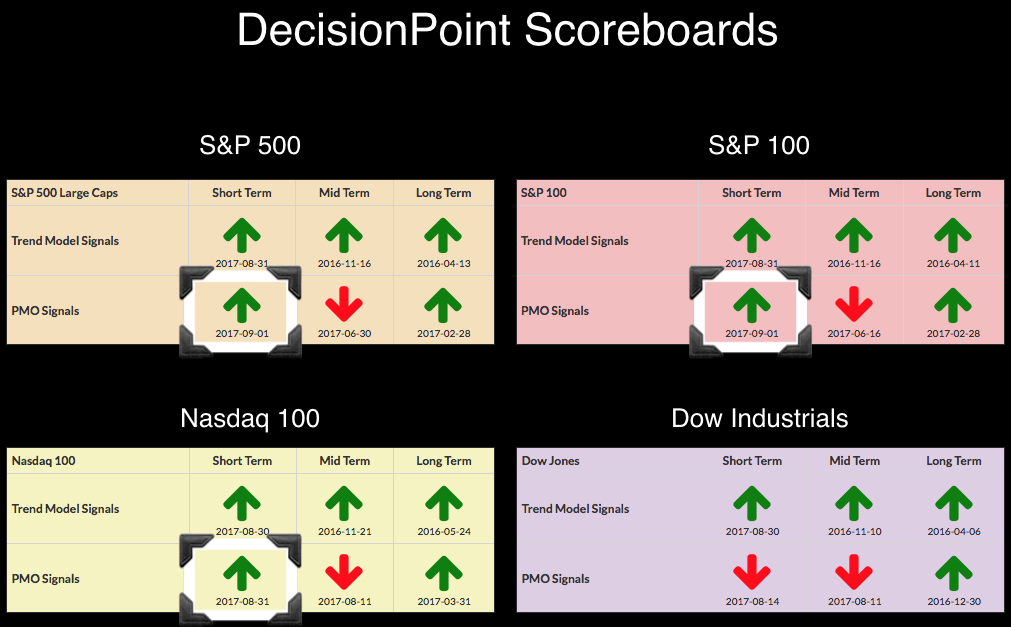
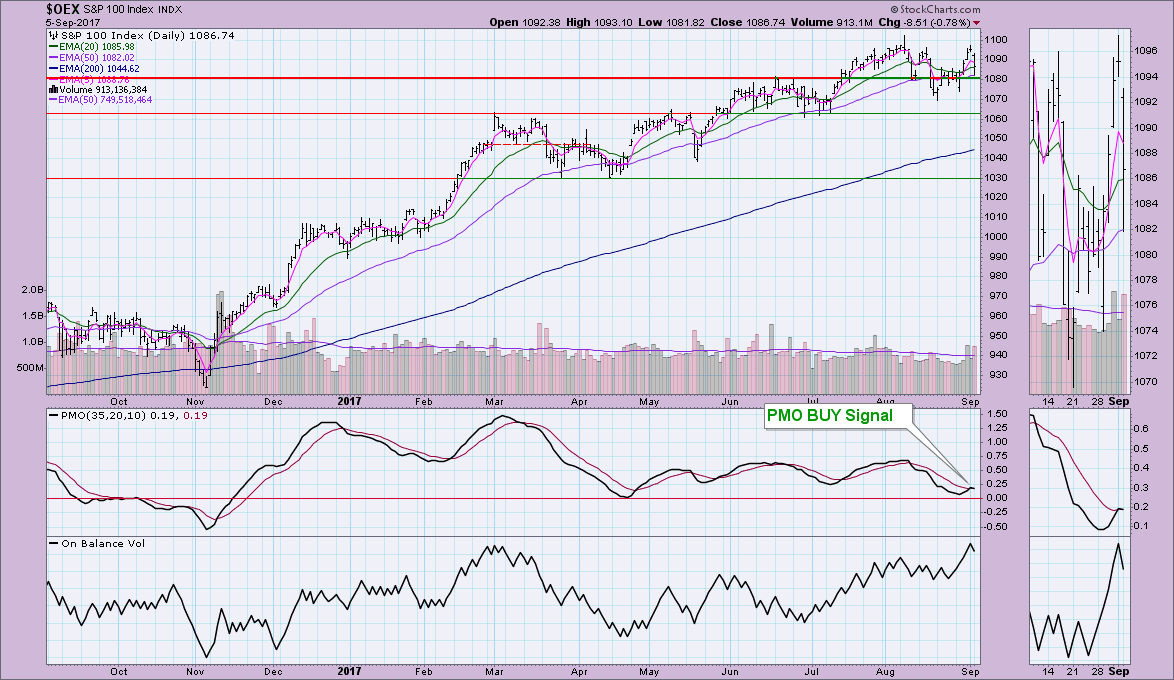
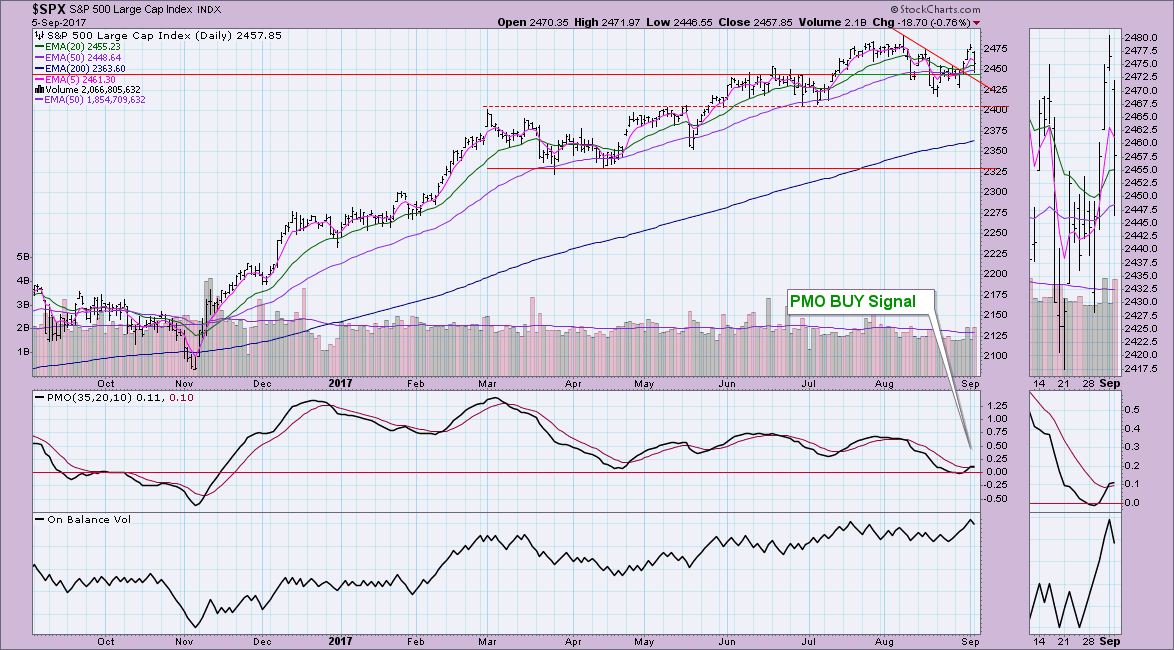
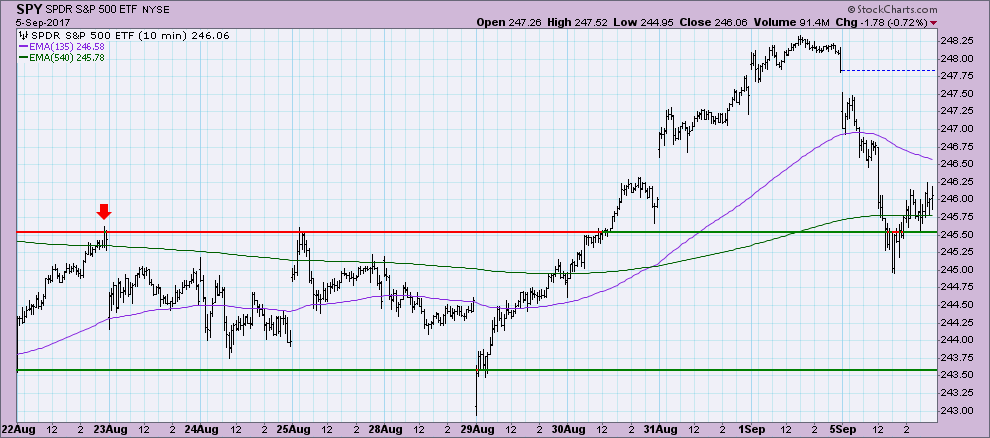
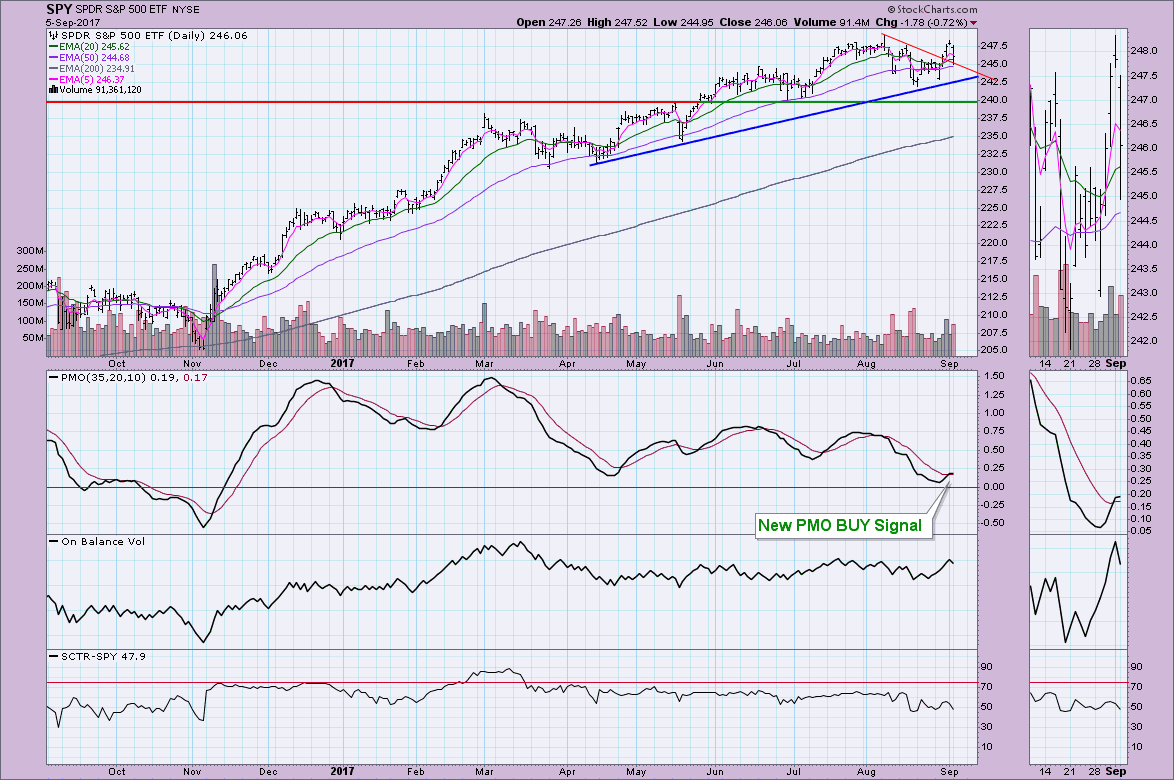
 A few new Price Momentum Oscillator (PMO) BUY signals appeared on the DP Scoreboards Thursday and Friday. Friday, the SPY generated a PMO BUY signal as well. You'll note on the charts below the Scoreboards, that these three major indexes had difficult days, but price managed to stay above declining tops line or horizontal support.

The purpose of the DecisionPoint Alert Daily Update is to quickly review the day's action, internal condition, and Trend Model status of the broad market (S&P 500), the nine SPDR Sectors, the U.S. Dollar, Gold, Crude Oil, and Bonds. To ensure that using this daily reference will be quick and painless, we are as brief as possible, and sometimes we let a chart speak for itself.
SIGNALS: Here we include charts of any important signal changes triggered today by our Intermediate-Term Trend Model.
NO NEW SIGNALS TO REPORT.
NOTE: Mechanical trading model signals define the implied bias of the price index based upon moving average relationships, but they do not necessarily call for a specific action. They are information flags that should prompt chart review. Further, they do not call for continuous buying or selling during the life of the signal. For example, a BUY signal will probably return the best results if action is taken soon after the signal is generated. Additional opportunities for buying may be found as price zigzags higher, but the trader must look for optimum entry points. Conversely, exit points to preserve gains (or minimize losses) may be evident before the model mechanically closes the signal.
STOCKS
IT Trend Model: BUY as of 11/15/2016
LT Trend Model: BUY as of 4/1/2016
The decline was deep today, but price did manage to pull out of the dive after lunch. At that point, you can see that horizontal support at previous intraday highs held.
PMO BUY signals remain intact, but if we see another decline that might bring price down to test the blue rising bottoms trendline, I suspect that BUY signal will die on the vine. Of course when price rebounds, it'll bloom once again. (Notice I said "when" price rebounds. I'll discuss more in the conclusion.)
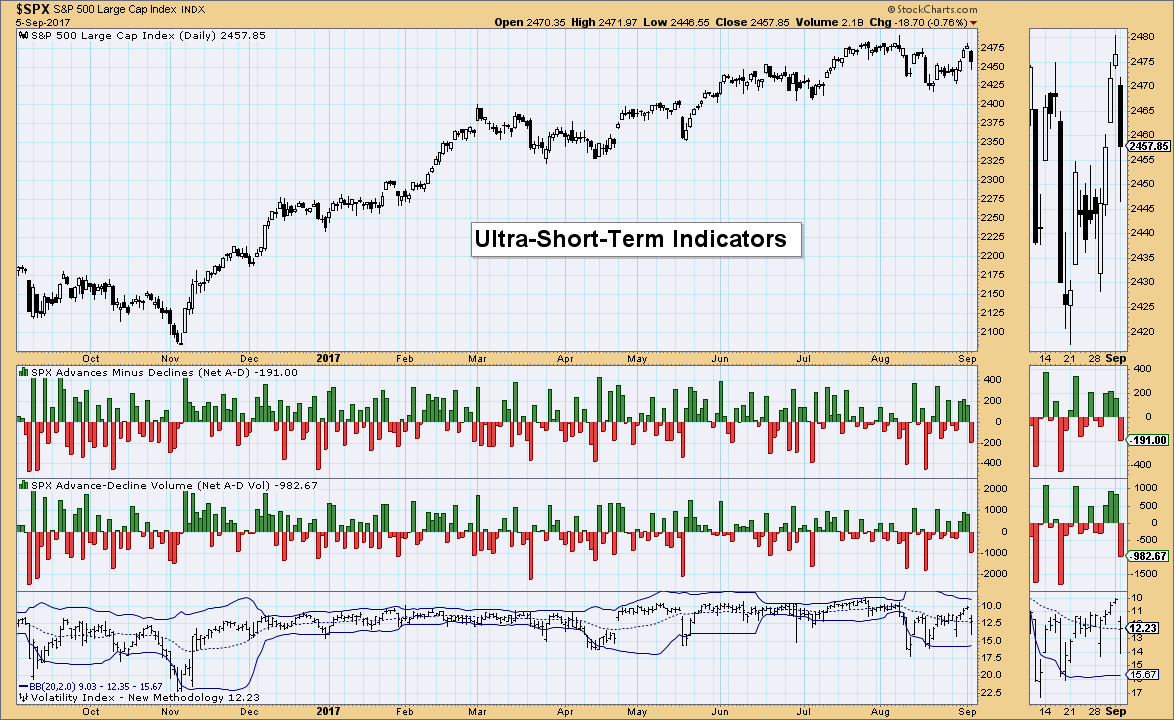
Ultra-Short-Term Indicators: Downside breadth was somewhat climactic, but it isn't all THAT climactic and the VIX, while finally drifting lower, hasn't quite tested the lower Bollinger Band. I think these indicators are suggesting some more downside for a day or two.
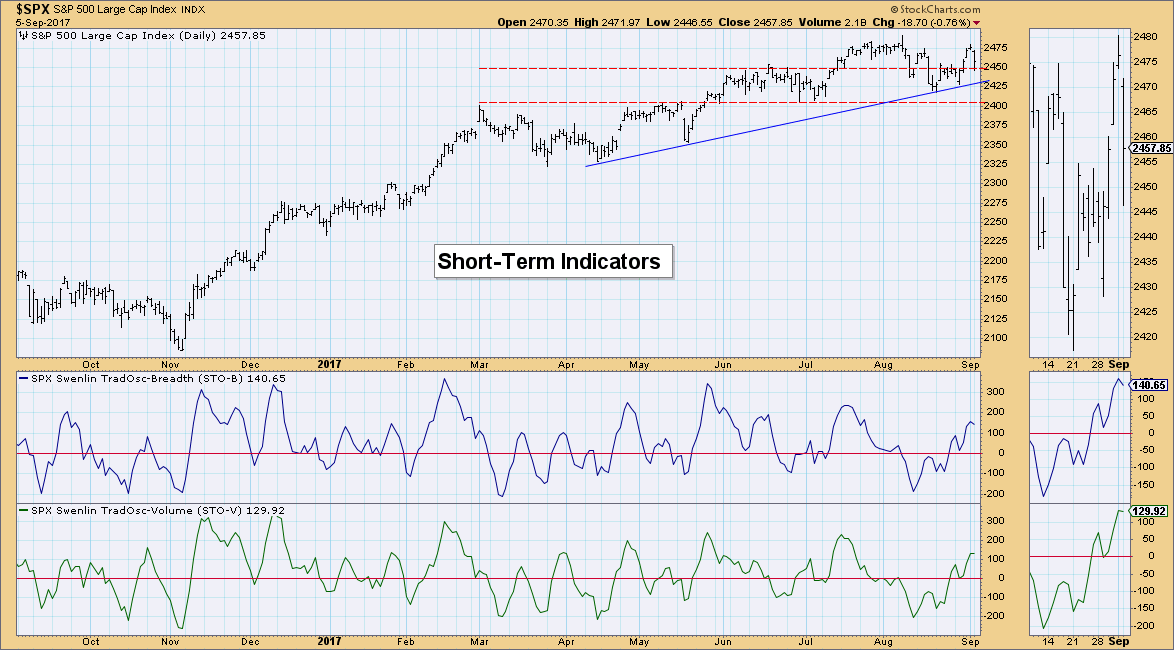
Short-Term Indicators: While I usually consider it bearish when these indicators turn down, I'm not right now. The rising trend is very visible without drawing trendlines. I suspect price will pull back to the 2425 area. That will unwind these indicators enough to prepare them for a drive higher toward the top of the range.
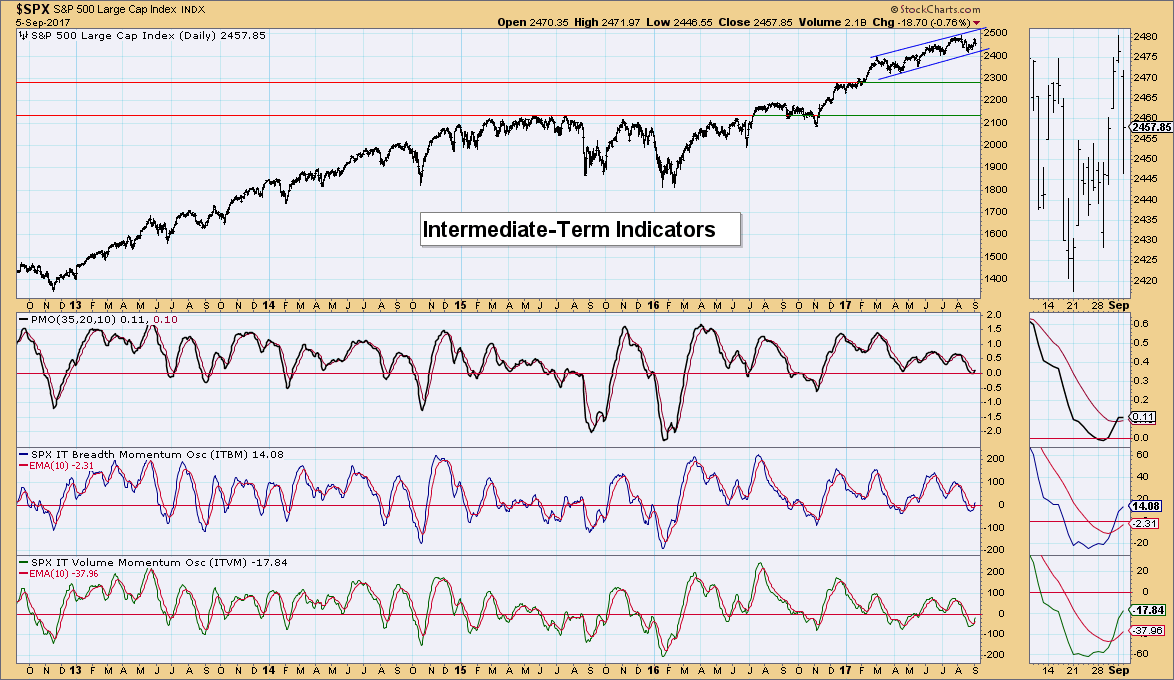
Intermediate-Term Indicators: We finally got the positive crossovers on the ITBM and ITVM. The bottom is arriving in near-term oversold territory. These indicators are very bullish right now.
Conclusion: The new PMO BUY signals tell me that the market is ready to make a move higher. Short-term and intermediate-term indicators are all bullish. However, as I noted on Friday's MarketWatchers LIVE show, I think this week the market will close lower. After that, given the bullishness of indicators and price movement, I expect to see all-time highs tested and broken.
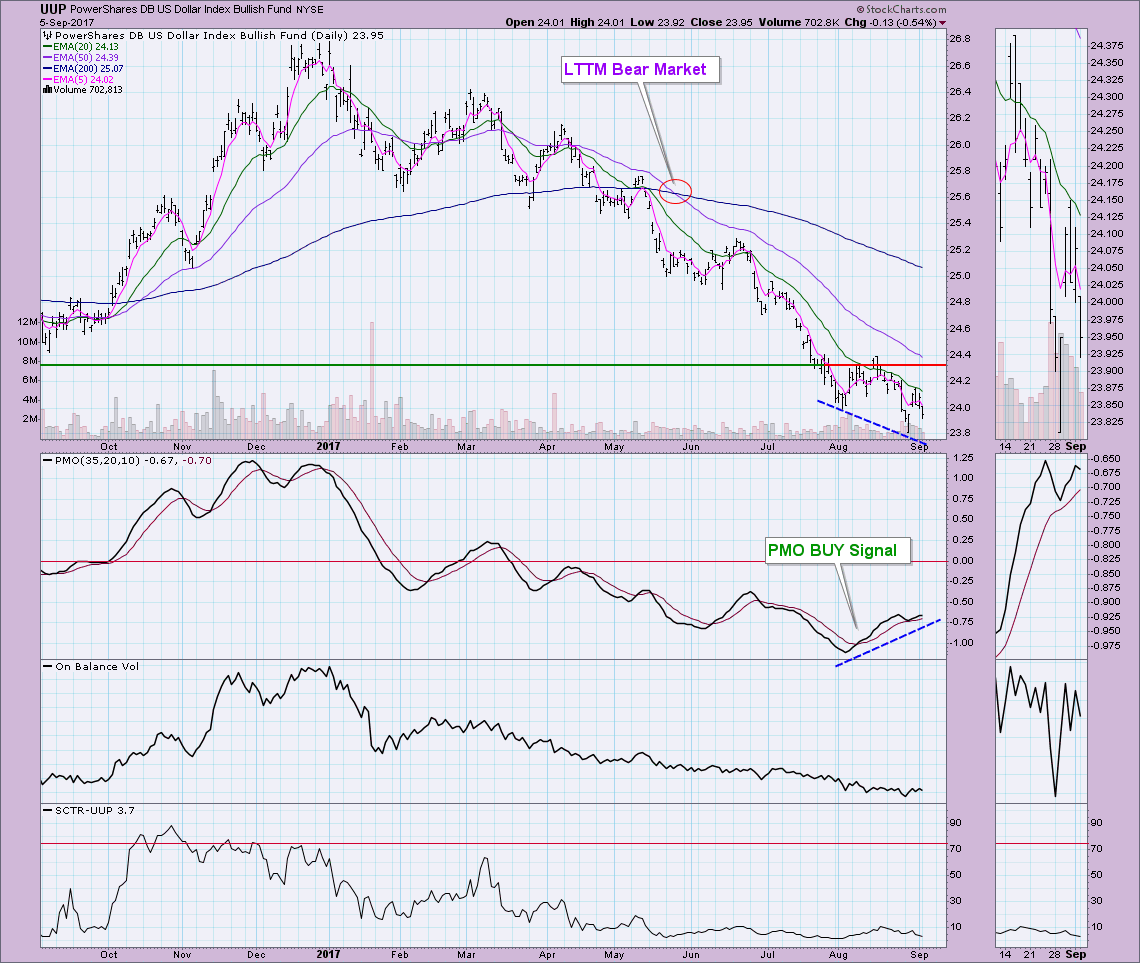
DOLLAR
IT Trend Model: NEUTRAL as of 3/21/2016
LT Trend Model: SELL as of 05/24/2017
The Dollar is attempting to form a strong bottom, but today, most of its upside progress was lost. The PMO is telling us to believe a bottom has been made, but the OBV and SCTR aren't providing any supporting evidence. Although the PMO has topped, notice the very nice positive divergence between price bottoms and PMO bottoms. I'm looking for UUP to test resistance at $24.30 and then likely break out.
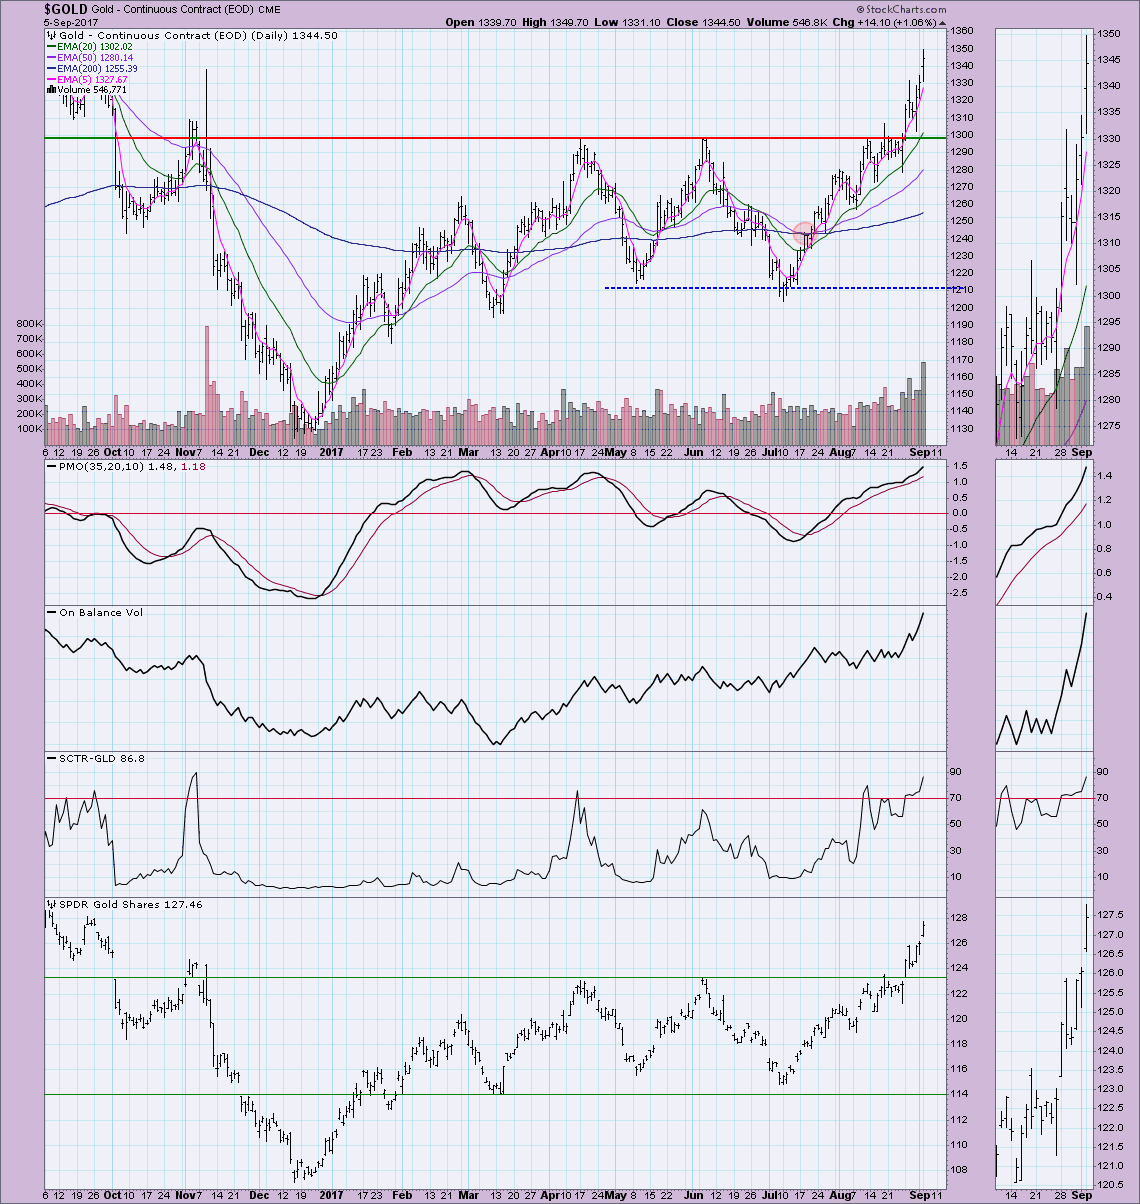
GOLD
IT Trend Model: BUY as of 7/31/2017
LT Trend Model: BUY as of 4/12/2017
Gold is on a tear, heading steadily toward resistance at 1400. The only thing that you can point to on this chart that is possibly negative is the overbought PMO. However, I've written numerous articles and shown you expanded daily charts that the PMO range for Gold is between -2 and +2. These aren't hard and fast ranges, we can see the PMO stretch outside the normal range in the case of a strong rally or decline. The chart looks fantastic...I only wish I'd gotten in before I left on my honeymoon!
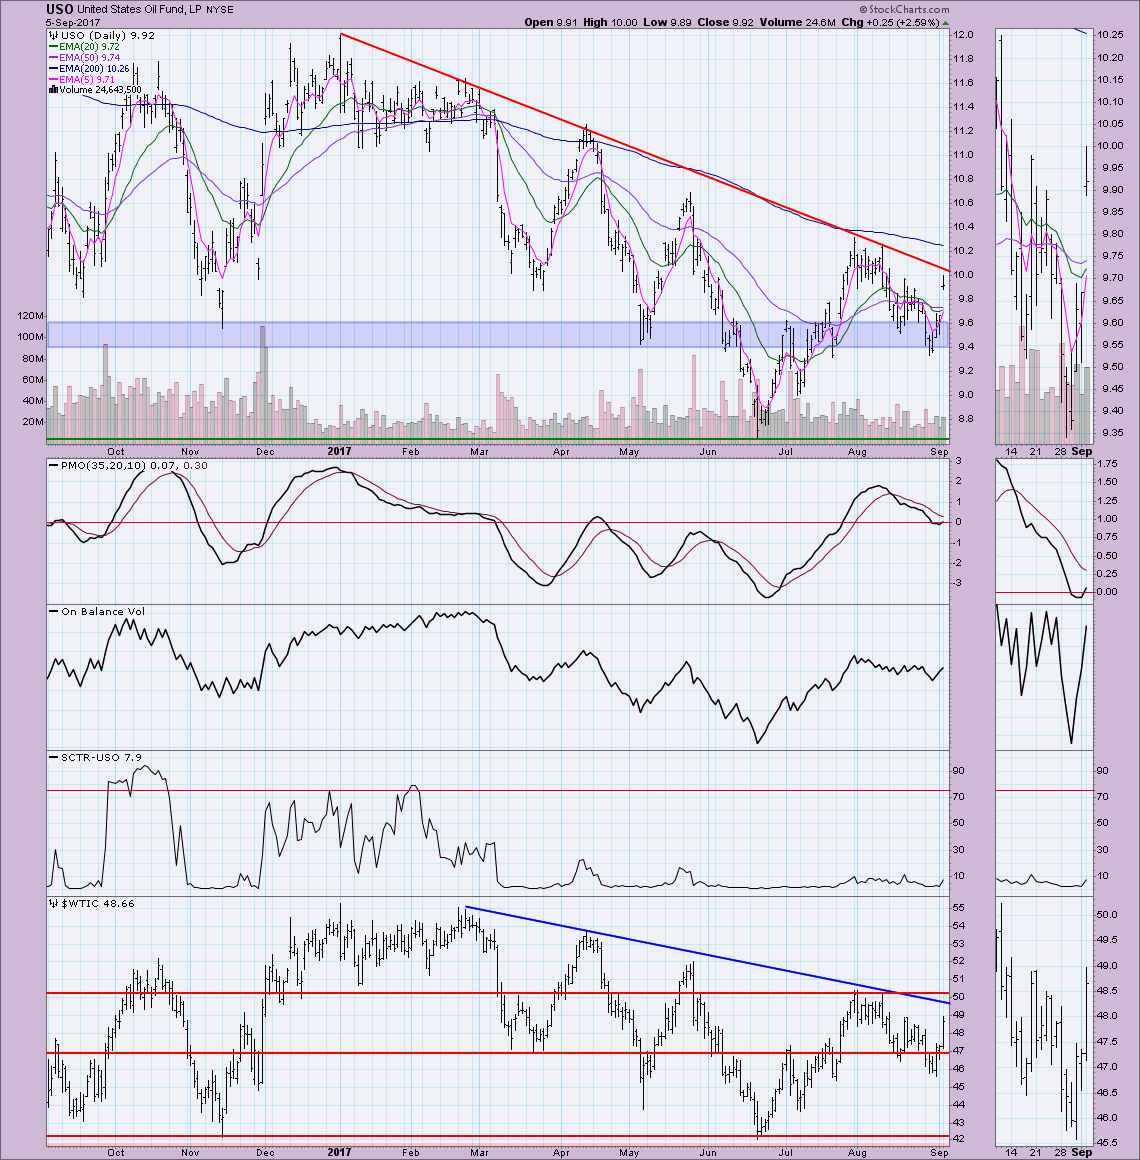
CRUDE OIL (USO)
IT Trend Model: SELL as of 8/29/2017
LT Trend Model: SELL as of 3/9/2017
Nice gap up and rally today. The PMO has now bottomed before dipping too low into negative territory. I'd like to see the OBV confirm this move by reaching above previous highs. Oil reaching $50/barrel seems likely.
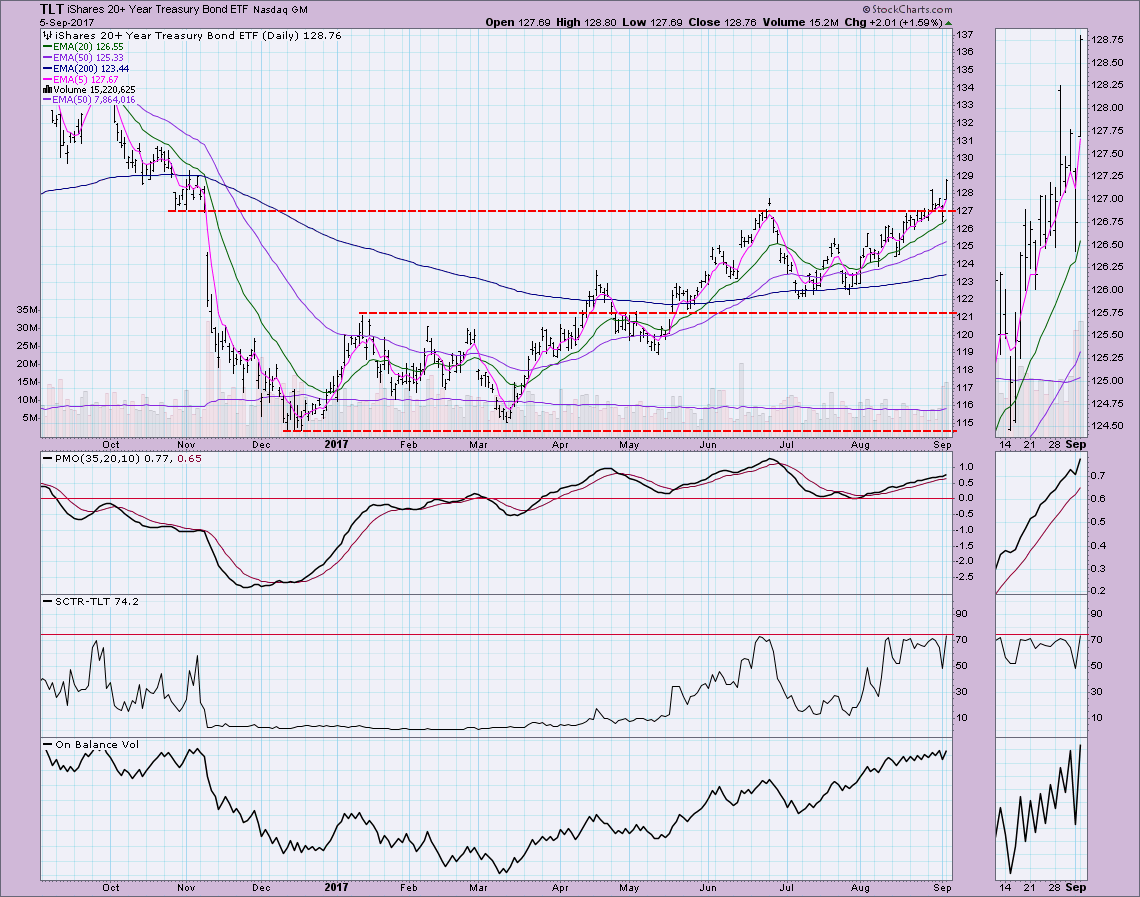
BONDS (TLT)
IT Trend Model: BUY as of 3/31/2017
LT Trend Model: BUY as of 6/16/2017
Really like the breakout on TLT. Price pushed up above resistance, poked back down and today soared to close above the June high. The OBV and SCTR look healthy. My only concern would be overhead resistance at the September 2016 low is now going to be tested.
Helpful DecisionPoint Links:
DecisionPoint Shared ChartList and DecisionPoint Chart Gallery
Price Momentum Oscillator (PMO)
Swenlin Trading Oscillators (STO-B and STO-V)
Technical Analysis is a windsock, not a crystal ball.
Happy Charting!
- Erin
**Don't miss DecisionPoint Commentary! Add your email below to be notified of new updates"**
