Lots of new signals today! Three important PMO signals arrived on the Dow, Bonds (TLT) and Dollar (UUP); not to mention two important Intermediate-Term Trend Model BUY signals on Russell 2000 ETF (IWM) and Consumer Staples SPDR (XLP). Feast your eyes on these charts!
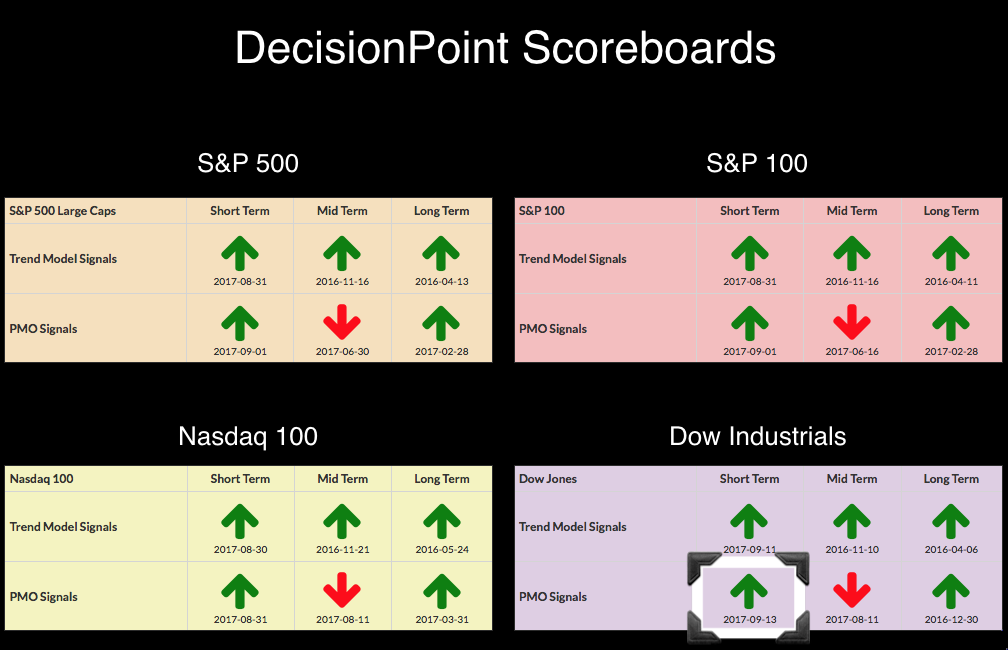
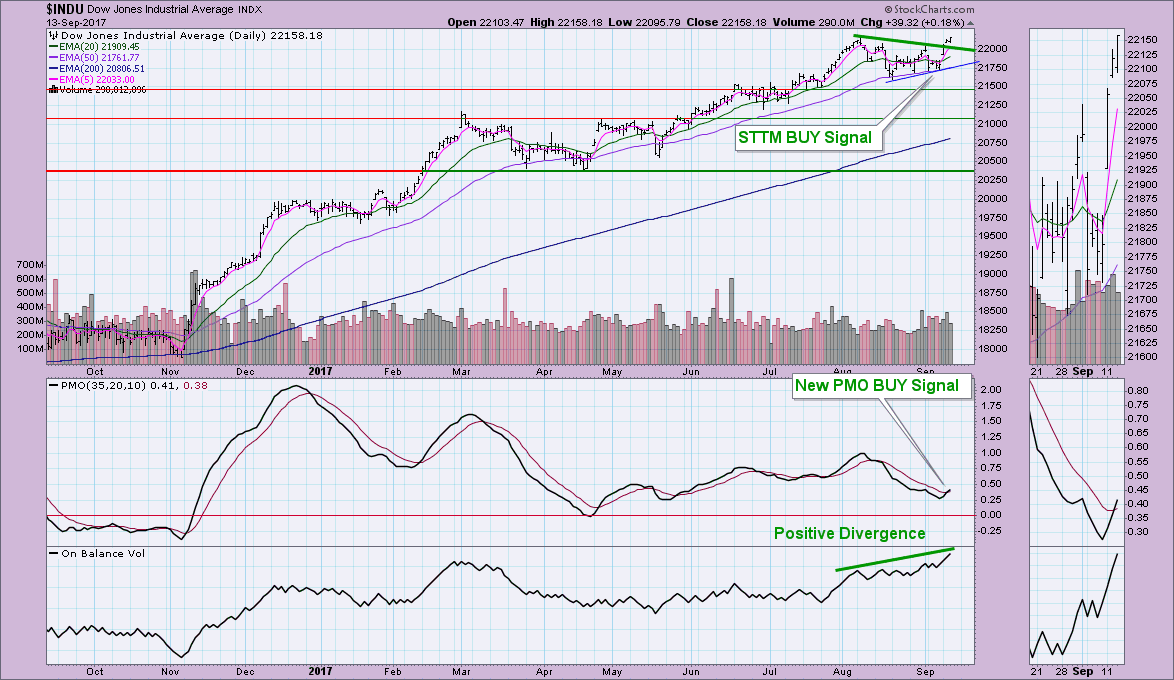
First and foremost, I must talk about the new PMO BUY signal on the Dow. For those of you reading the DecisionPoint blog religiously (hopefully you all do!), you'll know that we have been expecting this crossover buy signal for some time. I've updated the DP Scoreboard Summary below.
Looking at the daily chart for the Dow below, we can see that the positive divergence between the OBV and price played out as expected with an upside breakout. The 5-EMA has now put plenty of distance between it and the 20-EMA so we know the STTM BUY signal should remain intact. Record highs continue so it is hard to get bearish on industrials right now.
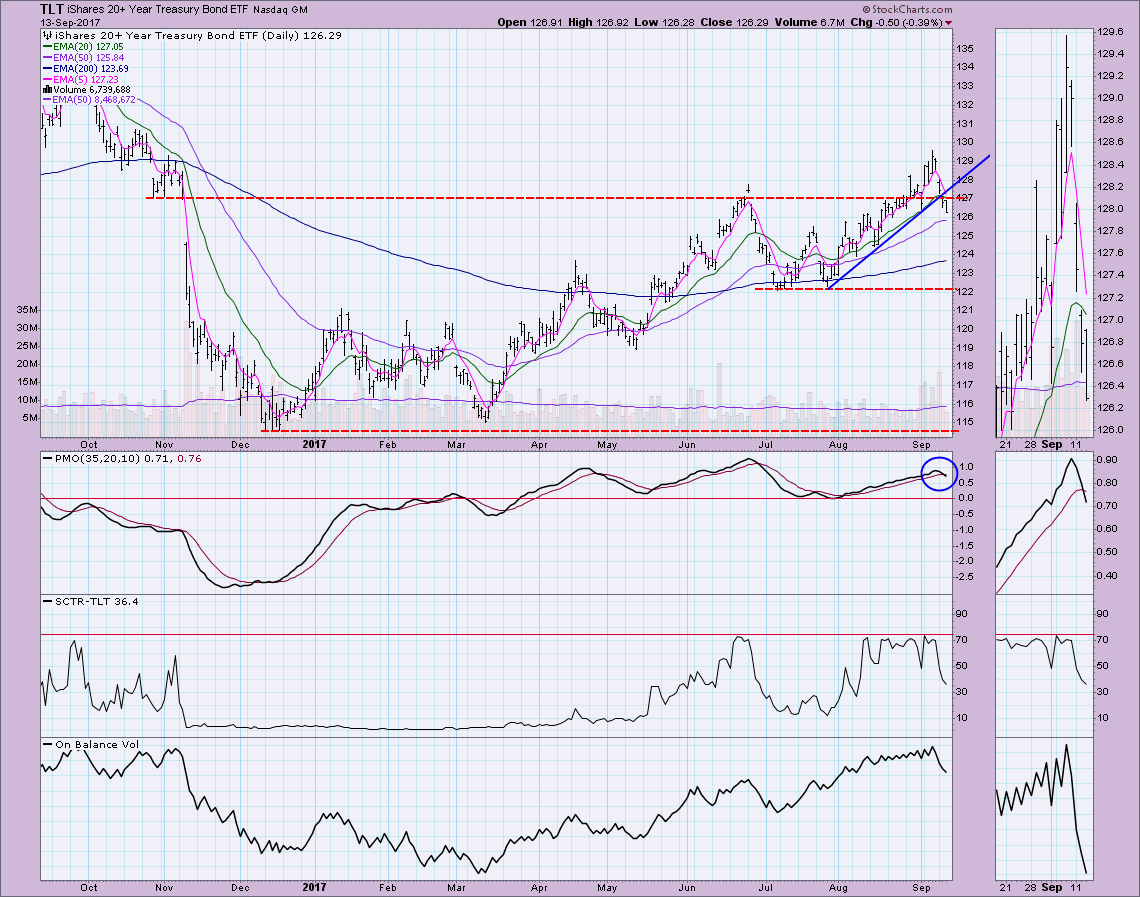
Next up are the new PMO signals on TLT and UUP. Let's first look at the ugly chart of TLT to see the new PMO crossover SELL signal in overbought territory. There is nothing positive to say about this chart right now. Price broke below the rising bottoms trendline and the OBV and SCTR are headed lower. I'm bearish Bonds. If the $126 level is broken, I wouldn't expect it to turn around until the $122 to $123 mark.
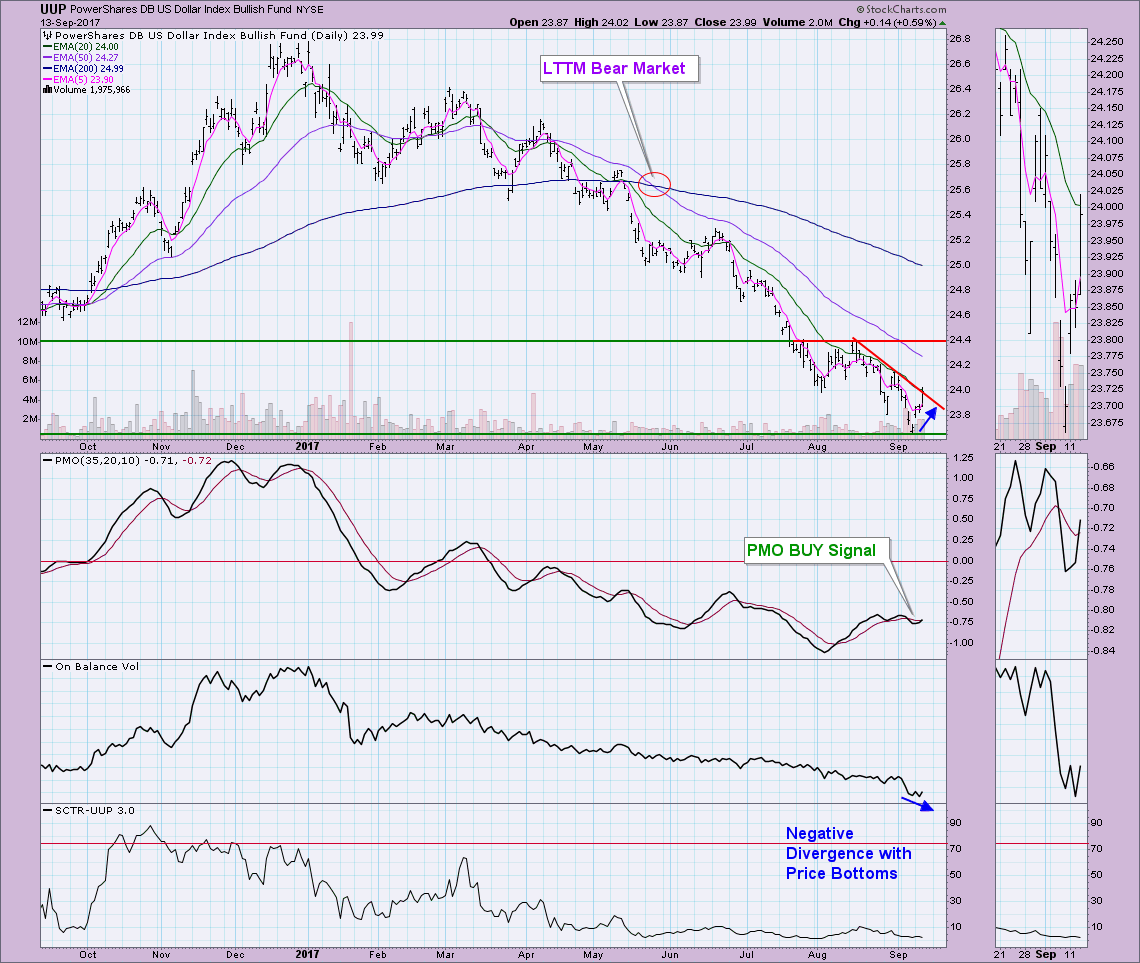
The Dollar has been on a roller coaster ride and the PMO reflects that. Although UUP generated a PMO BUY signal, I wouldn't get excited. The PMO has been flat and volatile. I don't like the negative divergence between the OBV and price. Price closed just on the declining tops trendline, not above it. The SCTR is still in the basement...I wouldn't trust this PMO signal.
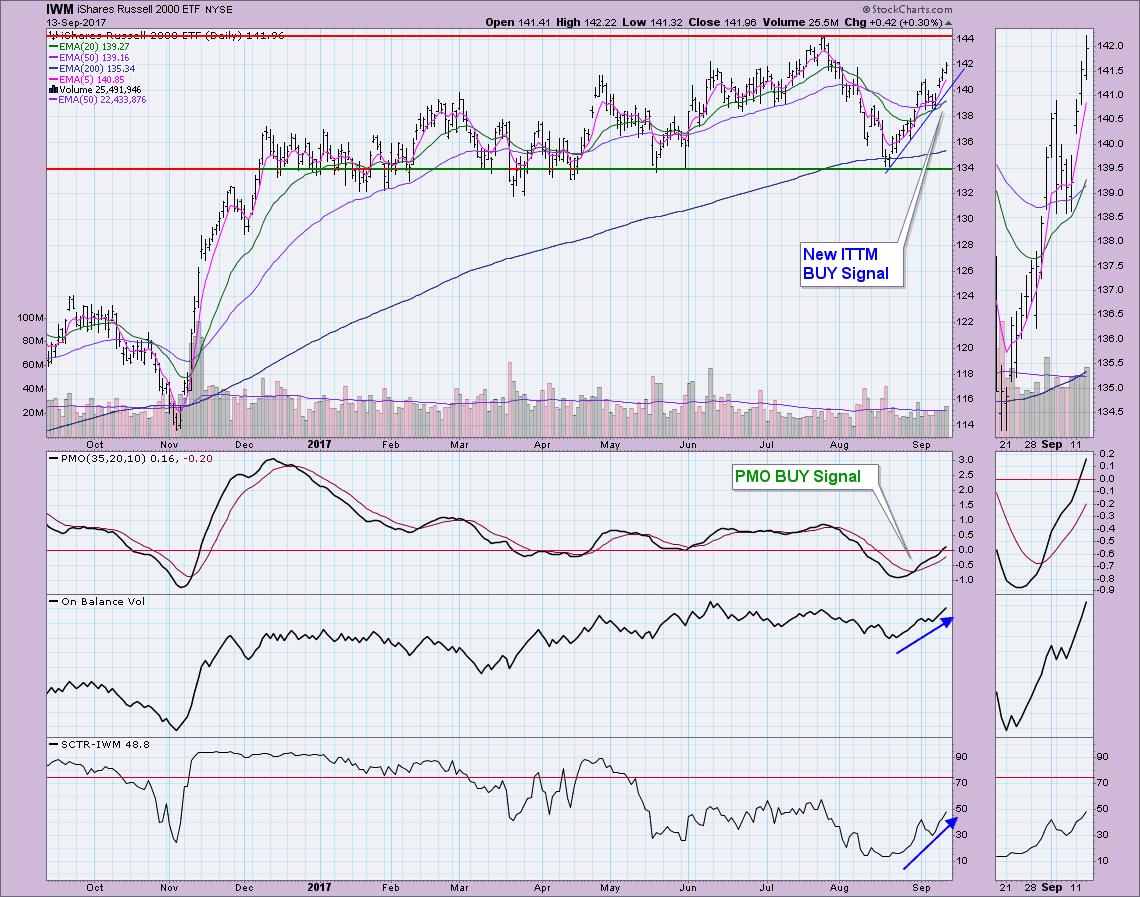
The Intermediate-Term Trend Model delivered two new signal changes of interest on the Russell 2000 ETF (IWM) and the Consumer Staples SPDR (XLP). Tom, Arthur and I talked about the gains in small-caps during today's MarketWatchers LIVE show. I also note that John Murphy discussed their rally in his latest member's only blog article. The PMO BUY signal came in oversold territory and was a clean crossover. IWM has developed a rather steep rising bottoms trendline, but it looks ready to hold. While IWM hasn't broke to new all-time highs like many of the large cap indexes, this chart looks very encouraging.
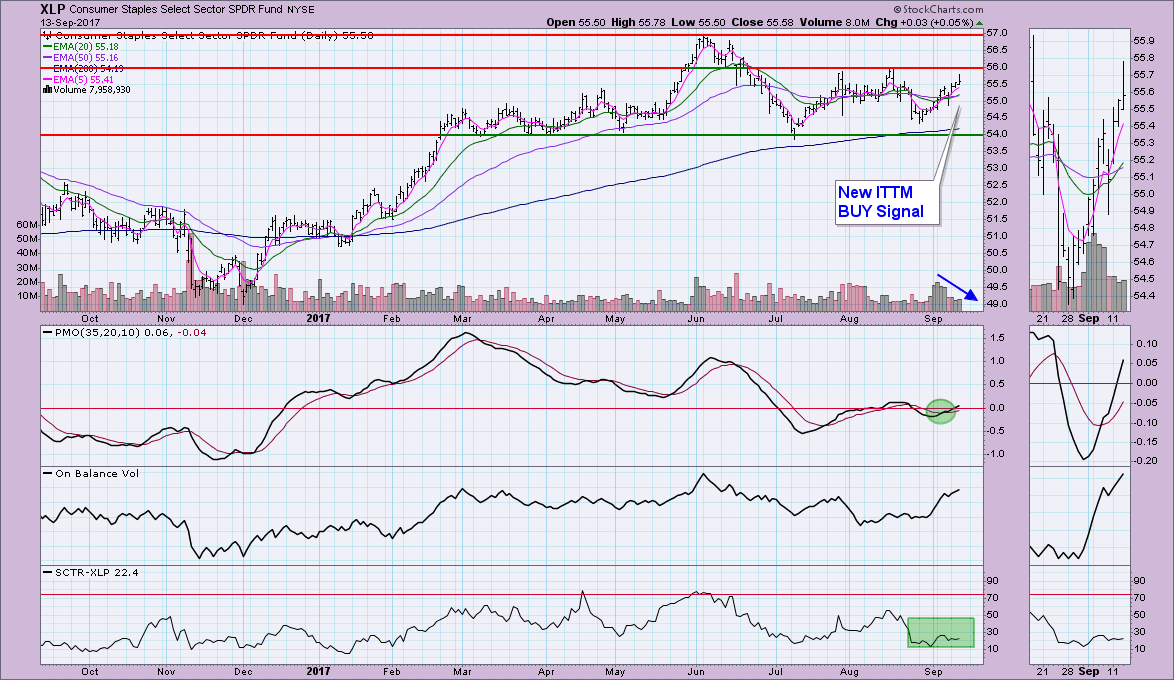
XLP triggered a new ITTM BUY signal as well when the 20-EMA crossed above the 50-EMA. However, I'm not a fan of this chart. Yes, we do have a PMO BUY signal and it has now moved back into positive territory and the OBV is rising. However, notice the negative divergence with the actual volume bars and the sideways SCTR. Price is likely going to struggle to breakout at $56. Notice that the 5/20/50-EMAs are braiding. This also doesn't inspire confidence in the ITTM BUY signal. Caution may be needed.
Helpful DecisionPoint Links:
DecisionPoint Shared ChartList and DecisionPoint Chart Gallery
Price Momentum Oscillator (PMO)
Swenlin Trading Oscillators (STO-B and STO-V)
Technical Analysis is a windsock, not a crystal ball.
Happy Charting!
- Erin
**Don't miss DecisionPoint Commentary! Add your email below to be notified of new updates"**
