We usually feature a SPY chart in this space, but Apple (AAPL) has really grabbed my attention recently. I have been watching it for a few weeks as it formed a rounded top, and finally broke down through horizontal support on Thursday. AAPL is important to the broad market because it is so heavily weighted in the major market indexes. If it tanks, it will certainly affect the rest of the market. On the positive side, after three day's of selling, it appears to have made a short-term bottom.
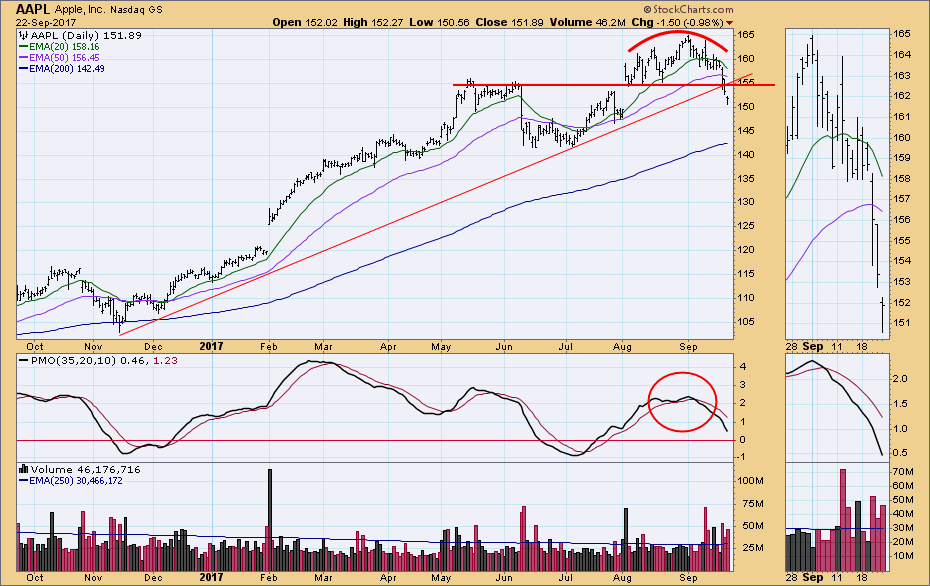
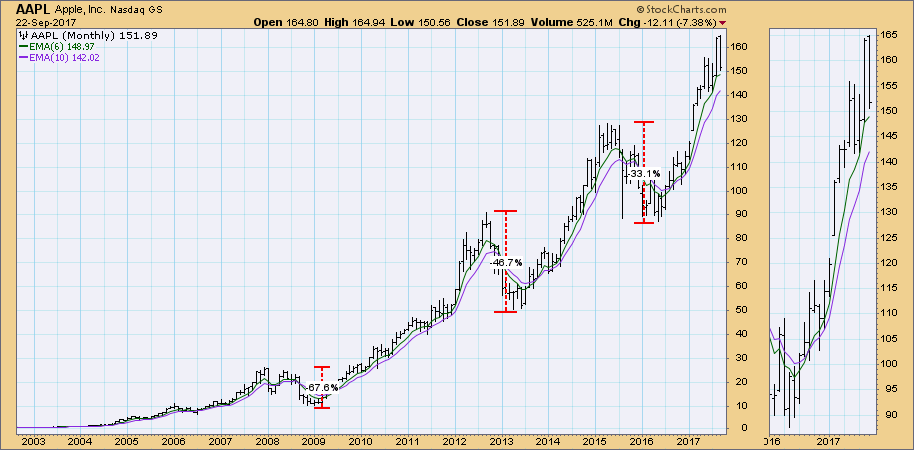
I know it is blasphemy to speak ill of AAPL, but a healthy correction is possible. On the monthly chart below we can see that there have been three major pullbacks in the last ten years, and sufficient time has elapsed since the last one, that it would not be unreasonable to expect another correction at this time. Actually, it is already in a correction (-9%). The question is when it will end.
The DecisionPoint Weekly Wrap presents an end-of-week assessment of the trend and condition of the stock market (S&P 500), the U.S. Dollar, Gold, Crude Oil, and Bonds.
STOCKS
IT Trend Model: BUY as of 11/15/2016
LT Trend Model: BUY as of 4/1/2016
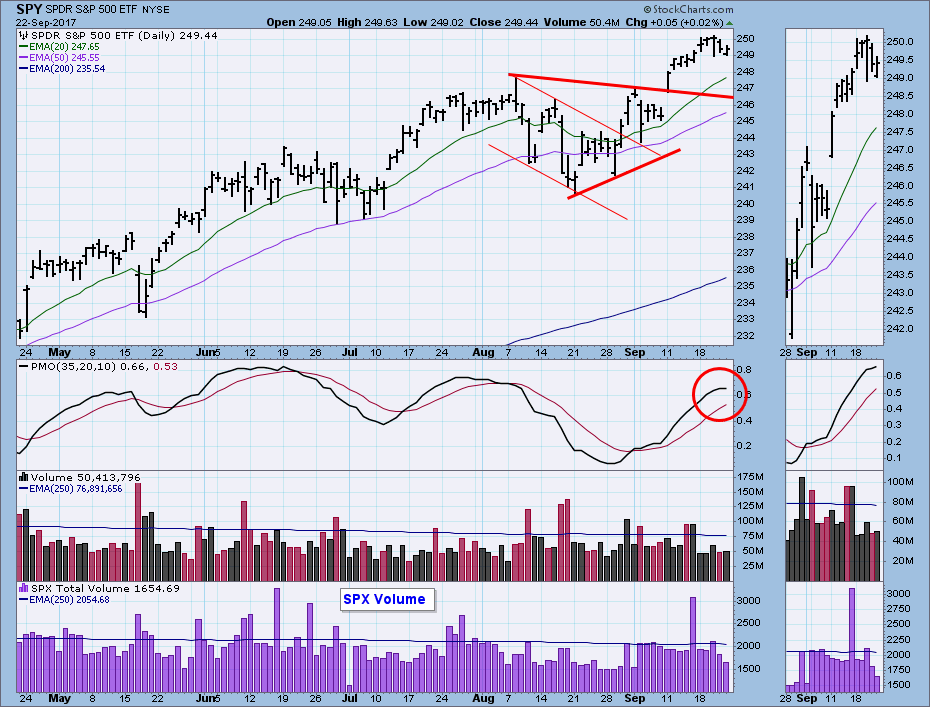
The daily chart shows the market very close to all-time highs, but it looks as if it is trying to top. The daily PMO is overbought and about to top as well.
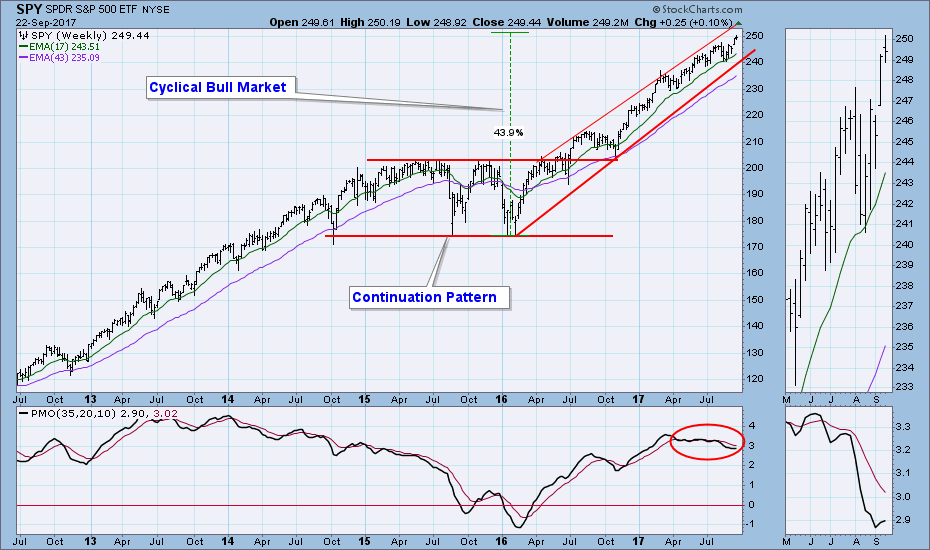
The weekly PMO turned up last week. There is room for a small correction without doing any damage in this time frame.
Short-Term Market Indicators: They topped last week, but it wasn't until this week that we finally got a small price top. The indicators leave plenty of room for further price decline.
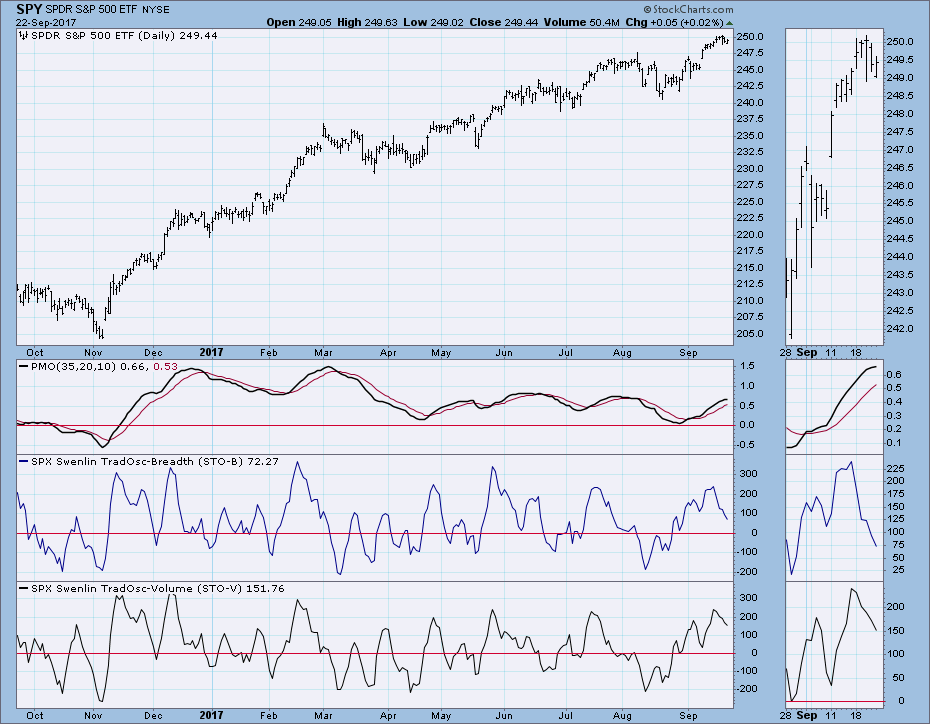
Intermediate-Term Market Indicators: These indicators are relatively overbought, and they will top if there is any price weakness next week. Note the fairly regular cyclical price tops we have seen this year, and it appears that another top has just appeared.
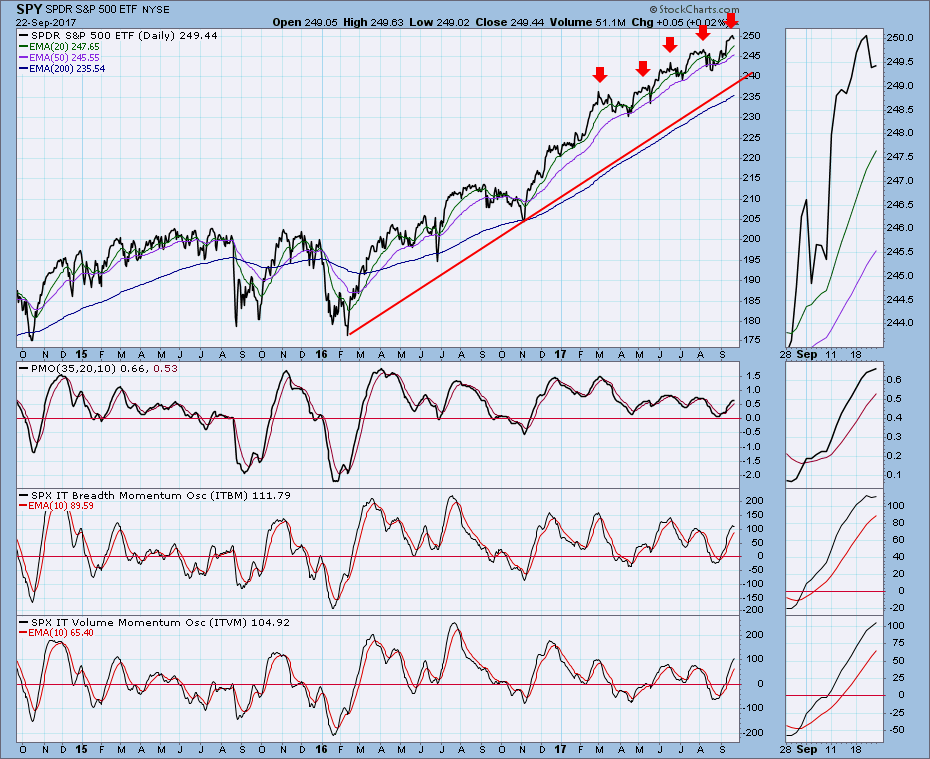
Conclusion: The weakness AAPL is showing is bleeding through to the rest of the market, which seems to be preparing for its own correction. If I am right about that, I have no reason to think it will be a major downturn, just move down to the 50EMA as we have seen four other times in the last seven months.
DOLLAR (UUP)
IT Trend Model: NEUTRAL as of 3/21/2017
LT Trend Model: SELL as of 5/24/2017
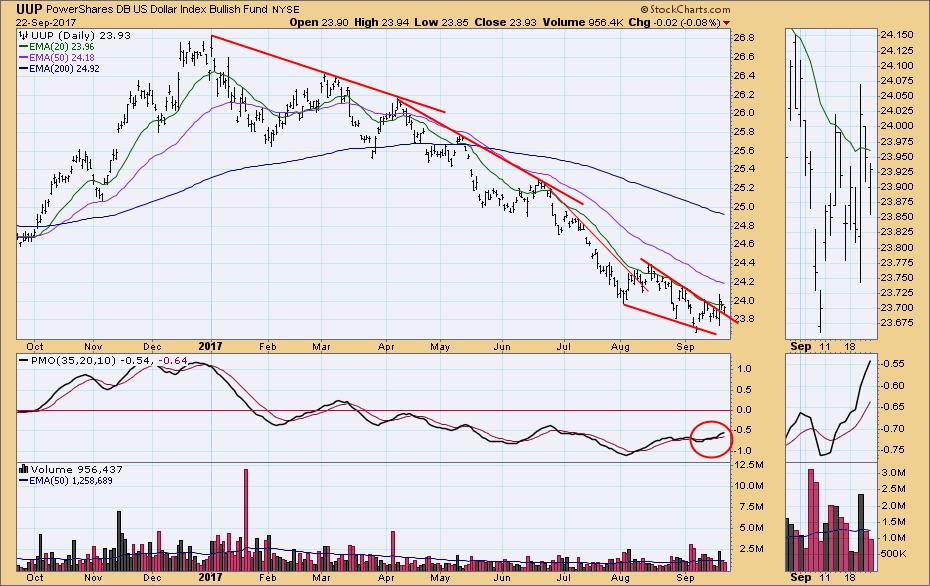
On the daily chart UUP resolved the falling wedge formation to the upside, as expected. Unfortunately, it has made little headway since.
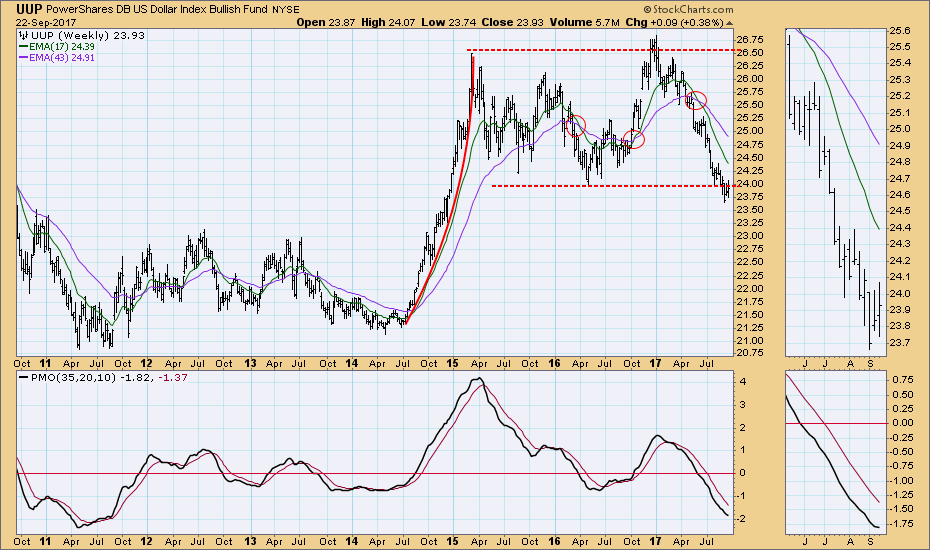
On the weekly chart UUP is still engaged with the long-term horizontal line, drawn from the 2016 low. Until three weeks ago that line represented support. Now it is resistance that needs to be overcome. The weekly PMO is oversold and showing signs that it may bottom.
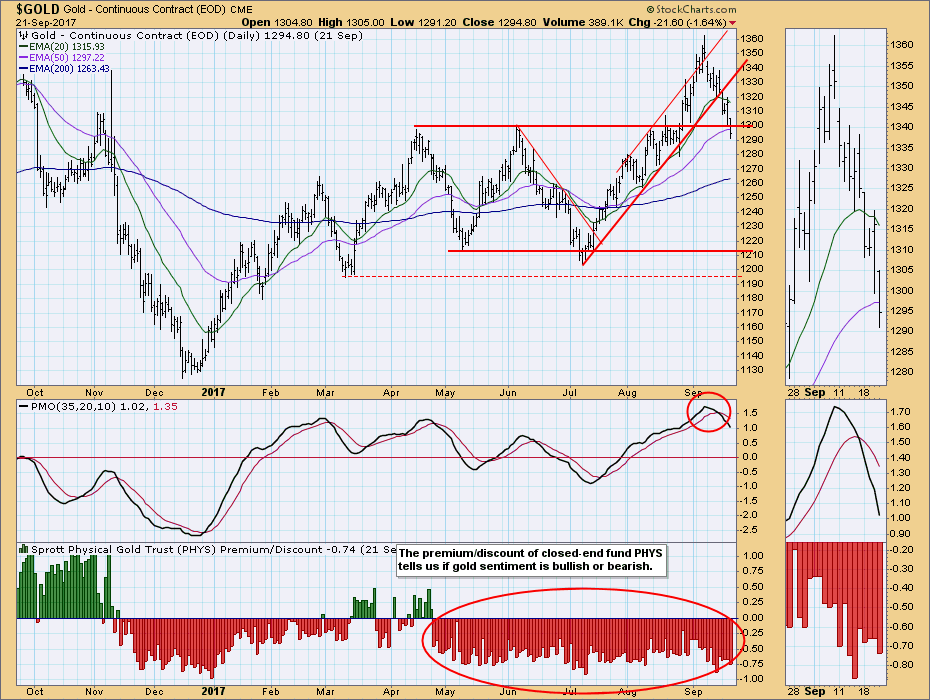
GOLD
IT Trend Model: BUY as of 7/31/2017
LT Trend Model: BUY as of 4/12/2017
In the daily time frame gold has broken down through important support lines. The PMO, which was overbought, has topped and crossed down through the signal line. It leaves plenty of room for more downside. Sentiment remains bearish, which will put drag on any rally.
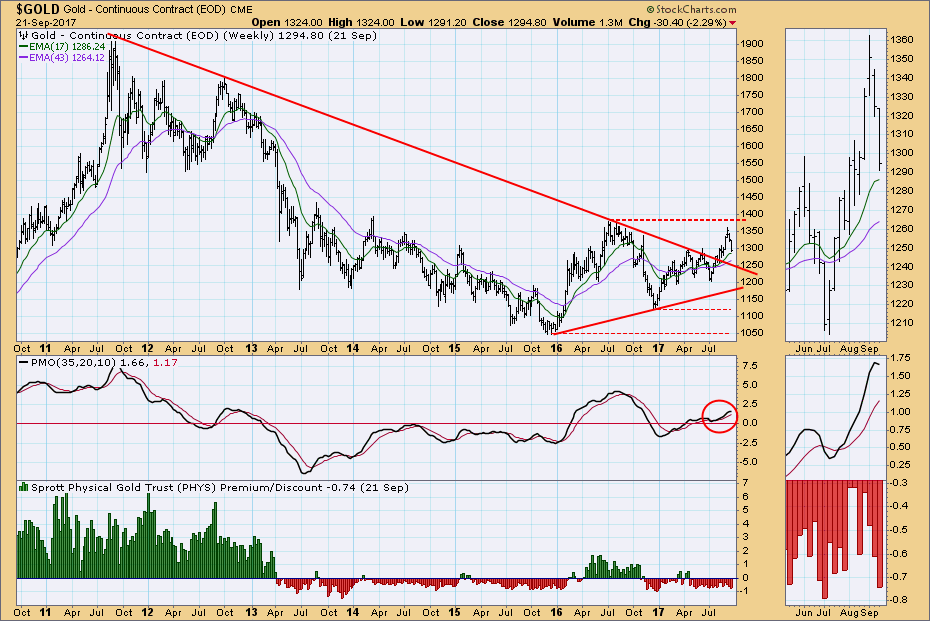
Gold's recent pullback has caused the weekly PMO to top, which implies more price decline lies ahead. While the price breakout above the long-term declining tops line was decisive, the current pullback may take price all the way back to test the support of that line.
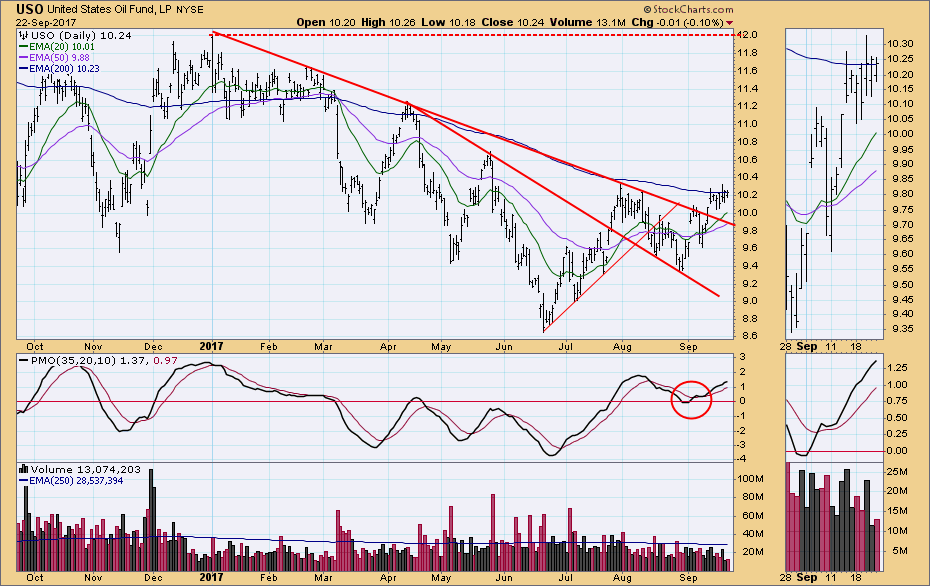
CRUDE OIL (USO)
IT Trend Model: BUY as of 9/6/2017
LT Trend Model: SELL as of 3/9/2017
USO has broken above a persistent declining tops line, and has been consolidating below the 200EMA for over a week.
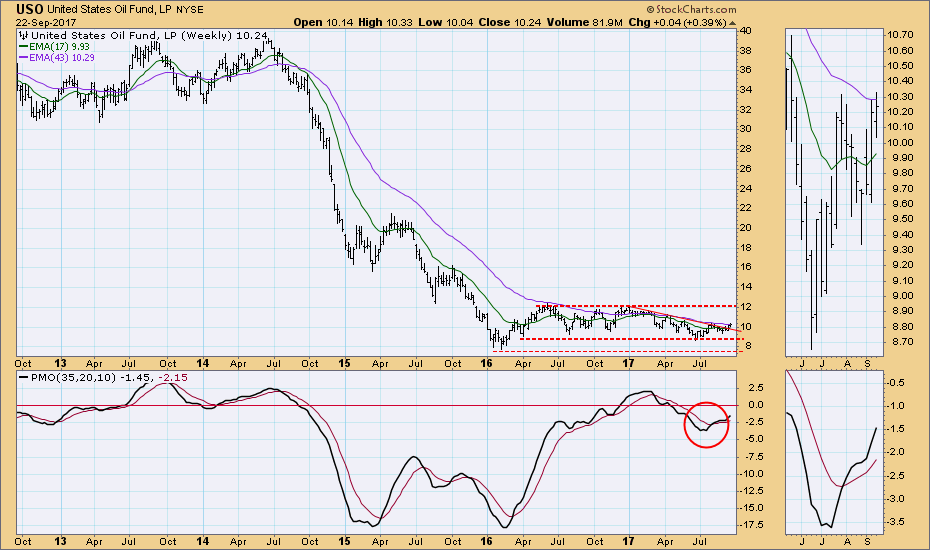
The top of the 18-month trading channel looks like a reasonable upside target.
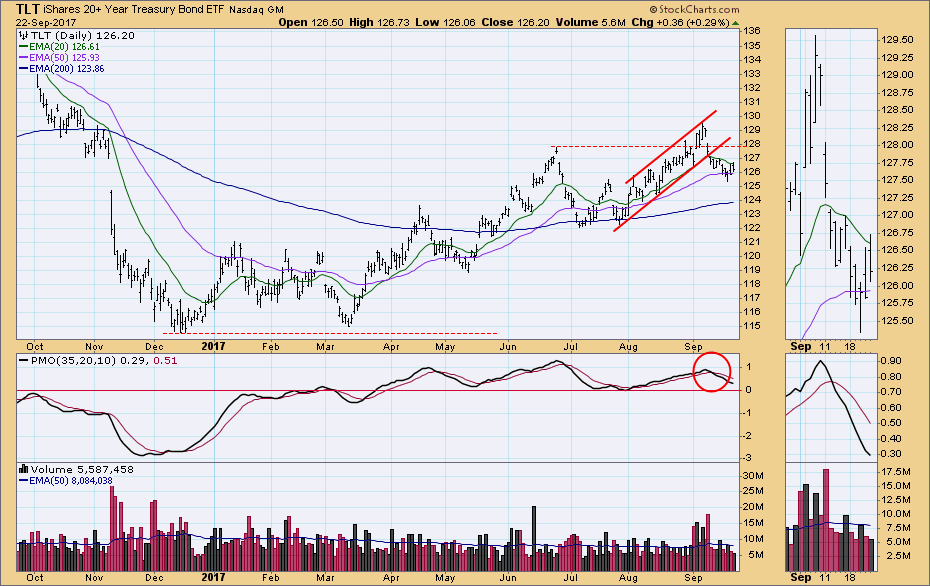
BONDS (TLT)
IT Trend Model: BUY as of 3/31/2017
LT Trend Model: BUY as of 6/16/2017
Last week TLT broke down from a rising trend channel. This week price seemed to find support on the 50EMA.
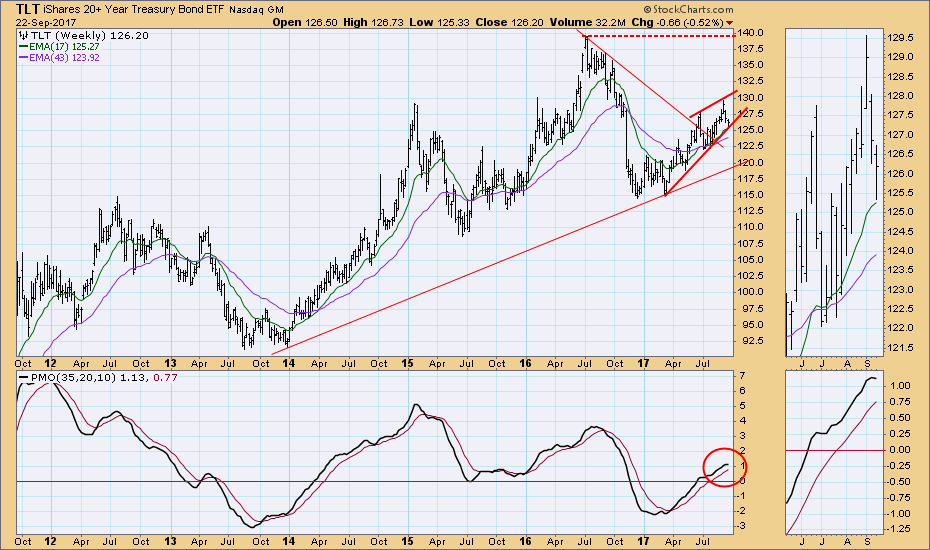
The rising wedge formation is still the dominant feature on the weekly chart. The technical expectation is that the wedge will resolve downward.
**Don't miss any of the DecisionPoint commentaries! Go to the "Notify Me" box toward the end of this blog page to be notified as soon as they are published.**
Technical Analysis is a windsock, not a crystal ball.
Happy Charting!
- Carl
NOTE: The signal status reported herein is based upon mechanical trading model signals, specifically, the DecisionPoint Trend Model. They define the implied bias of the price index based upon moving average relationships, but they do not necessarily call for a specific action. They are information flags that should prompt chart review. Further, they do not call for continuous buying or selling during the life of the signal. For example, a BUY signal will probably (but not necessarily) return the best results if action is taken soon after the signal is generated. Additional opportunities for buying may be found as price zigzags higher, but the trader must look for optimum entry points. Conversely, exit points to preserve gains (or minimize losses) may be evident before the model mechanically closes the signal.
Helpful DecisionPoint Links:
DecisionPoint Shared ChartList and DecisionPoint Chart Gallery
Price Momentum Oscillator (PMO)
Swenlin Trading Oscillators (STO-B and STO-V)
