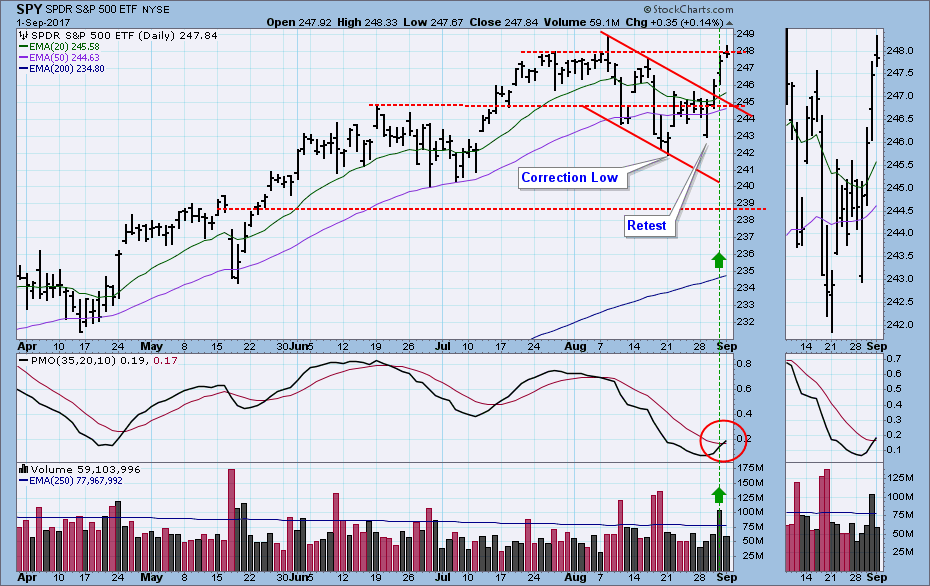
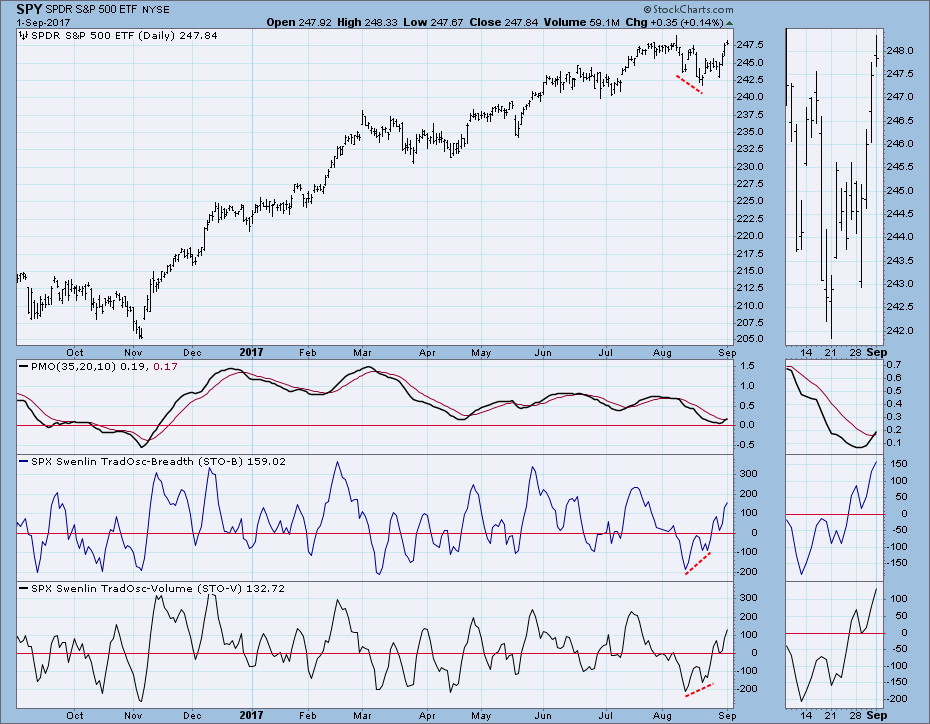
Greg Morris gave us an article on "Fake News!" this week, and it prompted me to reflect on how much "Flood News" we have gotten: Reporters standing in water, reporters standing in front of water, reporters standing in the rain in front of water and in the water. And all the while the stock market paid no attention. The week before last, SPY officially entered a falling trend, and this week on Tuesday we saw a successful retest of the correction low set last week. Then on Wednesday price broke out and left the declining trend channel behind, and Thursday volume expanded as the breakout was extended. Friday the PMO crossed up through its signal line.
The DecisionPoint Weekly Wrap presents an end-of-week assessment of the trend and condition of the stock market (S&P 500), the U.S. Dollar, Gold, Crude Oil, and Bonds.
STOCKS
IT Trend Model: BUY as of 11/15/2016
LT Trend Model: BUY as of 4/1/2016
The only problem with this week's upside reversal is that the resistance at record price highs stopped the advance. I don't see that as an insurmountable problem, just that it may take a bit of consolidation to prepare for the big breakout.
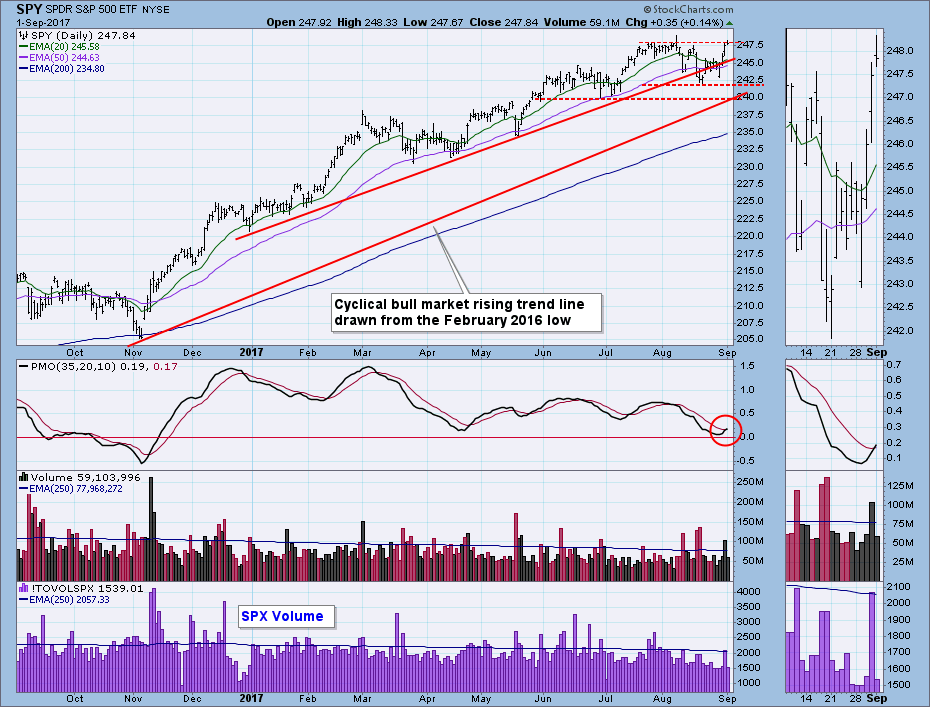
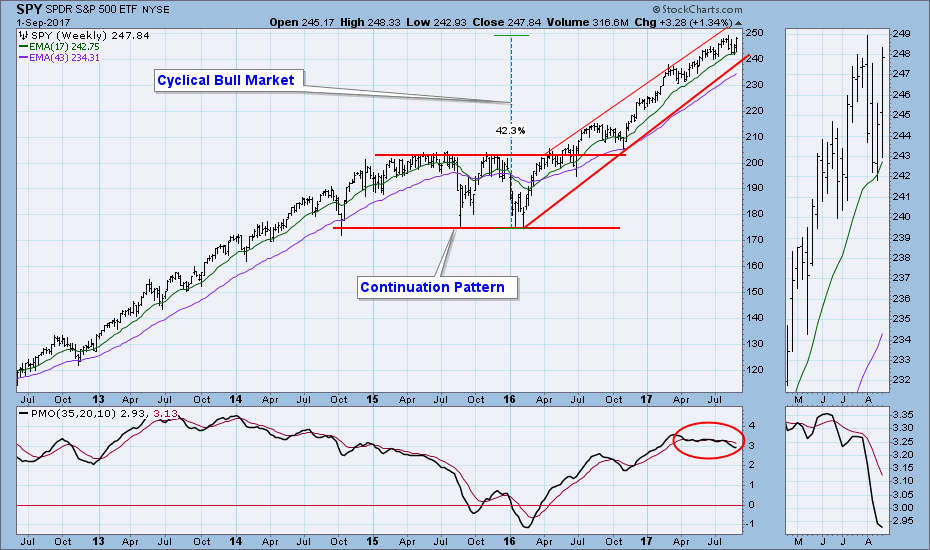
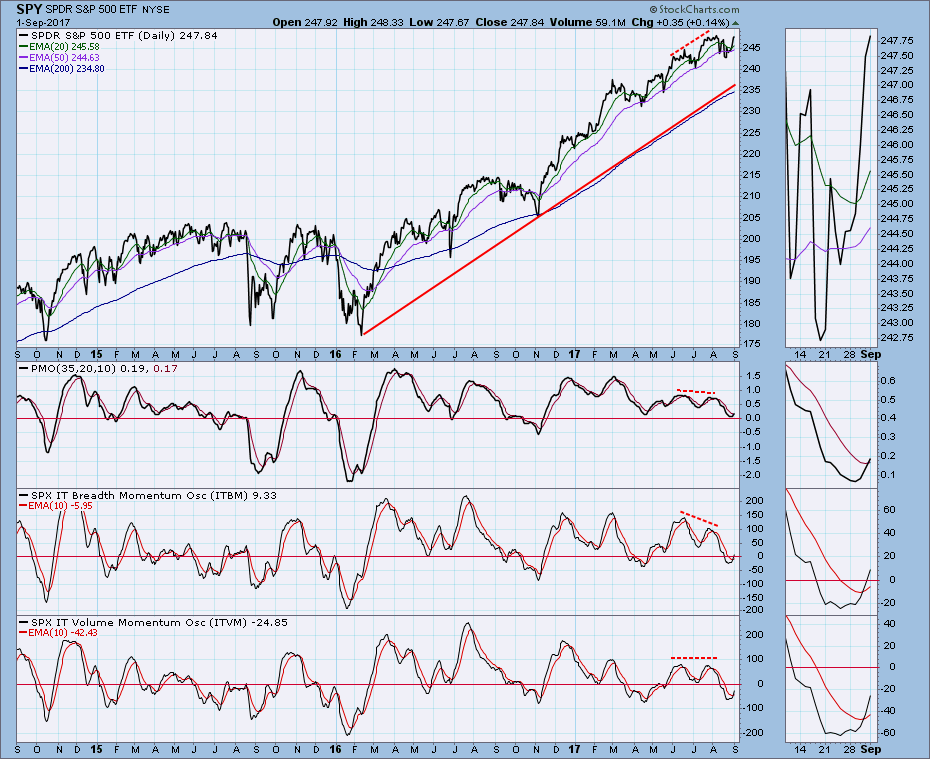
The weekly chart still looks very bullish. There is plenty of room for price to move up within the bull market rising trend channel, and the weekly PMO slowed its descent.
Climactic Indicators: While Thursday's advance was accompanied by heavy volume, there wasn't much of an internal climax. That could be interpreted as good or bad, but for now I will think of it as leaving more room for price to advance before we see higher, blowoff internal readings.
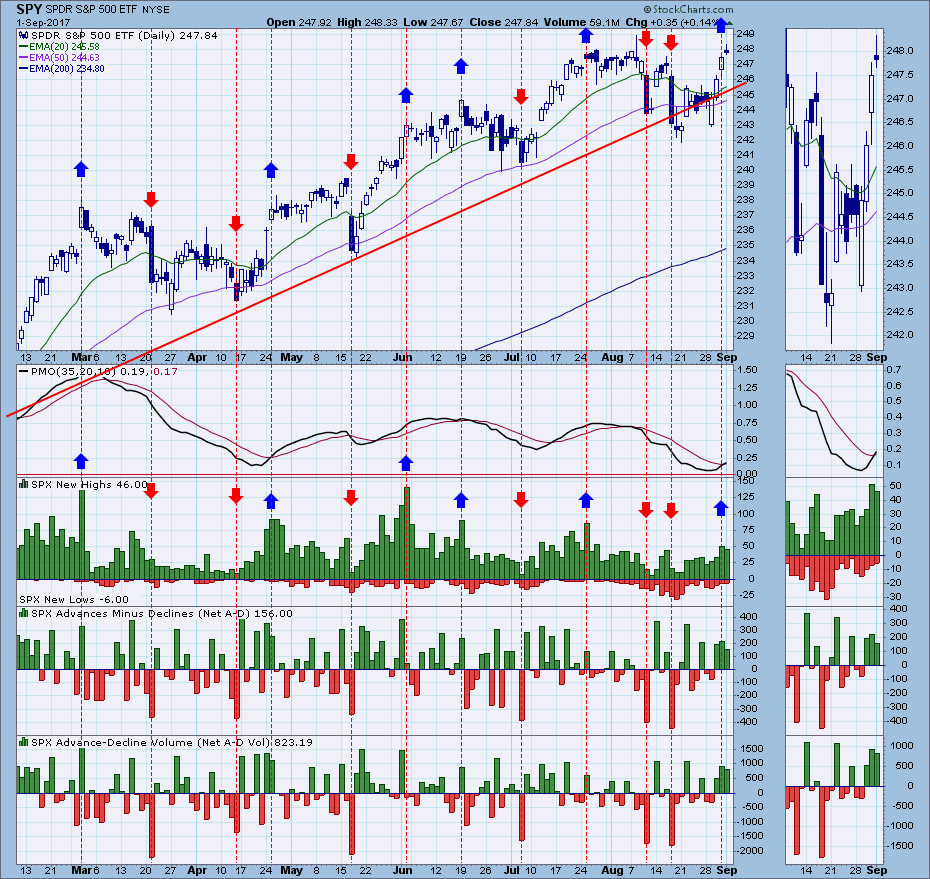
Short-Term Market Indicators: On this chart we can see some classic positive divergences (bullish). This is where price hits a lower low, but indicators make a higher low. In a bull market positive divergences are more likely to be correct than are negative divergences.
Intermediate-Term Market Indicators: Once again these indicators have bottomed at levels that are usually considered neutral, but since the cyclical bull market began, we must consider these readings as oversold. All have crossed up through their signal lines.
Conclusion: The market has broken its short-term down trend and is once again challenging all-time highs. Maybe it will have to churn sideways some more before a decisive breakout takes place, but at this point I am not expecting the August low to be taken out. In fact, I would venture to say that a breakout is not far away. If the correction is in fact over, it has not been a very bad one. On a closing basis only -2.1% was lost, and only -2.9% intraday.
DOLLAR (UUP)
IT Trend Model: NEUTRAL as of 3/21/2017
LT Trend Model: SELL as of 5/24/2017
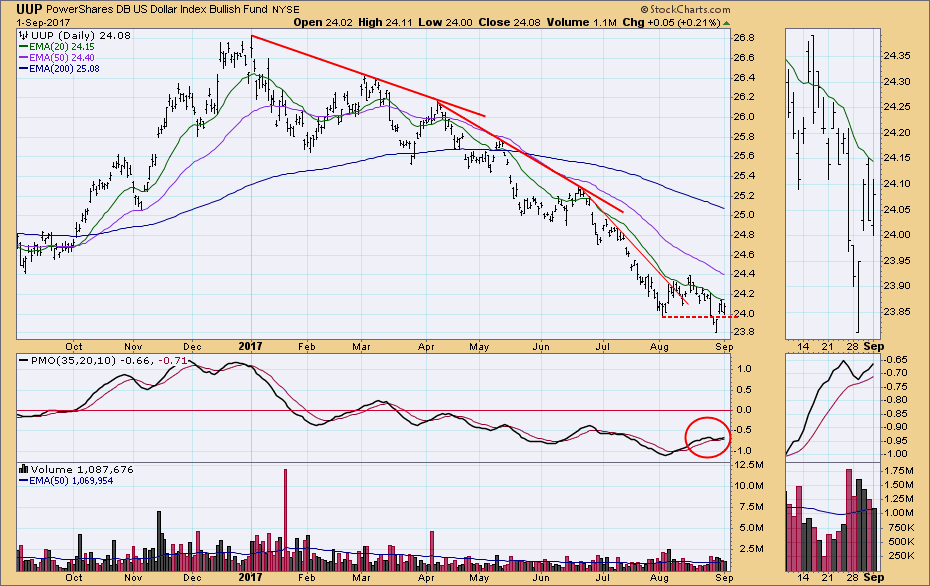
Fake break! UUP broke below the support line drawn across the early-August low on Monday. On Tuesday it seemed to be accelerating to the downside, but price reversed intraday, and the support line was recaptured. The rest of the week, price consolidated above support, and the daily PMO turned up again.
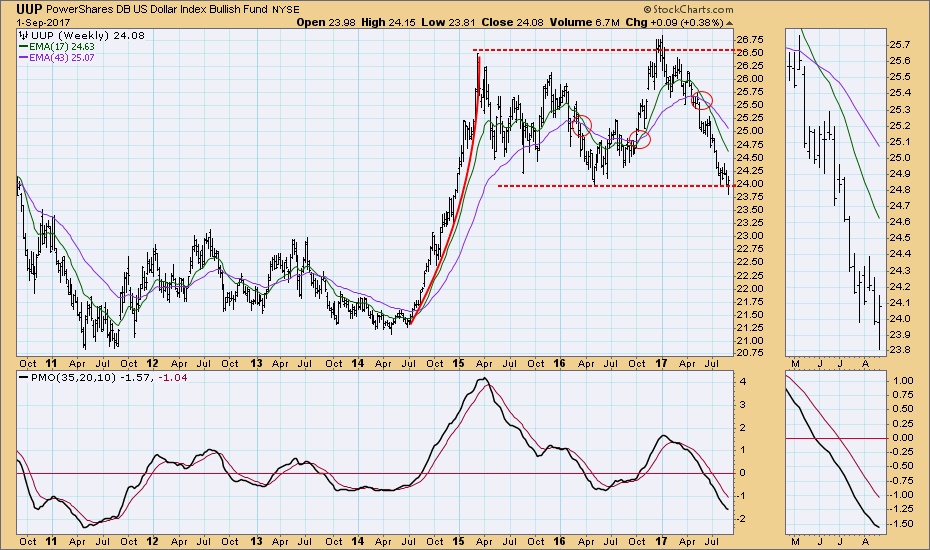
The weekly chart shows how long-term support was briefly violated. The weekly PMO needs to turn up if we are to have confidence that the price decline is over.
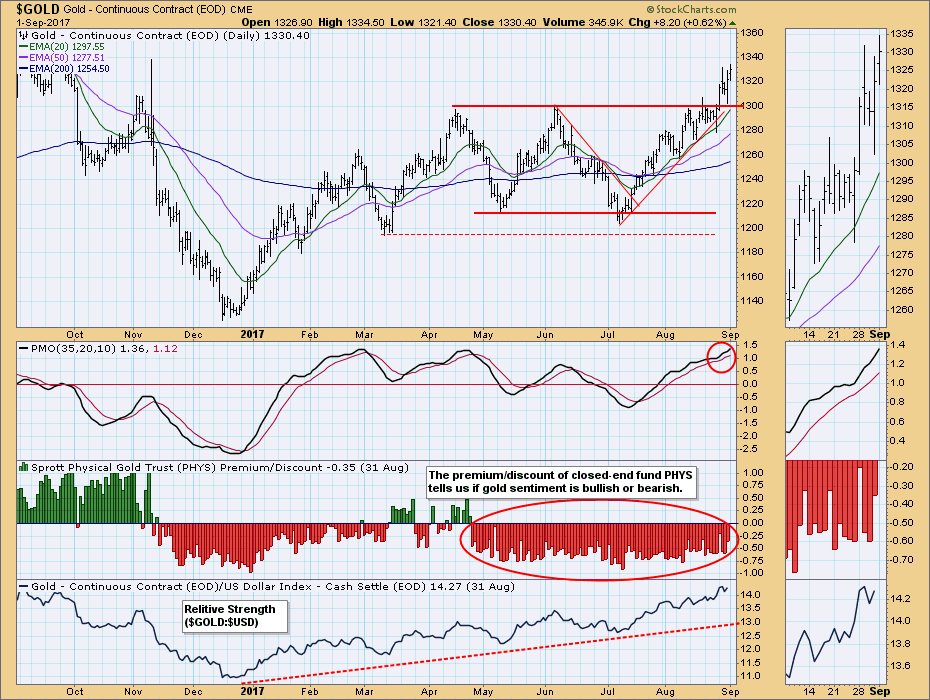
GOLD
IT Trend Model: BUY as of 7/31/2017
LT Trend Model: BUY as of 4/12/2017
This week gold broke out of its five-month trading range, and it managed to hold the gain even though the dollar showed some strength in the short-term. I have added a panel to the chart showing gold's strength relative to the dollar, and that line has been rising since the bear market low. Sentiment remains bearish, which is a drag on the rally. (When sentiment turns bullish, we should see more energy in the rally.)
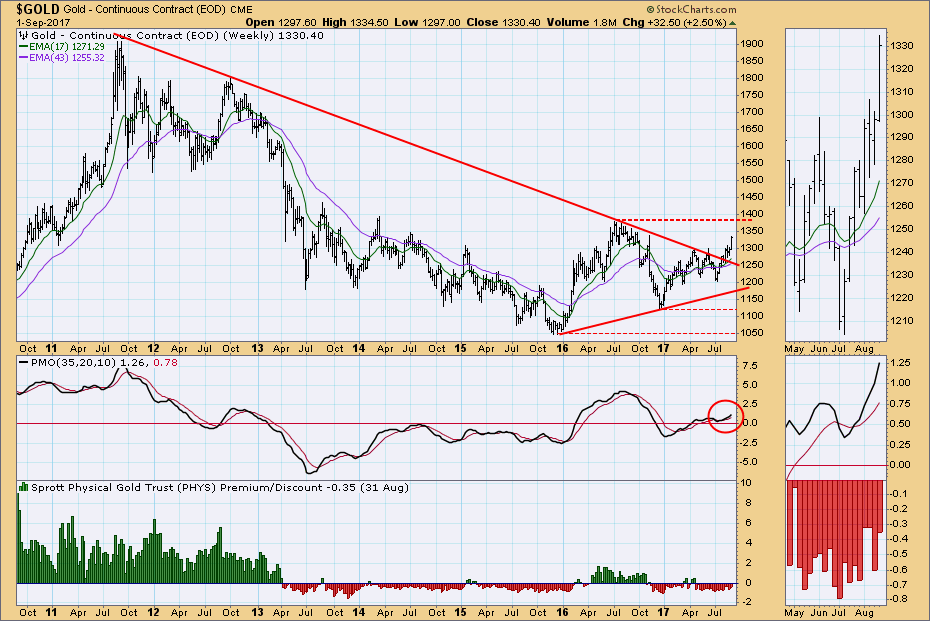
On the weekly chart it looks as if the breakout has really taken hold. The next level of resistance is at about 1390.
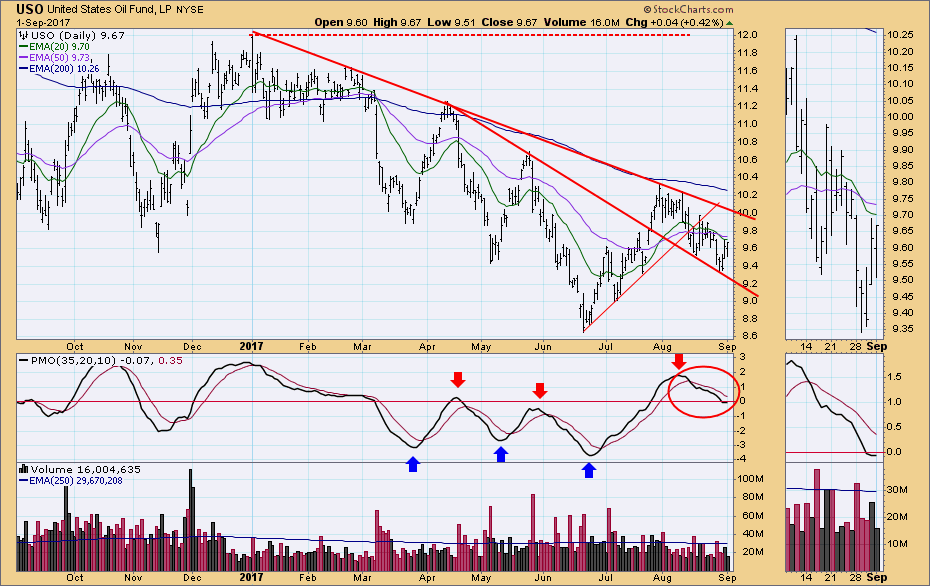
CRUDE OIL (USO)
IT Trend Model: SELL as of 8/29/2017
LT Trend Model: SELL as of 3/9/2017
The declining tops line drawn across the April and May tops served as resistance until USO broke above it in July. Since then, it has been an unusually persistent line of support. Nevertheless, USO has fallen far enough to cause the 20EMA to drop below the 50EMA. This has generated a new IT Trend Model SELL signal on Tuesday.
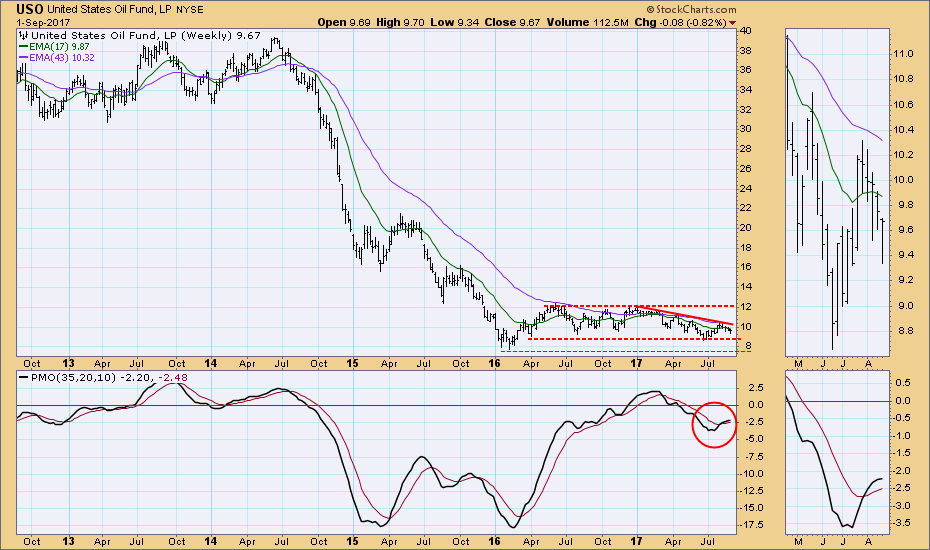
USO is in a down trend, and the weekly PMO is very close to topping, but we can see that price has some room to drop before the bottom of the trading channel is challenged.
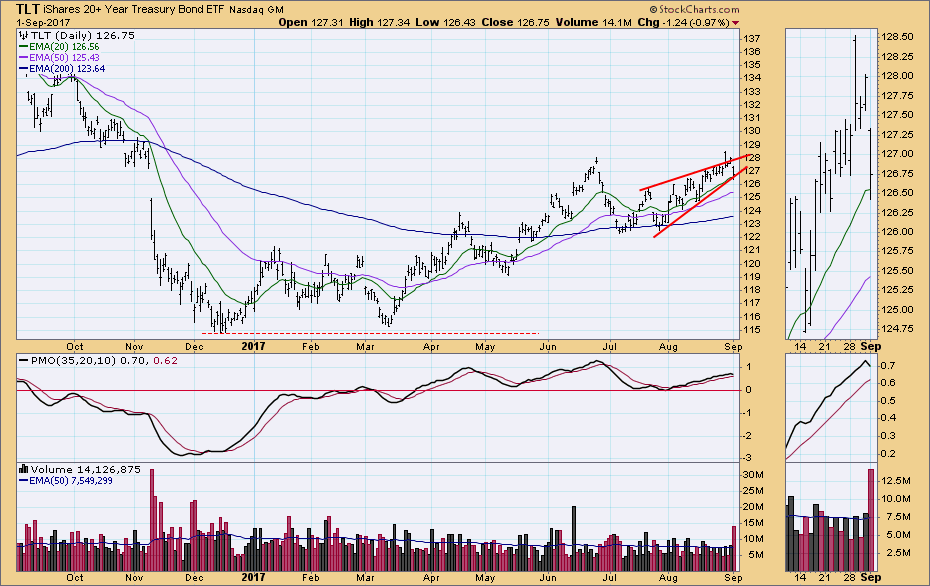
BONDS (TLT)
IT Trend Model: BUY as of 3/31/2017
LT Trend Model: BUY as of 6/16/2017
On Tuesday TLT attempted to break out of the bearish rising wedge formation, but it failed. On Friday it fell back to the bottom of the wedge, but the wedge remains intact. Also on Friday, the daily PMO topped, but the PMO was not rising at a very steep angle, so I give this top less weight than, say, the PMO tops in April and June. The dominant feature on the chart is the rising wedge, so I think the bears win the day in the short-term.
The weekly PMO is rising at a steep angle, and we can see that TLT is well above the declining tops line. This is bullish.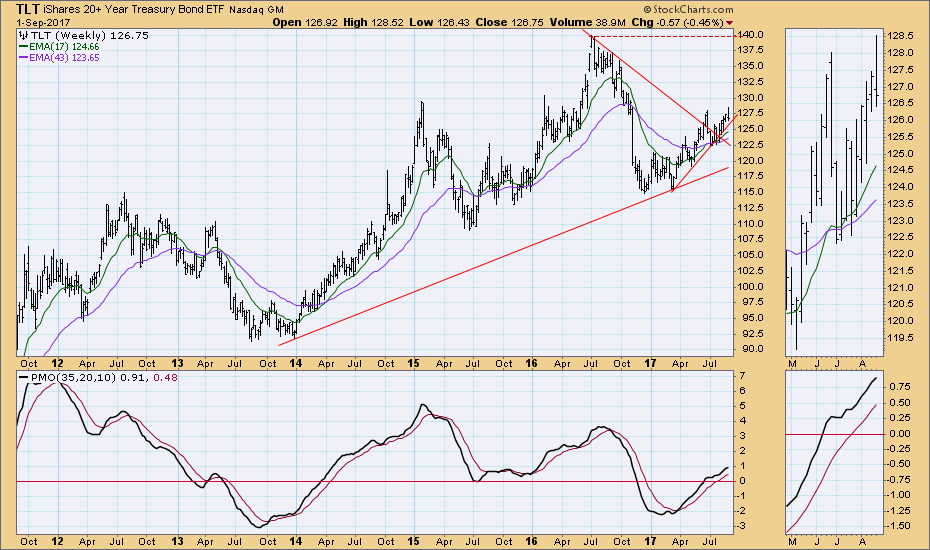
**Don't miss any of the DecisionPoint commentaries! Go to the "Notify Me" box toward the end of this blog page to be notified as soon as they are published.**
Technical Analysis is a windsock, not a crystal ball.
Happy Charting!
- Carl
NOTE: The signal status reported herein is based upon mechanical trading model signals, specifically, the DecisionPoint Trend Model. They define the implied bias of the price index based upon moving average relationships, but they do not necessarily call for a specific action. They are information flags that should prompt chart review. Further, they do not call for continuous buying or selling during the life of the signal. For example, a BUY signal will probably (but not necessarily) return the best results if action is taken soon after the signal is generated. Additional opportunities for buying may be found as price zigzags higher, but the trader must look for optimum entry points. Conversely, exit points to preserve gains (or minimize losses) may be evident before the model mechanically closes the signal.
Helpful DecisionPoint Links:
DecisionPoint Shared ChartList and DecisionPoint Chart Gallery
Price Momentum Oscillator (PMO)
Swenlin Trading Oscillators (STO-B and STO-V)
