 Within the past week, we've seen the $NDX beaten up. However, it really has been the result of a few large-cap stocks that have taken the NDX so low. I think this can be most clearly seen when you compare the equal-weight NDX ETF (QQEW) with the $NDX.
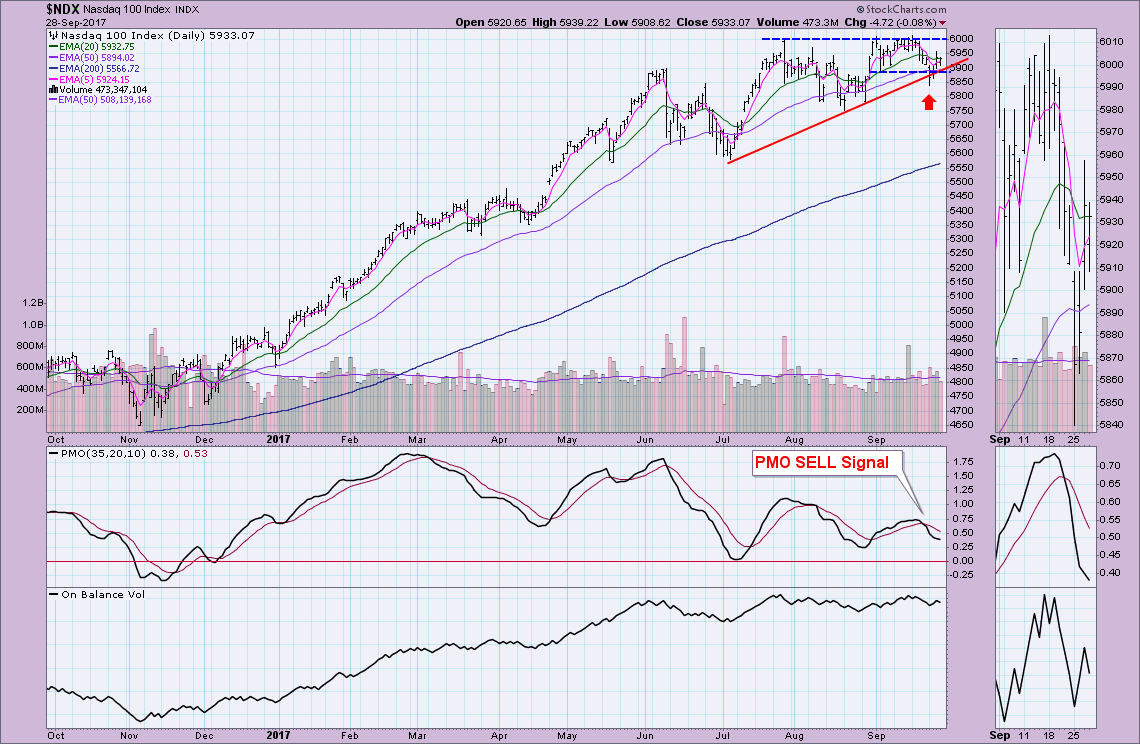
Here is a chart of each the NDX and QQEW. The chart patterns and support are somewhat similar, but the major differences are the ST Trend Model BUY signal and PMO BUY signal. Notice on the NDX chart below that the ST Trend Model is on a Neutral signal and the PMO is on a SELL signal, a SELL signal that should stay intact for another week. The other area of concern for the NDX was the dip below the rising bottoms trendline.
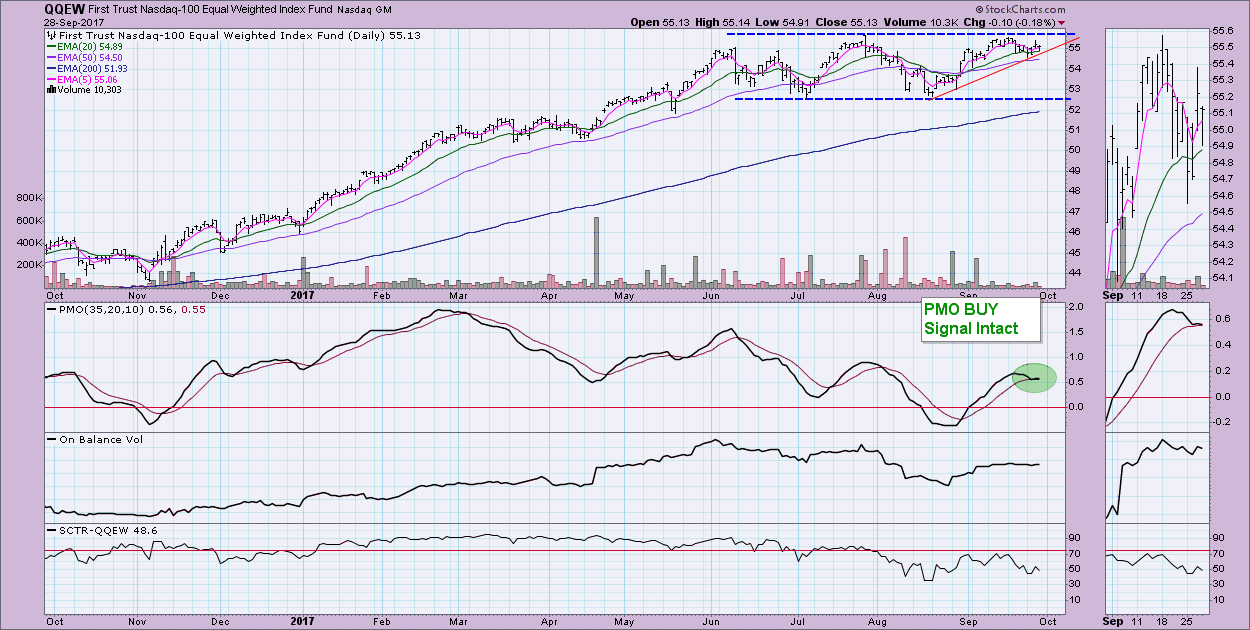
 The differences on the QQEW are many. First rising bottoms support held. Second, the ST Trend Model is on a BUY signal that looks good. The PMO came deathly close to a SELL signal, but it was avoided so the PMO remains above its signal line.
 The reason for these differences comes down to weighting. In the equal-weight QQEW, each member contributes equally to the price while the $NDX is cap-weighted, giving extra weight to the mega-cap members like Apple (AAPL) and Micron (MU). The difference is stark when comparing line charts. What is important to note is that typically, the equal-weight ETFs will get hit harder on declines, but perform better on rallies. In the case of the past month, the QQEW has faired better and that is clearly reflected in its DecisionPoint BUY signals.
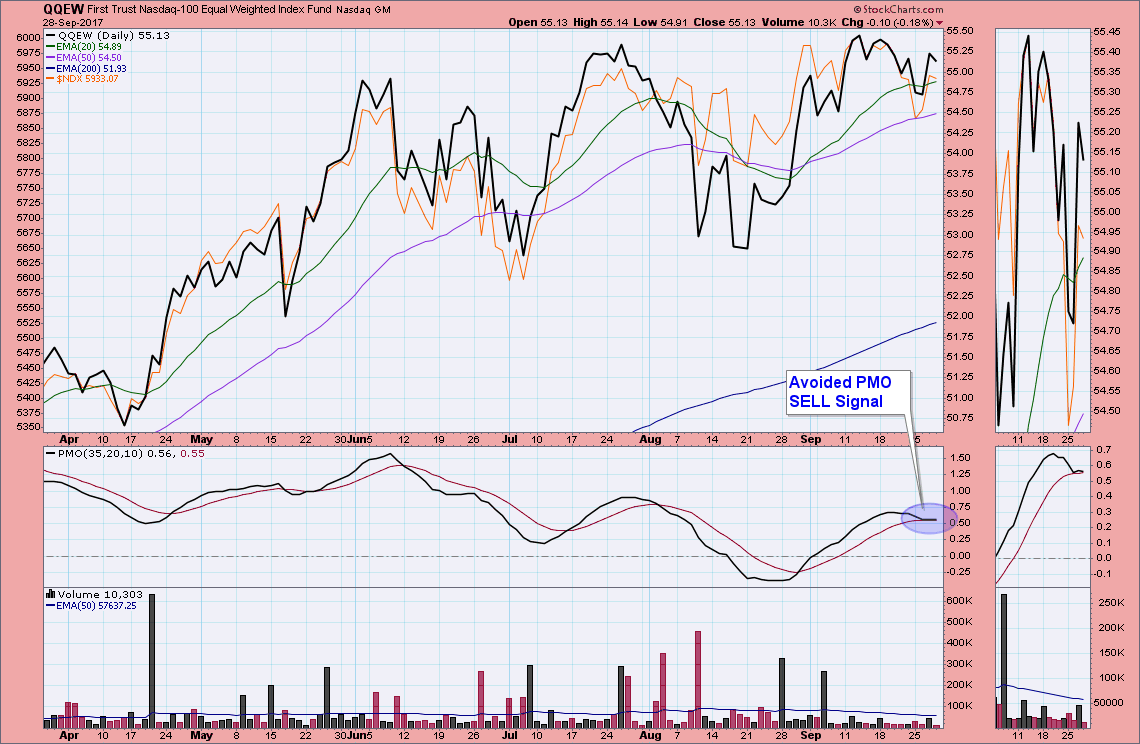 Conclusion: One way to avoid the effects of cap-weighted ETFs like the QQQ which follows the NDX, is to consider equal-weight vehicles. I personally prefer to trade with these ETFs and full disclosure, I currently own the equal-weight Technology ETF (RYT). For more information about the differences between the equal-weight and cap-weight ETFs, you can read an article Carl Swenlin wrote here.
Helpful DecisionPoint Links:
DecisionPoint Shared ChartList and DecisionPoint Chart Gallery
Price Momentum Oscillator (PMO)
Swenlin Trading Oscillators (STO-B and STO-V)
Technical Analysis is a windsock, not a crystal ball.
Happy Charting!
- Erin
**Don't miss DecisionPoint Commentary! Add your email below to be notified of new updates"**
