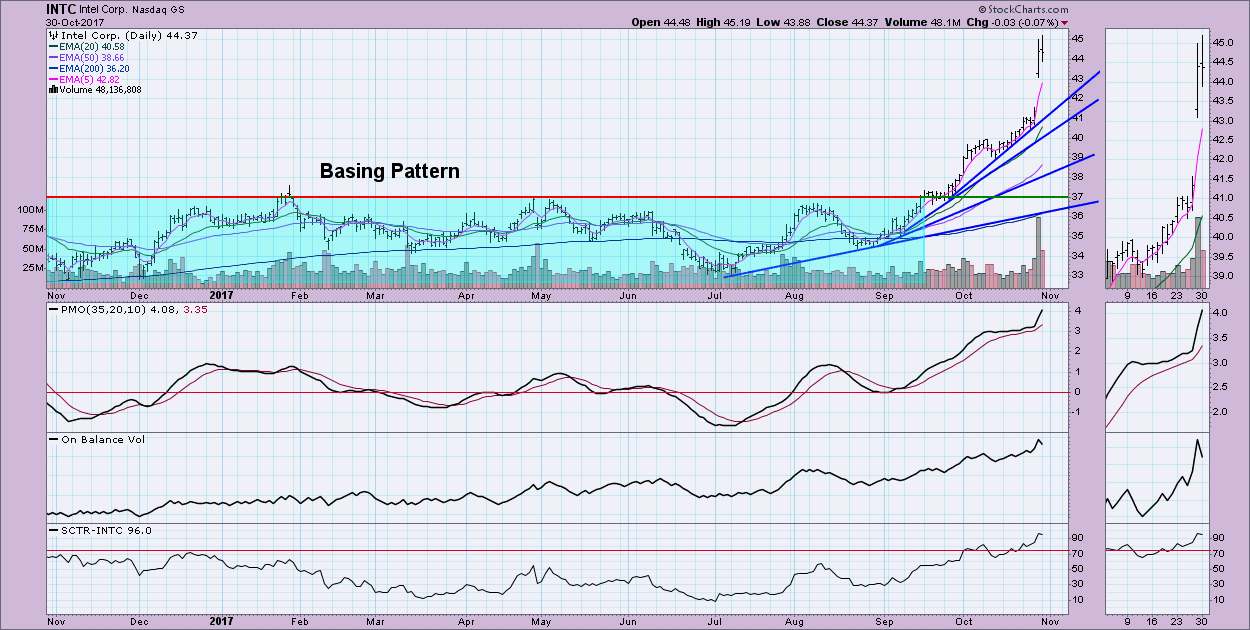
As I was preparing for today's MarketWatchers LIVE broadcast this morning, Tom asked me to take a look at a handful of large cap breakout charts. The one that jumped out at me was that of Intel Corp (INTC). The chart pattern is worrisome. The recent move from its lows around $35 in August to it's close today at $44.37 is characteristic of a parabolic price pattern.
The parabolic or exponential move higher on a chart is fantastic if you were lucky enough to hop on board for the takeoff. However, it's the landing that is the problem with these moves. I've annotated INTC to show you the ever increasing angles of ascent that are a hallmark of a parabolic price pattern. A PMO that points straight at the sky from overbought territory is another hint at a parabolic pattern. The expectation for a parabolic is an exponential rise followed by a quick collapse to the original trading range or basing pattern. For INTC, the collapse would be painful (a drop to $37), but not necessarily devastating.
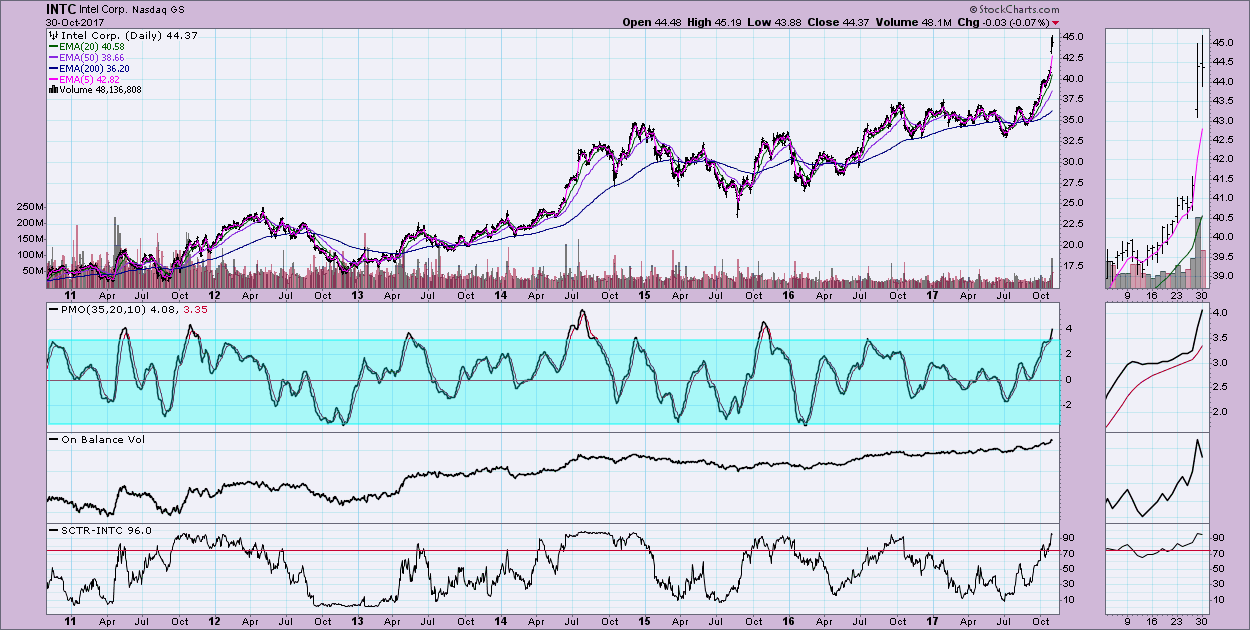
A longer-term daily chart shows that PMO is overbought and reaching readings we haven't seen since the 2015 top and 2014 top. In both cases, when the PMO turned back down, there was a swift price decline. That's what we want to avoid.
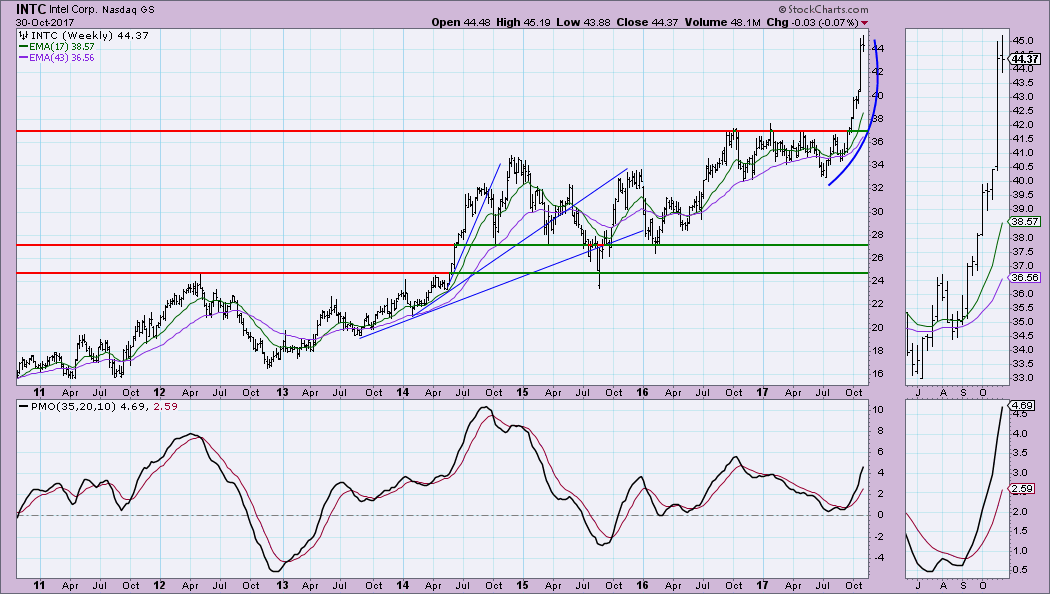
Here is the move on a weekly chart. I have also marked the parabolic rise that marked the first collapse in price around mid-2014. The decline pulled price back to down quickly to what turned out to be a new support level around $27.
The best protection when you're riding a parabolic price move is a trailing stop. I don't typically use trailing stops, but in the case of a parabolic move, I always do. In a parabolic move, you don't see deep pullbacks on the way up, so I don't worry about the stop triggering too soon. When the bottom falls out, the stop has ridden high enough to lock in a great deal of profit before the bottom falls out. The best example I have is Ambarella (AMBA) in 2015. I admit to getting in on the parabolic move and was very much enjoying the ride, but soon I could see that the move was parabolic. The accumulation of this stock was crazy and it was clear that it wasn't a sustainable rally. When it failed...it failed big time. I was fortunate to have that trailing stop in play, it saved me thousands.
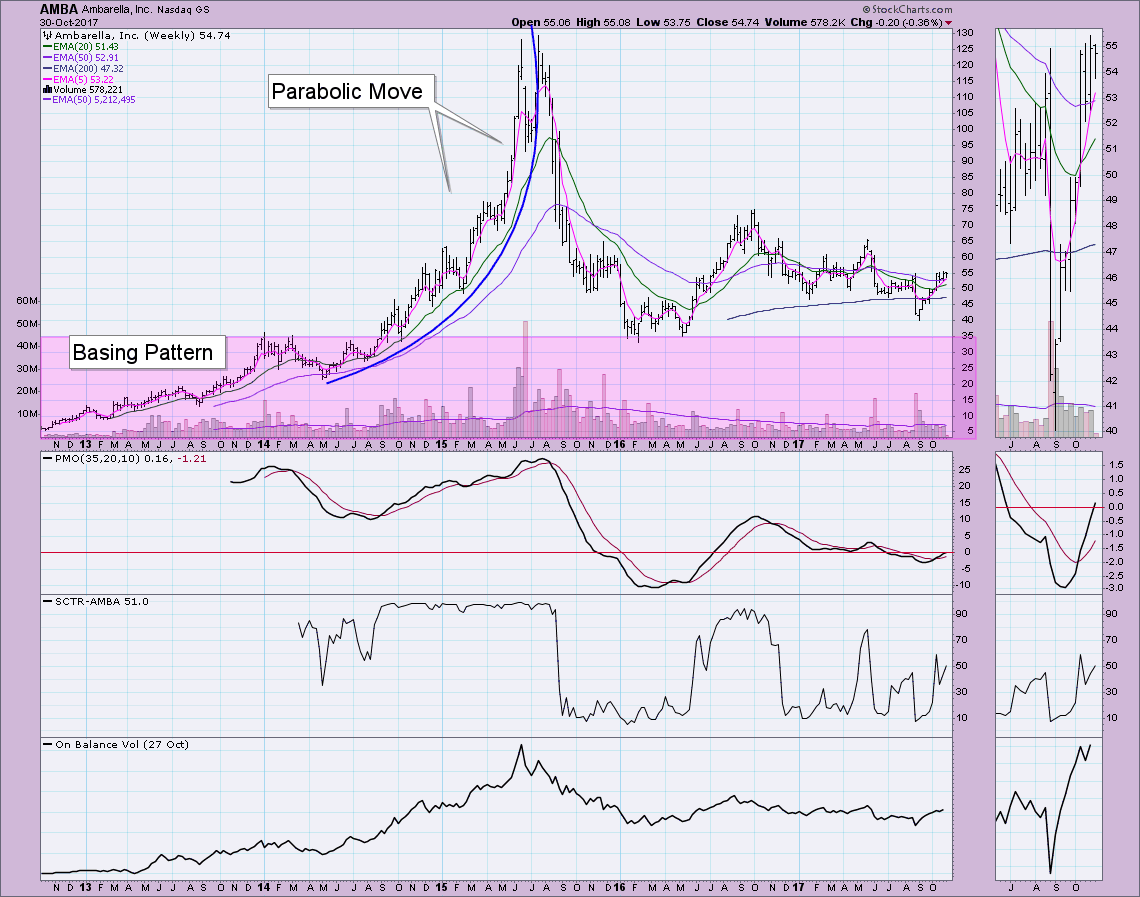
Intel is not an Ambarella right now. A collapse of this parabolic, while costly, is not equal to the degree of AMBA's losses from its failed parabolic. I am just cautioning those along for this ride to pay very close attention; you don't always get much warning before the bottom falls out.
Helpful DecisionPoint Links:
DecisionPoint Shared ChartList and DecisionPoint Chart Gallery
Price Momentum Oscillator (PMO)
Swenlin Trading Oscillators (STO-B and STO-V)
Technical Analysis is a windsock, not a crystal ball.
Happy Charting!
- Erin
**Don't miss DecisionPoint Commentary! Add your email below to be notified of new updates"**
