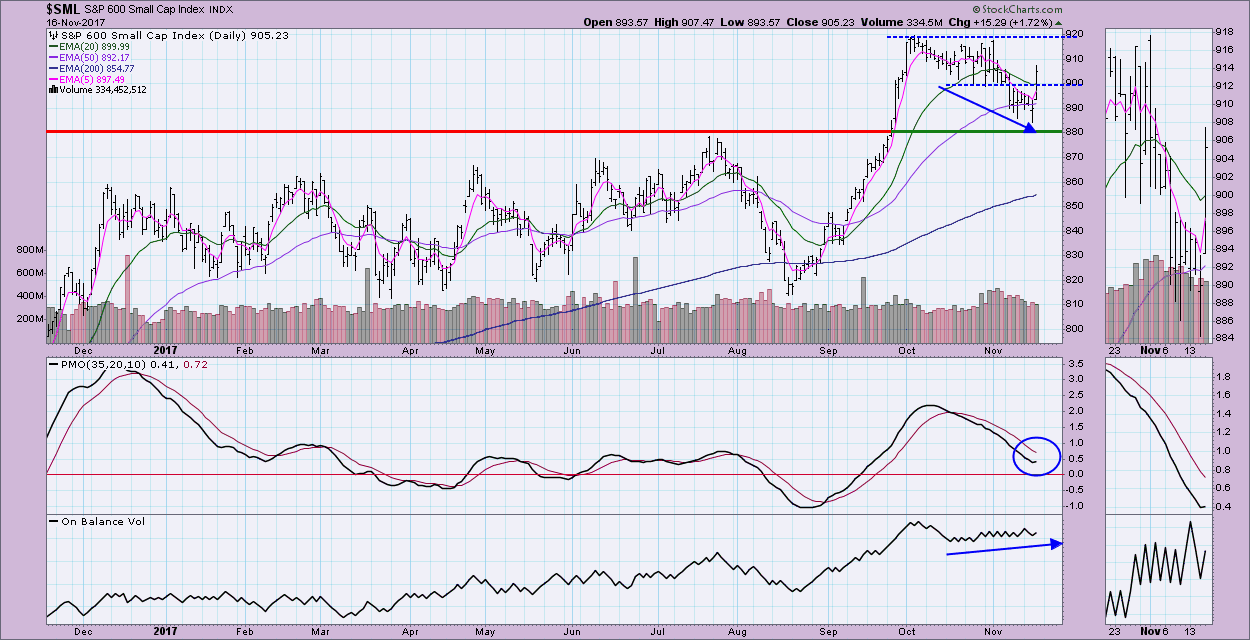
I had this article in the queue yesterday with the headline "S&P 600 Nearing Important Support". Well, it turned out to be a bounce off that support today. Small-caps have been hit hard while most large-cap indexes spent the last month consolidating and moving slightly lower. You could say $SML had a correction over the last month.
Nice thing is that I can use the word "had" when referring to a correction on $SML. Today's rally seems to be the real deal as it not only bounced off support, but also punctured resistance at the late October lows. One thing I was going to note yesterday was that the OBV never really showed any deterioration during this correction and in fact, has set up a nice positive divergence. Today the PMO ticked up, but yesterday it was in decline.
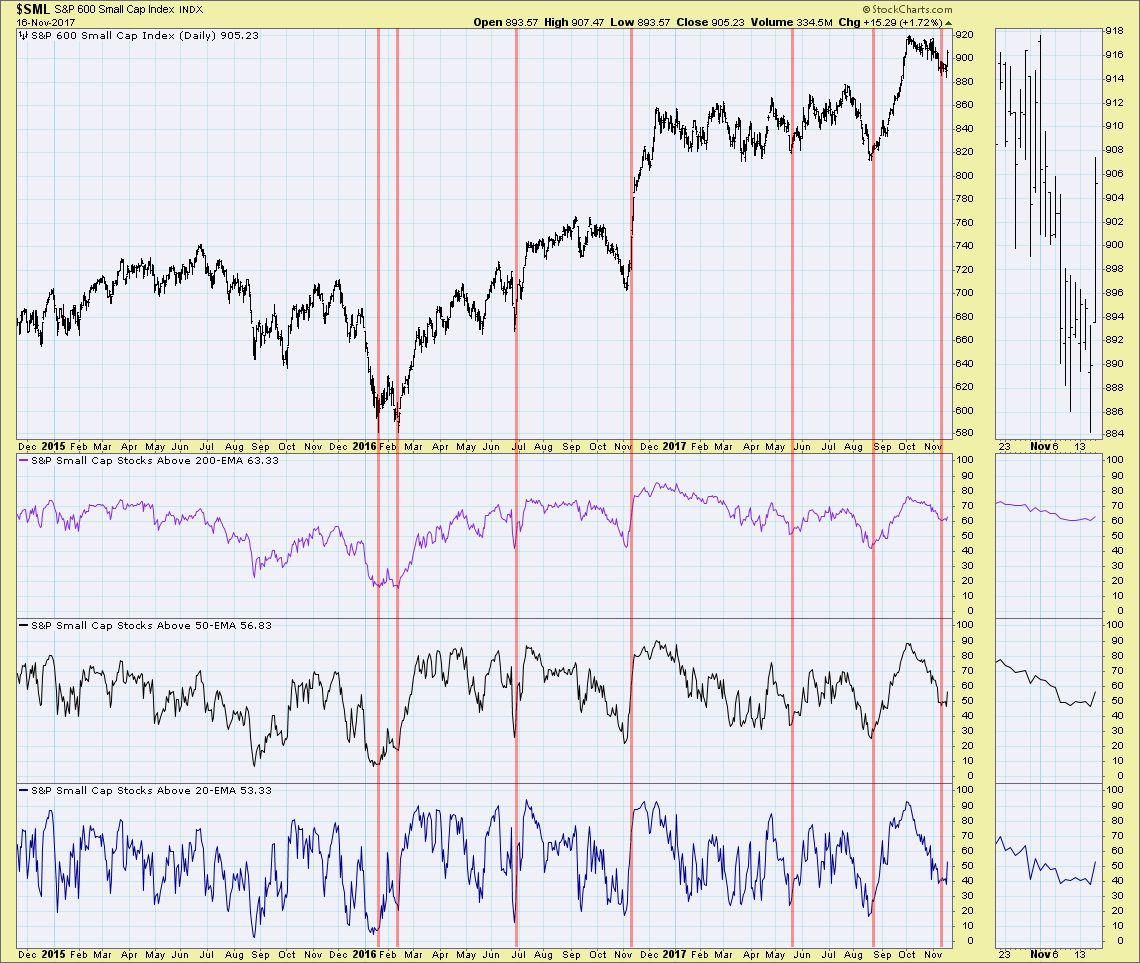
A look at how many stocks in the S&P 600 are above their 20/50/200-EMAs is useful when looking for price bottoms (or tops for that matter). Note that we want to see all three window panes bottoming in oversold territory. This is where we get the best results on possible rallies. We're seeing that now.
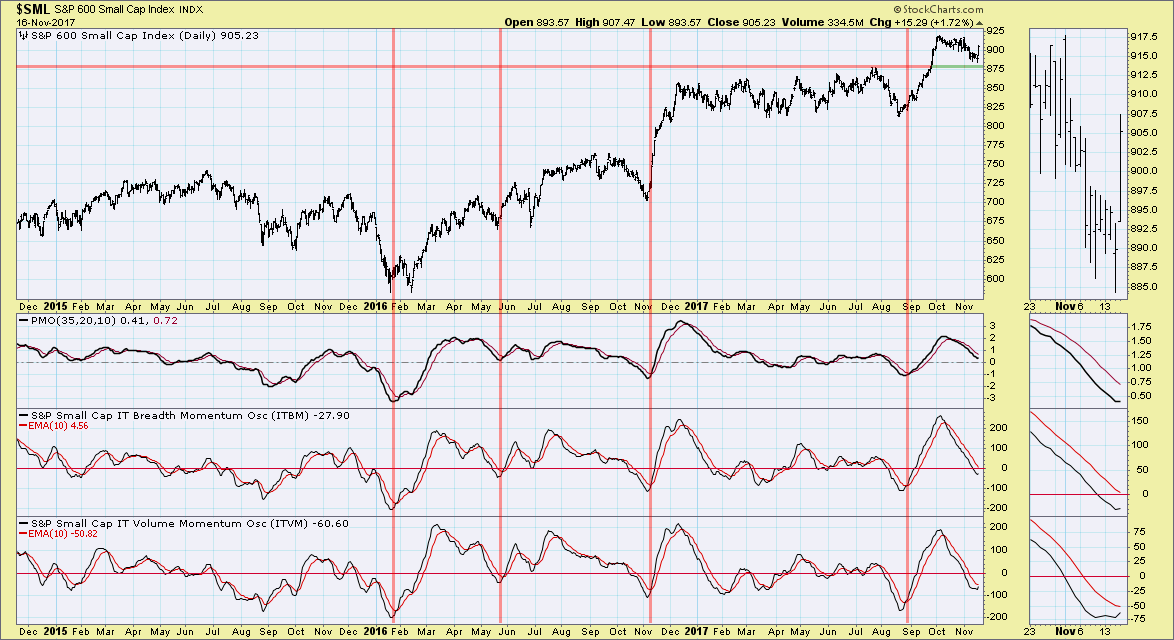
The ITBM and ITVM have both turned up in somewhat oversold territory. I prefer to see positive crossovers, but just seeing these intermediate-term indicators turn up is bullish for $SML.
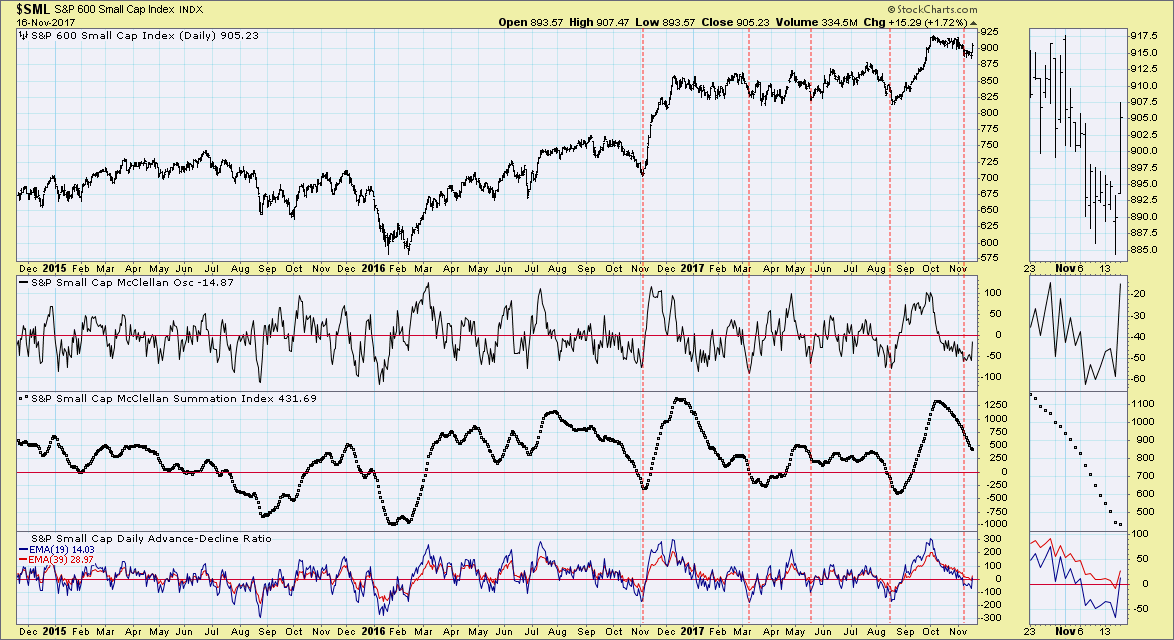
The McClellan Oscillator is now coming out of oversold territory. The Summation Index is decelerating, but hasn't quite turned up yet. I do note that the Summation Index will sometimes take a wee bit longer to turn. Deceleration is good.
Conclusion: Small-caps are ready to rally and the indicators seem to support that the rally should see a continuation into the short and intermediate terms. If you want to see how to create these charts, just click on them and you can review the workbench settings. These are also "ready-made" in the DP Straight Shots ChartPack which is free to Extra members and above.
Helpful DecisionPoint Links:
DecisionPoint Shared ChartList and DecisionPoint Chart Gallery
Price Momentum Oscillator (PMO)
Swenlin Trading Oscillators (STO-B and STO-V)
Technical Analysis is a windsock, not a crystal ball.
Happy Charting!
- Erin
**Don't miss DecisionPoint Commentary! Add your email below to be notified of new updates"**
