
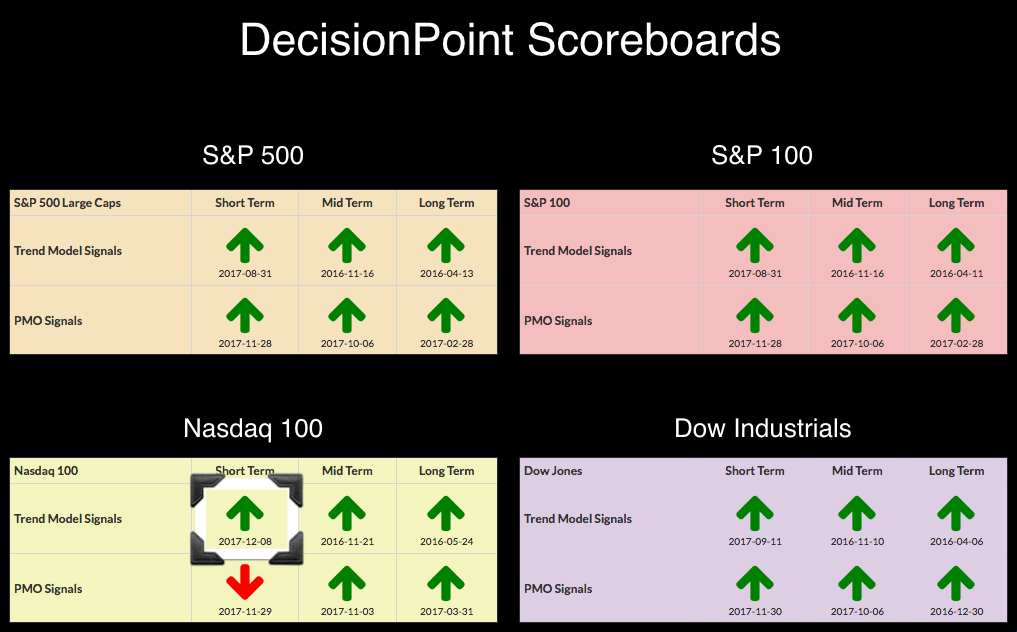
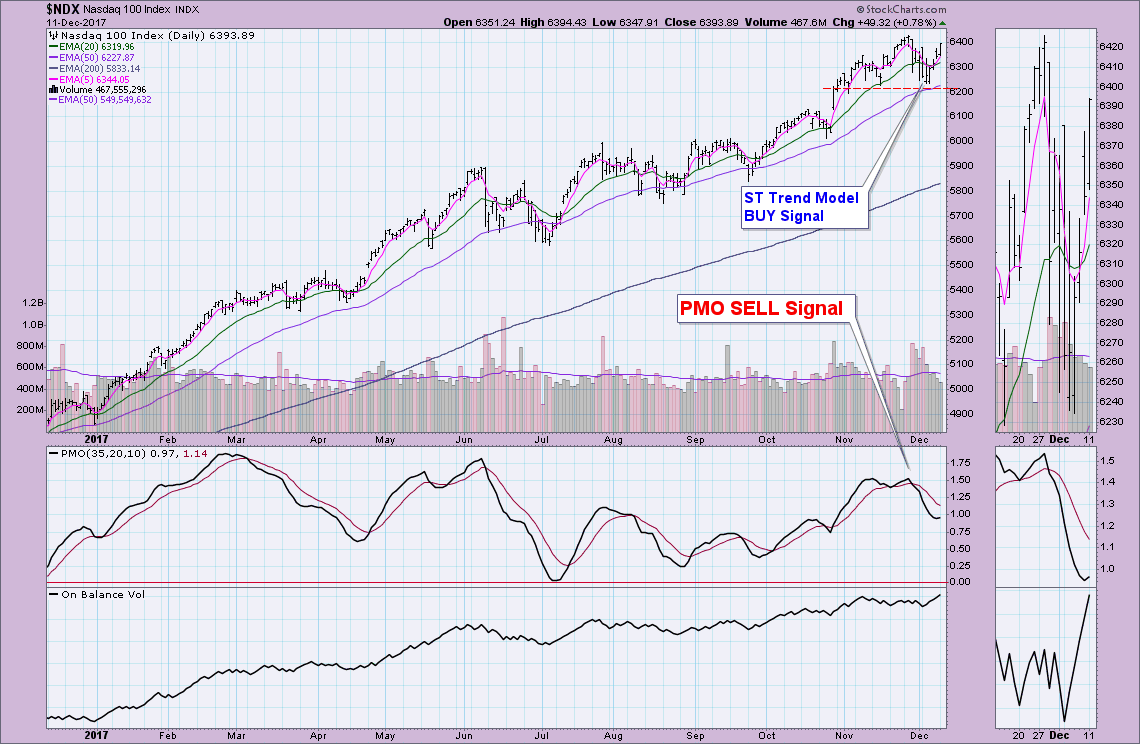
On Friday, the NDX logged a new ST Trend Model BUY signal. Currently DP indicators are looking bullish and seeing improvement in the technology sector is encouraging for the market in general.
I did point out on today's MarketWatchers LIVE show that one could make a case for a head and shoulders formation developing. A few problems with this conclusion..NDX is still in a strong bull market so the effectiveness of a bearish pattern is tilted toward NOT forming. Additionally, it isn't a head and shoulders until it executes and that would require a decline from here and a breakdown below 6200. With price closing near today's high, this looks more like a buying initiation and not an exhaustion. The PMO decided to turn up today too which is bullish.
The purpose of the DecisionPoint Alert Daily Update is to quickly review the day's action, internal condition, and Trend Model status of the broad market (S&P 500), the nine SPDR Sectors, the U.S. Dollar, Gold, Crude Oil, and Bonds. To ensure that using this daily reference will be quick and painless, we are as brief as possible, and sometimes we let a chart speak for itself.
STOCKS
IT Trend Model: BUY as of 11/15/2016
LT Trend Model: BUY as of 4/1/2016
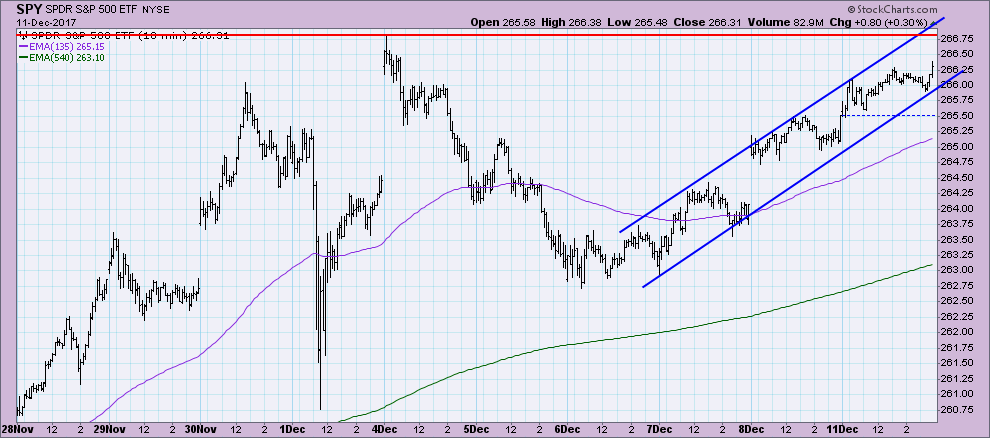
The last three trading days has shown a nice rising trend channel. I'm looking for a test of last week's high.
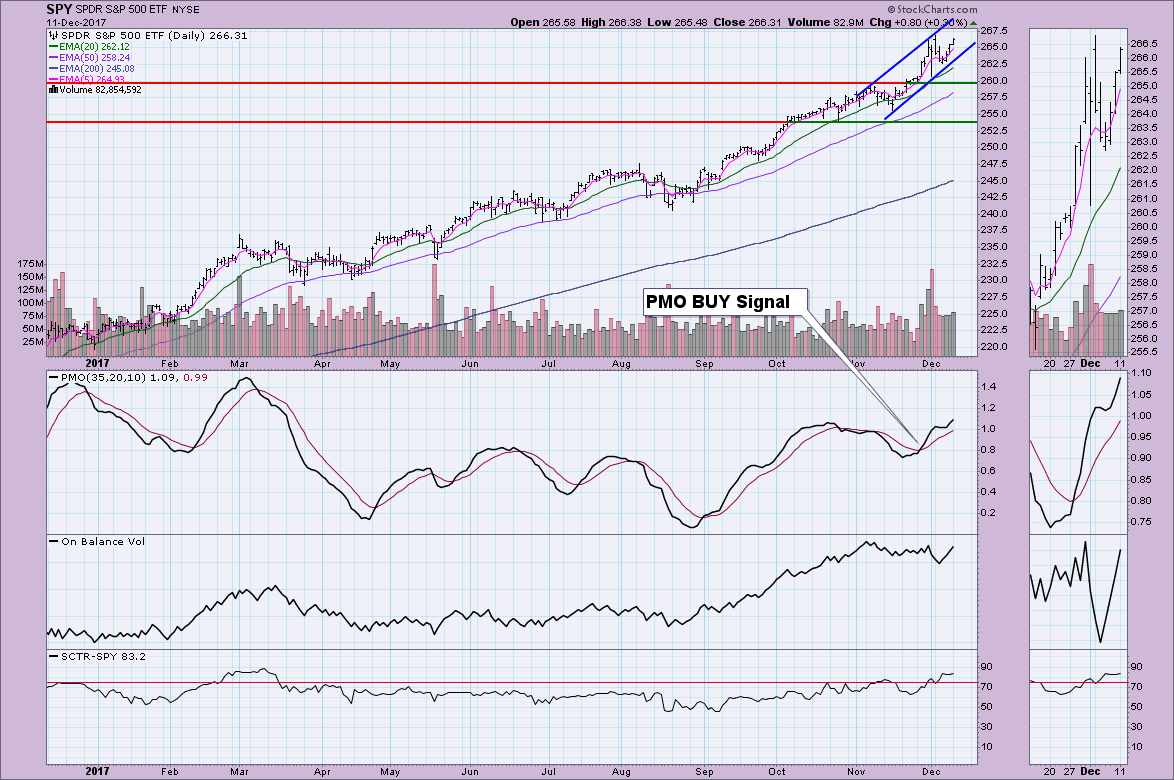
The daily chart also shows a nicely rising trend channel. I was looking at it earlier today and thought it was more of a bearish rising wedge, but since annotating it this afternoon, it's a rising trend channel. The chart is bullish across the board. Nice volume and the PMO has now accelerated higher.
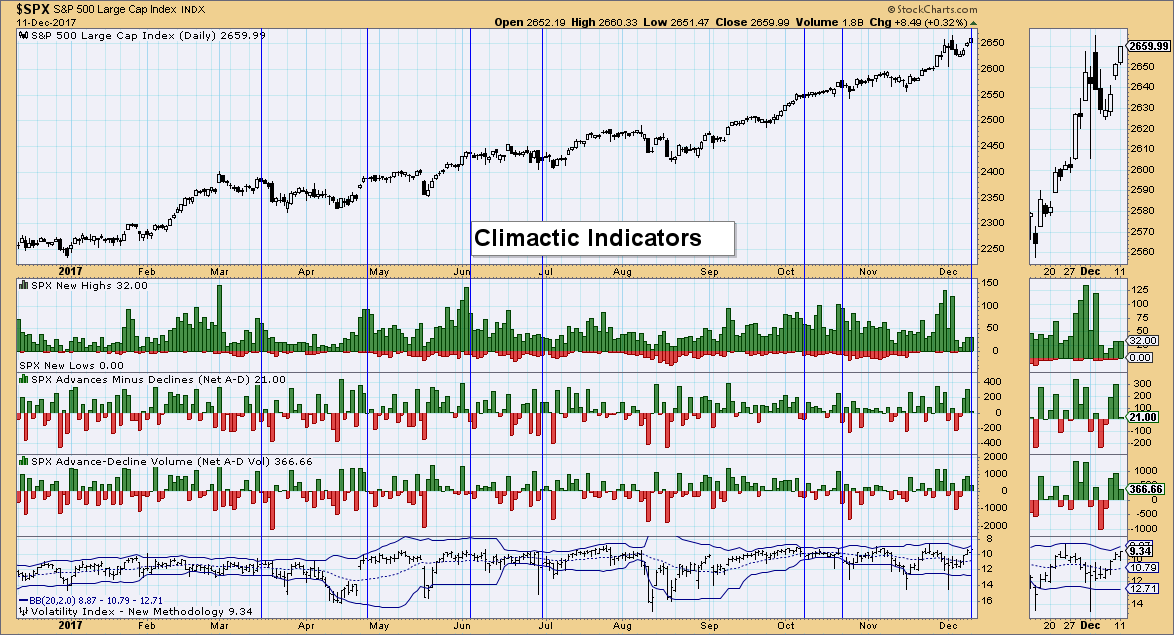
Climactic Indicators: The VIX is flirting with the top of the Bollinger Band. If we get a penetration of that band, I would look for a pullback in price. Breadth didn't do much today, so ultimately the VIX is the one to watch over the next day or two.
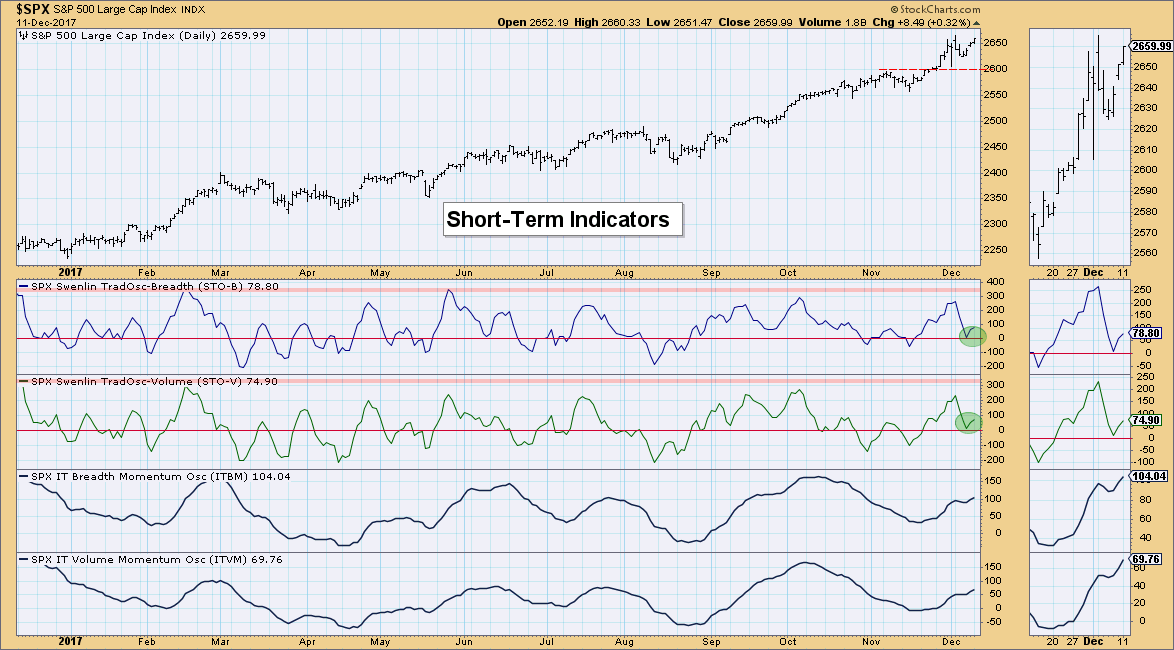
Short-Term Indicators: I love seeing these indicators bottom above the zero line, it suggests internal strength. They did decelerate somewhat, but they look great given they have plenty of room to the upside for them to travel before reaching overbought levels.
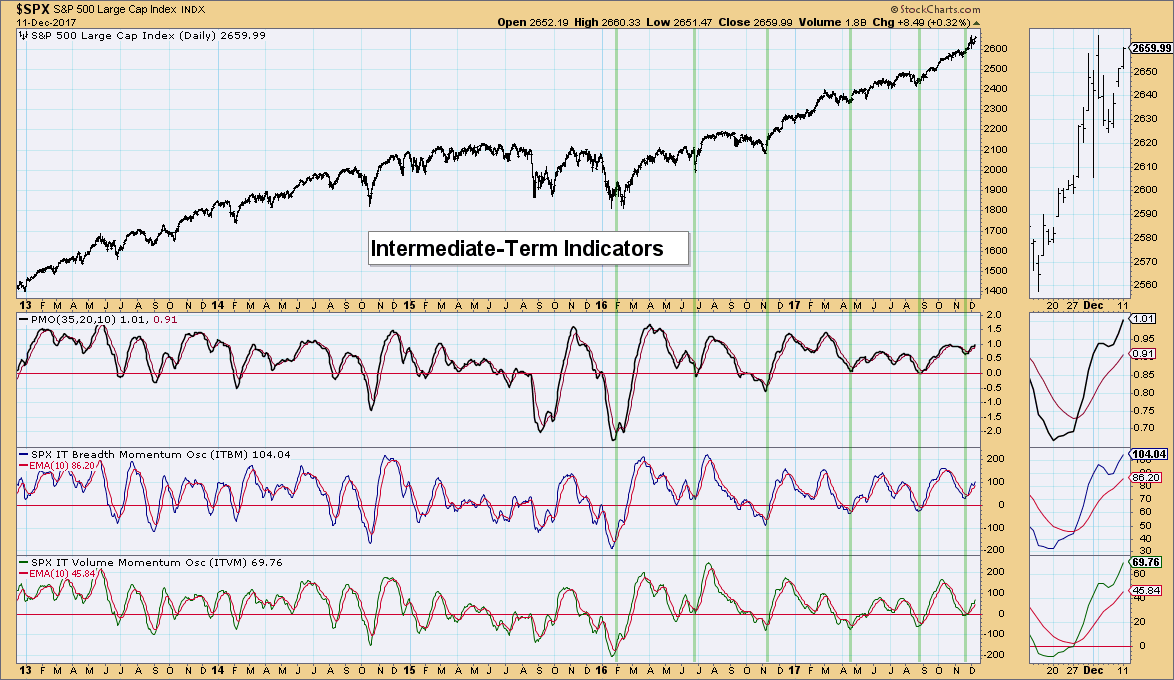
Intermediate-Term Indicators: You may have noted on the chart above that the ITBM and ITVM are rising again. As I mentioned in my last DP Alert, don't get wrapped around these indicators topping. What is most important is what they do in relation to their signal lines. This dip was good in that it should keep readings from getting overbought as quickly.
Conclusion: Indicators are looking good, although we aren't seeing much on the climactic indicators. For very short-term traders, pay attention to the VIX, if we get a penetration of the upper Bollinger Band, the market will likely take a step back. Overall the SPX looks healthy and the NDX is improving its health. Critical for the NDX is a PMO BUY signal and the negation of a possible head and shoulders pattern.
DOLLAR
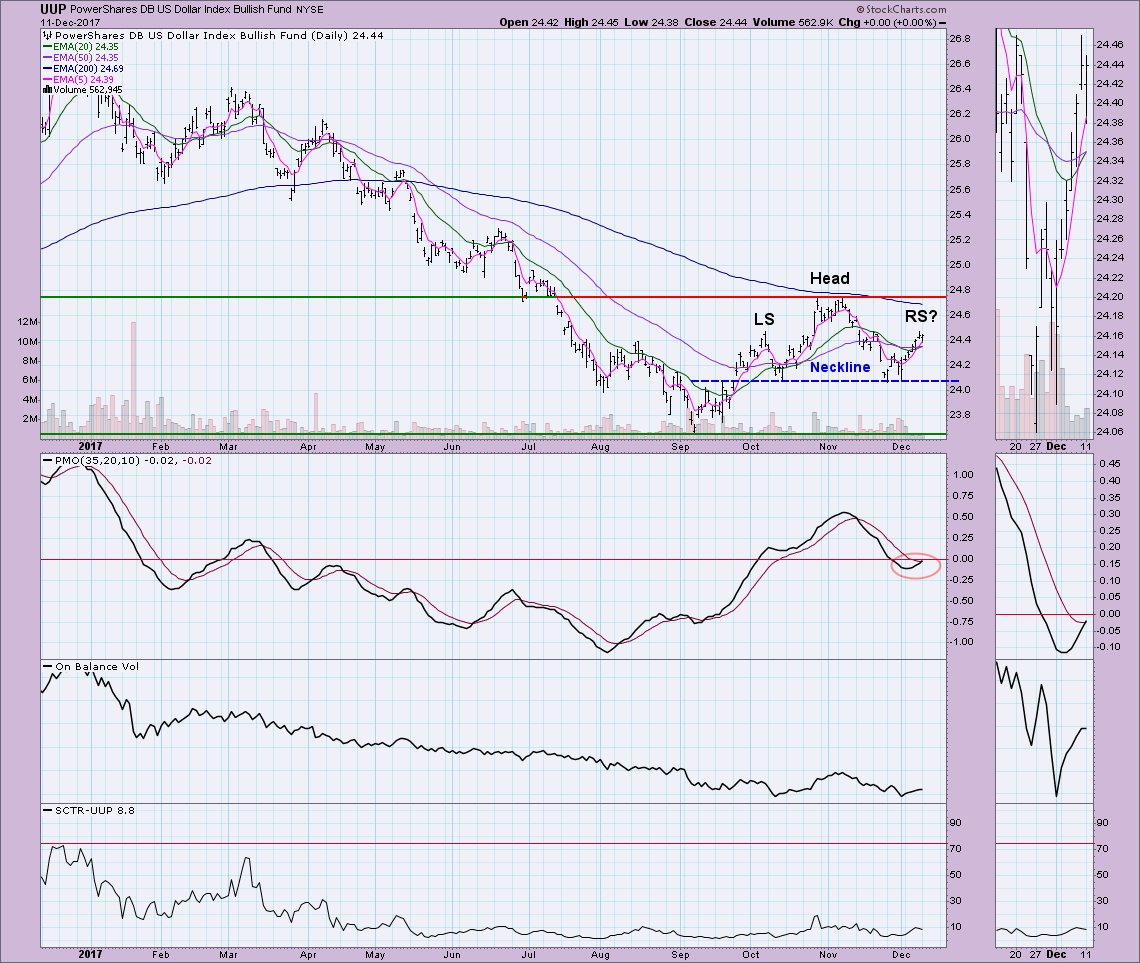
IT Trend Model: SELL as of 11/30/2017
LT Trend Model: SELL as of 05/24/2017
UUP is currently in a bear market configuration (50-EMA < 200-EMA) so the development of a bearish head and shoulders pattern should raise some eyebrows. I doubt this pattern will form or execute given the new PMO BUY signal and pending IT Trend Model BUY signal. More likely we will see a move toward overhead resistance around $24.75 followed by a breakout. So despite having annotated a bearish pattern, the indicators are telling me to ignore it.
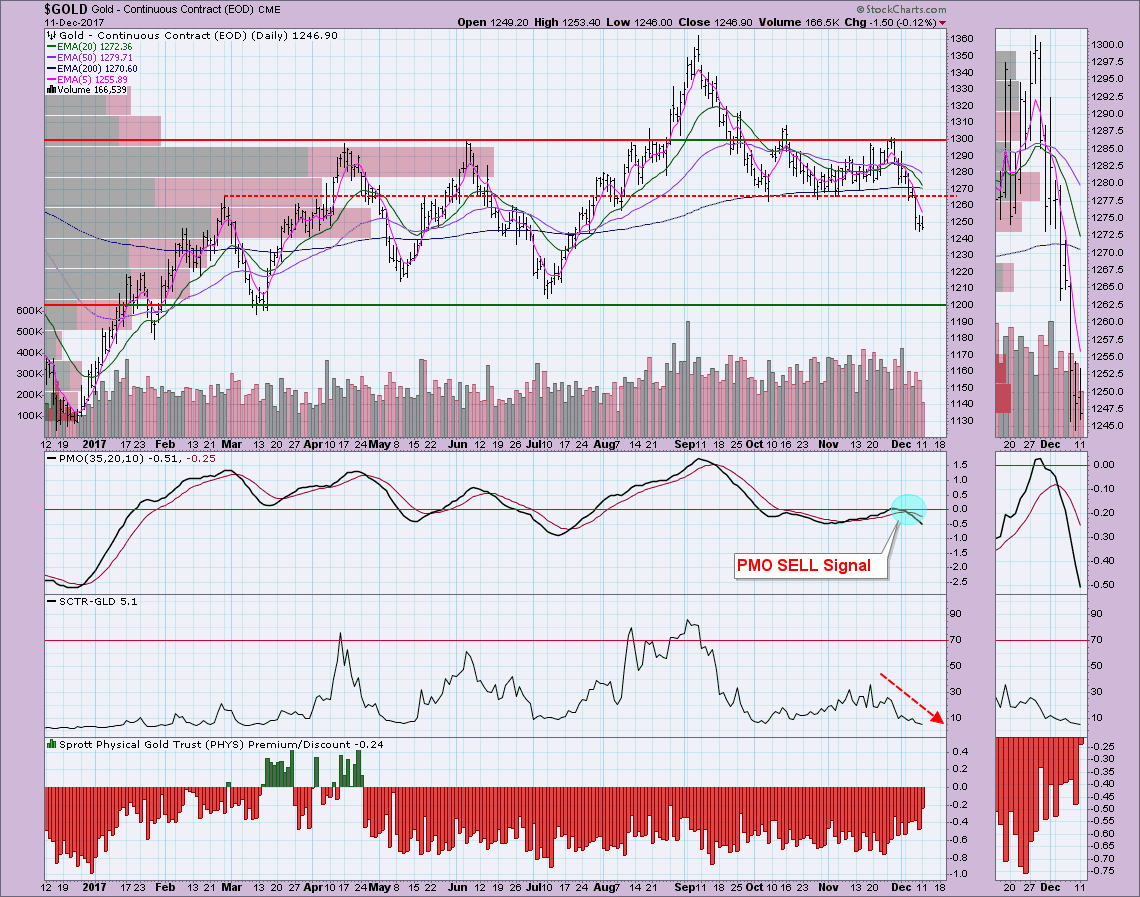
GOLD
IT Trend Model: NEUTRAL as of 10/20/2017
LT Trend Model: BUY as of 4/12/2017
On the other hand and not too surprising, Gold broke down and is now forming a likely reverse flag continuation pattern. Using volume by price bars, we can see that price is right on the 2nd largest bar. This can be considered support. If this bear flag executes, that would bring Gold prices below that level and would then likely would continue lower to test the 1200 area. The PMO SELL signal along with a declining SCTR and not nearly deep enough discounts on $PHYS, I am expecting a breakdown and move to 1200.
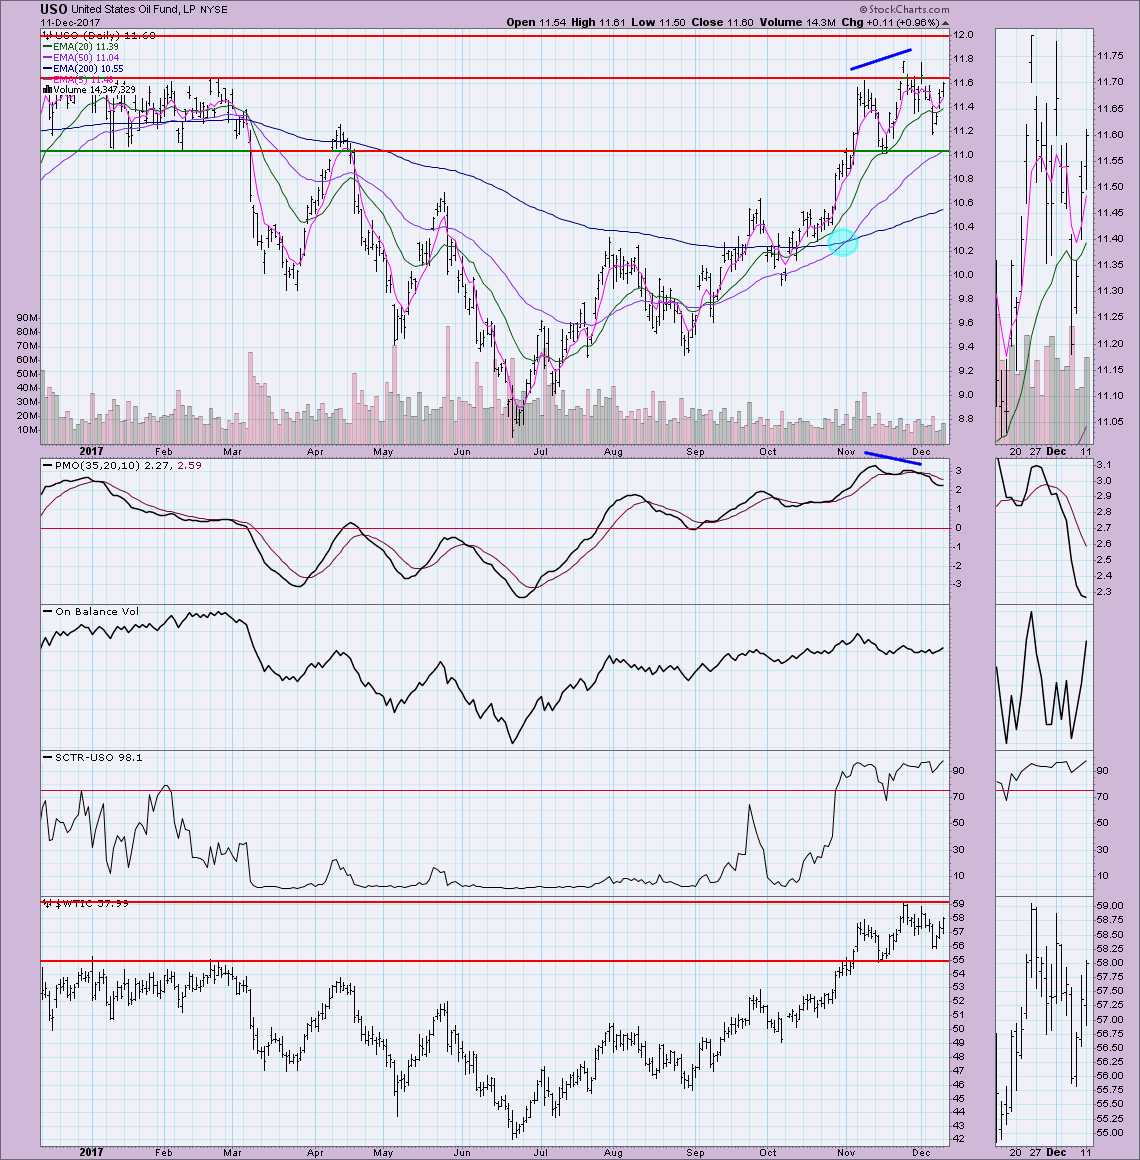
CRUDE OIL (USO)
IT Trend Model: BUY as of 11/2/2017
LT Trend Model: BUY as of 9/7/2017
The PMO negative divergence executed and price is now rallying back toward last month's high. The PMO is decelerating, but looking at the price of Oil ($WTIC), there is more room to rise before hitting overhead resistance. This leads me to believe that the current resistance level at $11.60 will be broken to the upside.
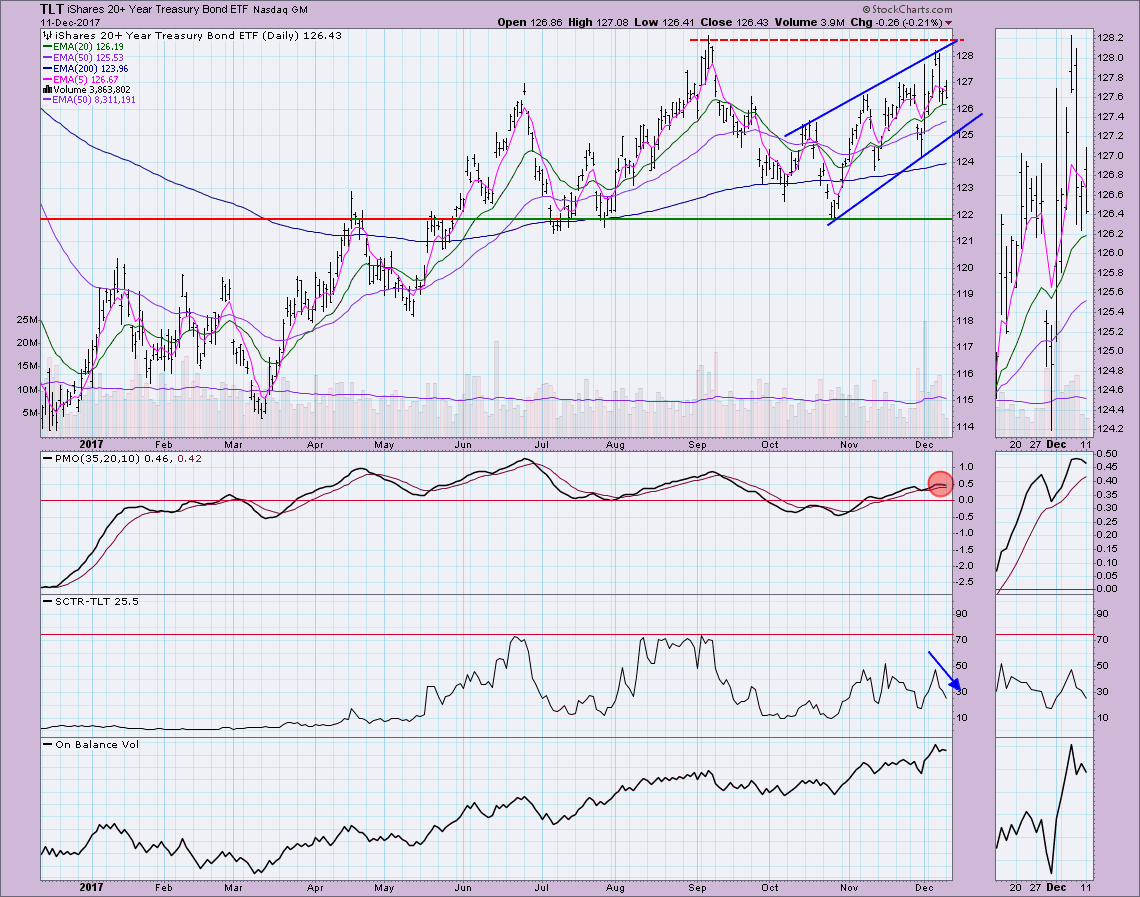
BONDS (TLT)
IT Trend Model: BUY as of 11/8/2017
LT Trend Model: BUY as of 6/16/2017
TLT is forming a large rising wedge which is a bearish pattern. I'd been considering an intermediate-term head and shoulders, but with price nearly reaching the head, I gave up on that pattern. However, if this wedge executes that would suggest a test of the $122 level. A topping PMO in overbought territory is a problem, as is the declining SCTR.
Helpful DecisionPoint Links:
DecisionPoint Shared ChartList and DecisionPoint Chart Gallery
Price Momentum Oscillator (PMO)
Swenlin Trading Oscillators (STO-B and STO-V)
Technical Analysis is a windsock, not a crystal ball.
Happy Charting!
- Erin
**Don't miss DecisionPoint Commentary! Add your email below to be notified of new updates"**
