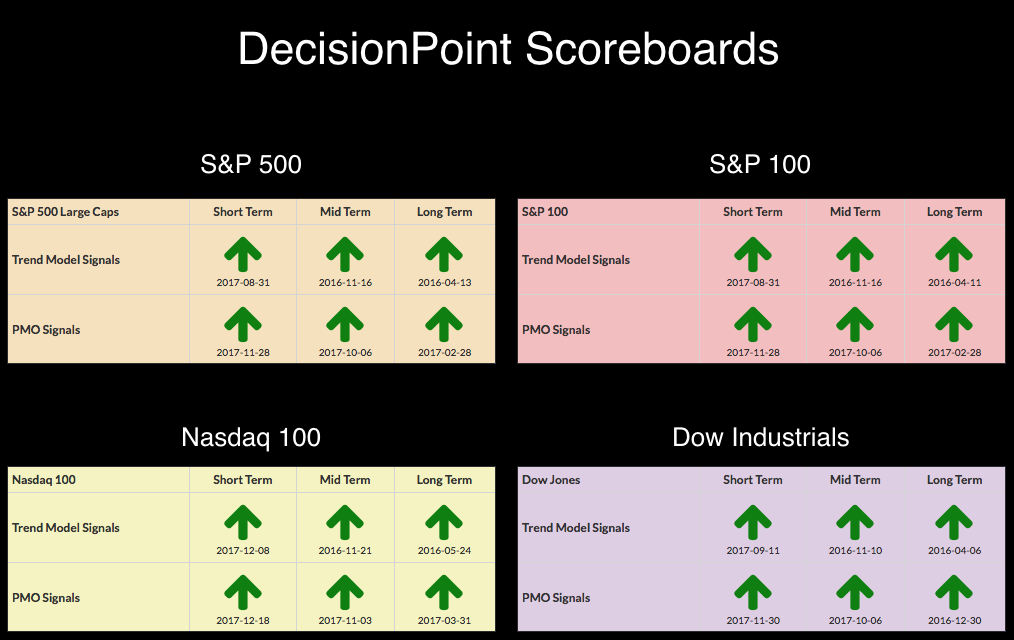
 The DecisionPoint Scoreboards remain completely "green". Hard to argue with the strength of this bull market in all three timeframes. However, the intermediate-term indicators are trying to top and have a negative crossover. ST indicators continue to fall. The Dollar looks very weak and it is getting more bearish as BUY signals continue to fall away for UUP.
The purpose of the DecisionPoint Alert Daily Update is to quickly review the day's action, internal condition, and Trend Model status of the broad market (S&P 500), the nine SPDR Sectors, the U.S. Dollar, Gold, Crude Oil, and Bonds. To ensure that using this daily reference will be quick and painless, we are as brief as possible, and sometimes we let a chart speak for itself.
STOCKS
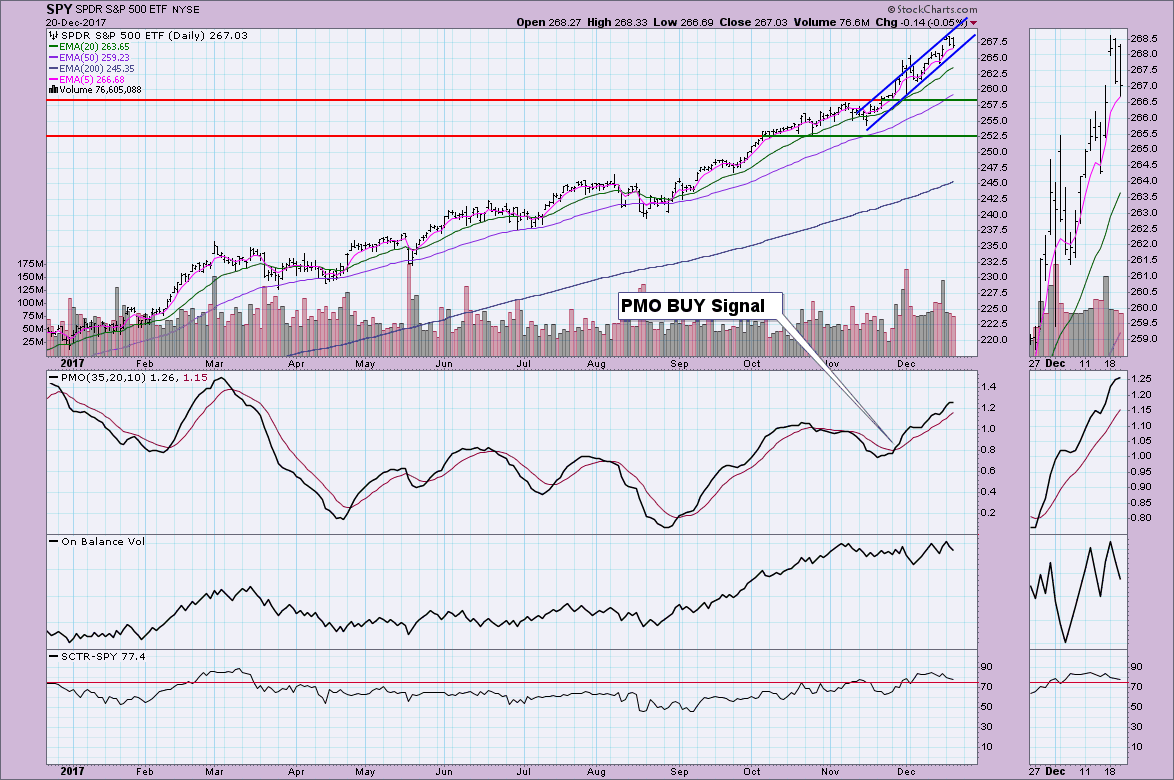
IT Trend Model: BUY as of 11/15/2016
LT Trend Model: BUY as of 4/1/2016
The bearish descending triangle activated as expected with a decline. Price has now managed to hold support at Friday's high.
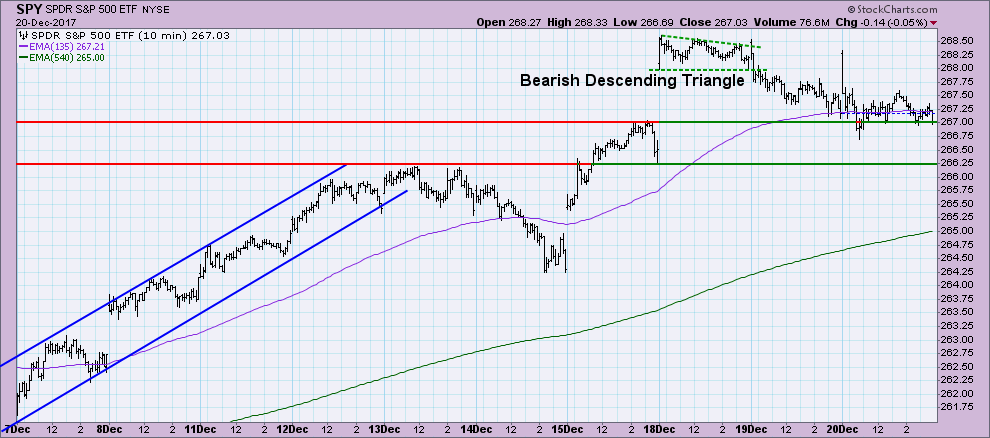
It's time for the market to pause its very steep descent. However, I've been saying it's too steep for about a month. We did see some pullback this week and the PMO has been affected. We've certainly seen the PMO take a pause or two with the market and I think we are seeing the same. The future of this steep rising trend channel isn't clear, but even consolidation could slow down the ascent and move it to a more manageable rise.
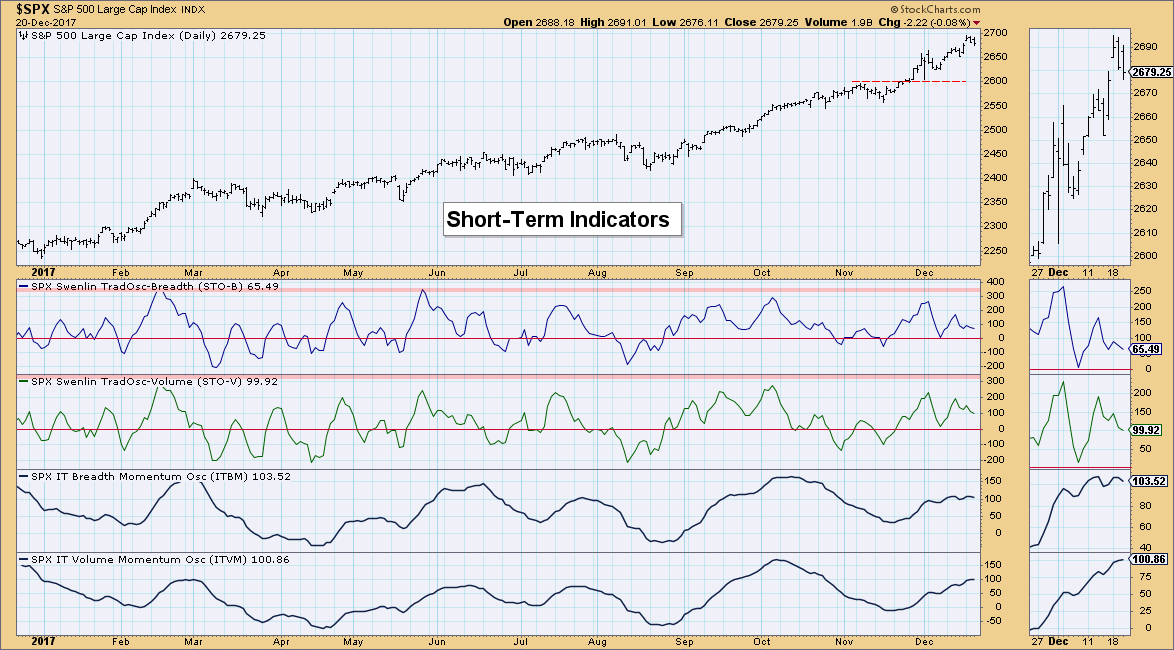
Climactic Indicators: Nothing to see here. Still waiting on the VIX to penetrate a Bollinger Band. Given it has remained on the top of its average, bullish sentiment is still strong.
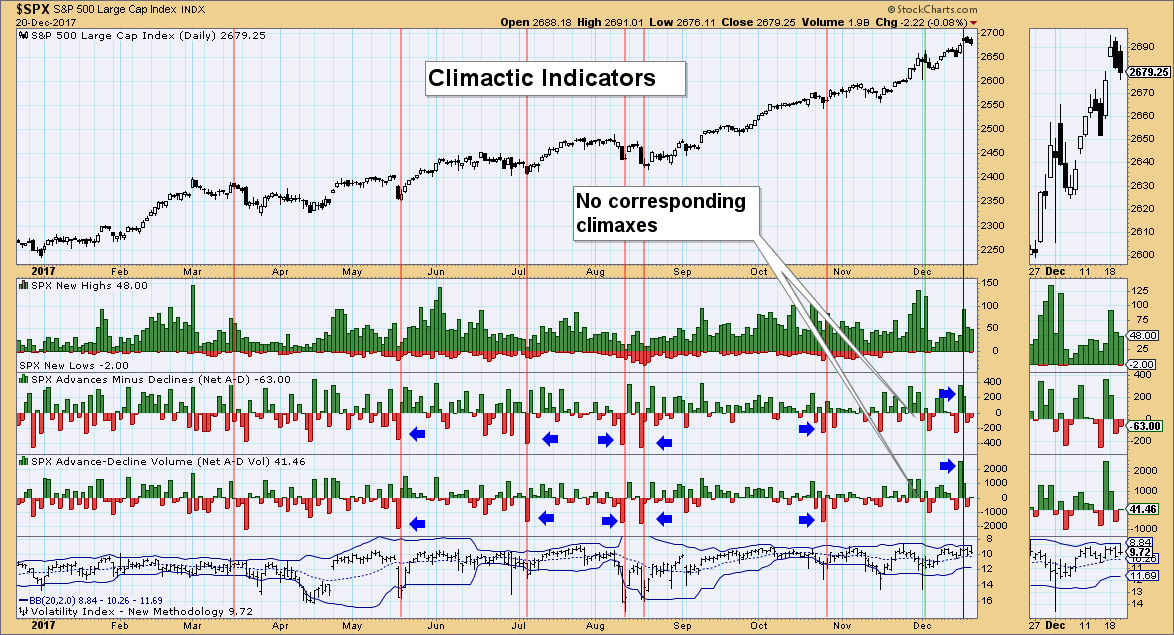
Short-Term Indicators: Good news is that they are decompressing, the bad news is that they are still declining. What I really don't like is the rolling over of the ITBM and ITVM. We will be watching closely and notify you when they bottom.
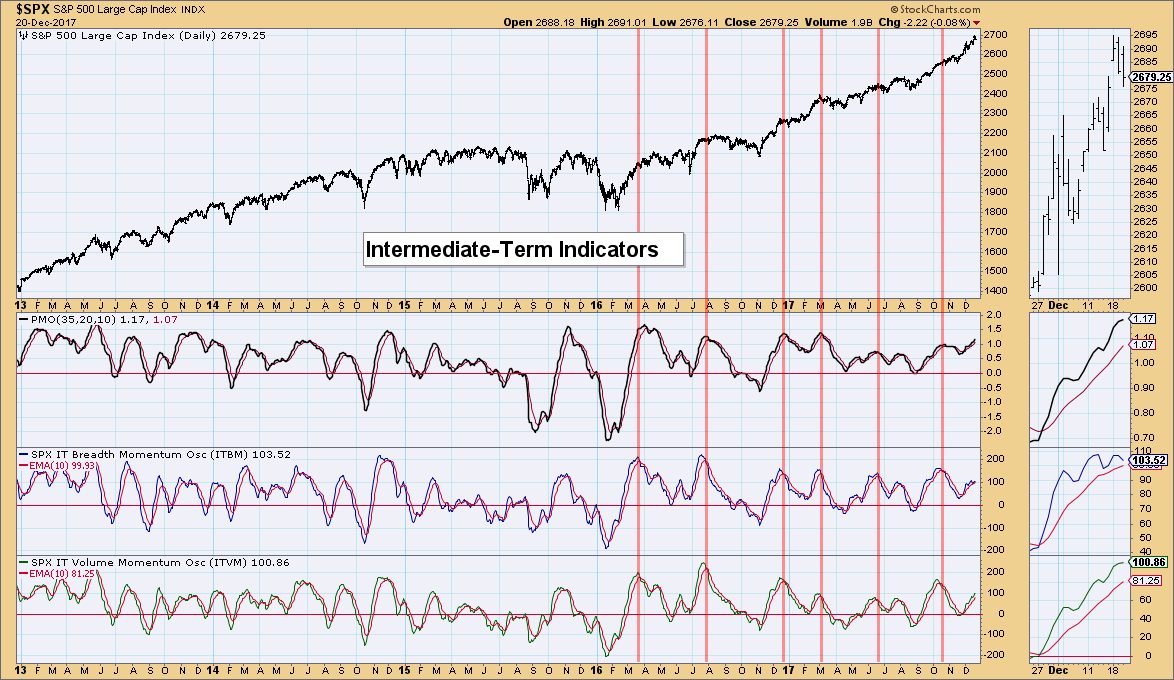
Intermediate-Term Indicators: I don't generally get too worked up about these indicators topping until we get a negative crossover. We were faked out twice before, but we will definitely want to watch these indicators closely. You can see that intermediate-term rough waters seem to appear when they top.
Conclusion: The strength of this bull market is clear in the DP Scoreboards so expecting bearish outcomes isn't wise. However, the short- and intermediate-term indicators are soft and declining. This is certainly a result of the market pulling back the last few days. I'm still looking for mostly sideways movement this week and probably with holiday trading next week, we'll likely see very little movement. The passage of the new tax bill this afternoon didn't seem to affect the market much and I suspect it's baked in at this point. I do think it is safe to say not to expect a correction to finish December. January will be very interesting though...
DOLLAR
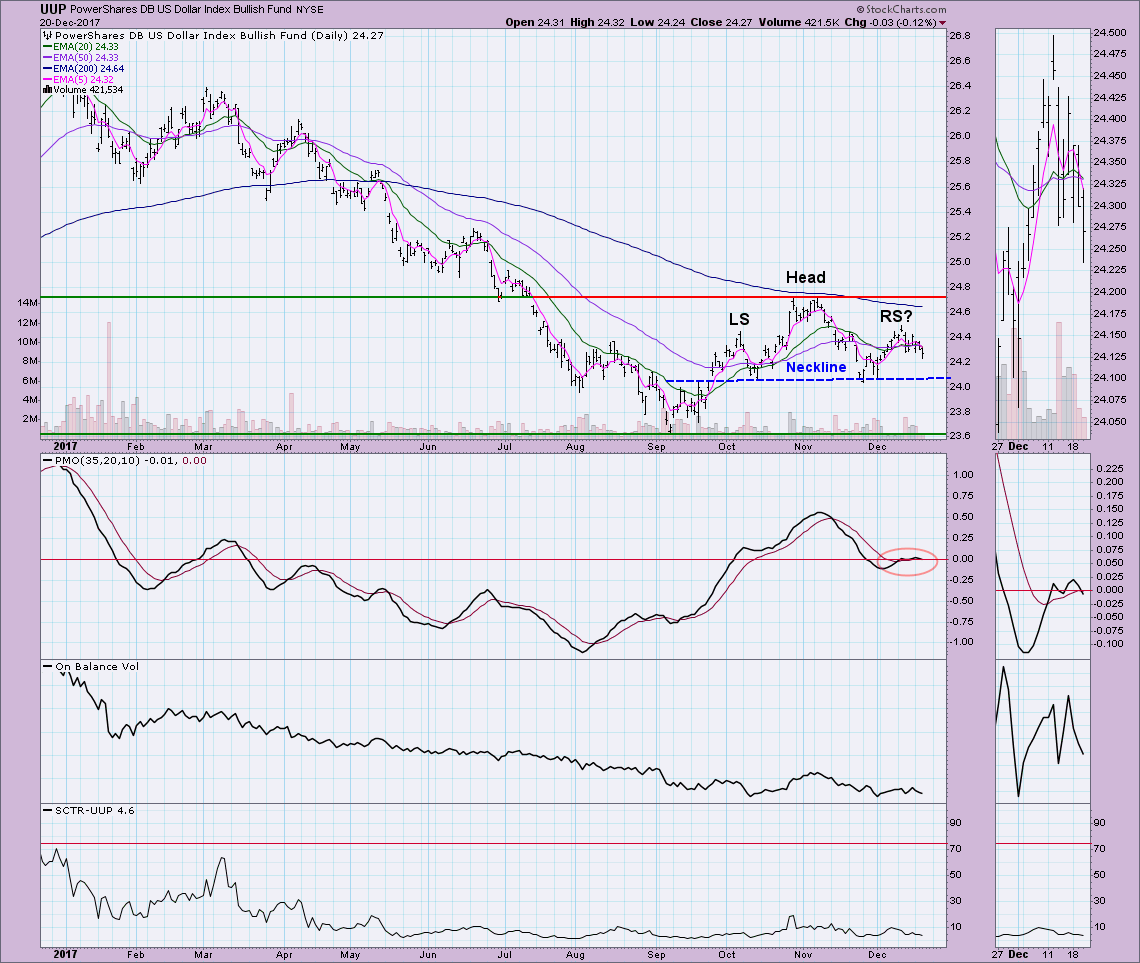
IT Trend Model: BUY as of 12/12/2017
LT Trend Model: SELL as of 05/24/2017
The short-term head and shoulders is continuing to form in textbook style. Today the 5-EMA crossed below the 20-EMA while the they were both above the 50-EMA which triggered a ST Trend Model Neutral signal. The big concern is the 20/50-EMA negative crossover that will likely hit UUP tomorrow. Add a PMO SELL signal that was generated by today's negative crossover and you have a recipe for an execution...of the head and shoulders.
GOLD
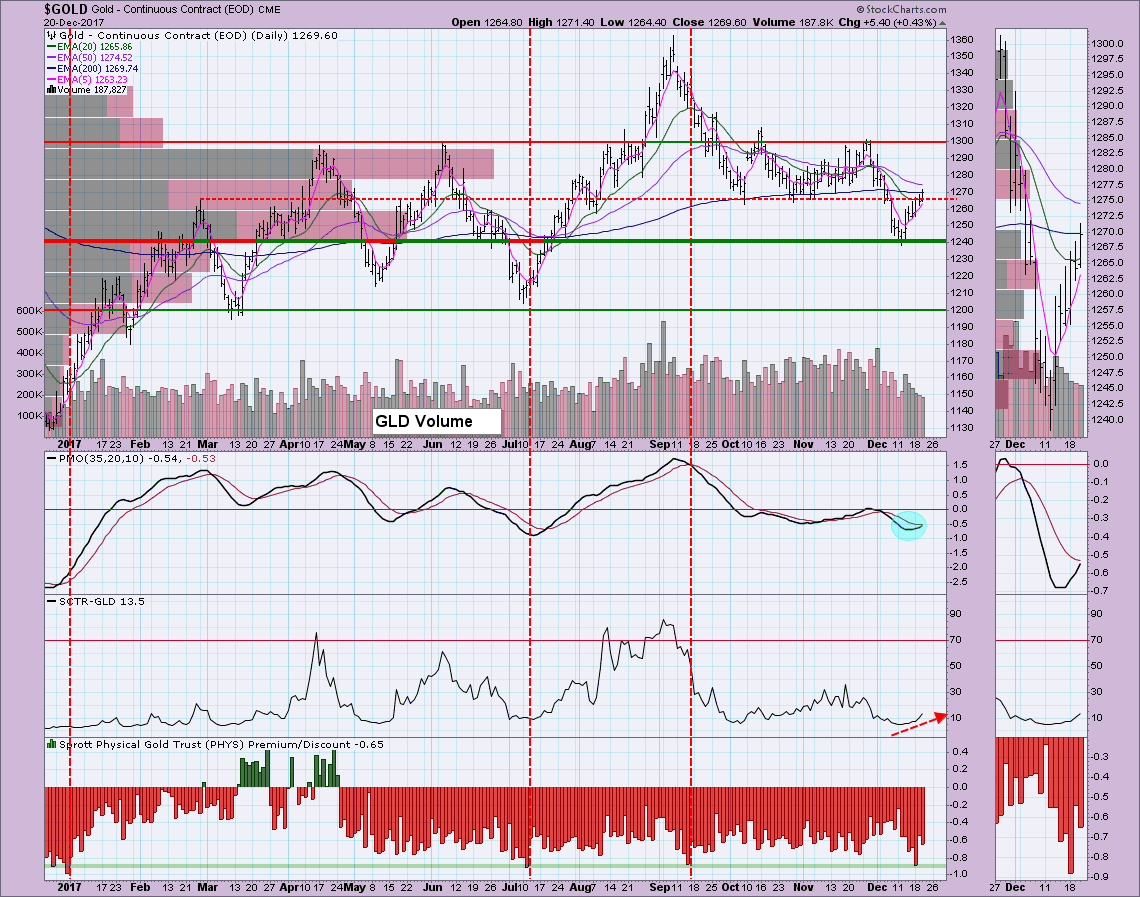
IT Trend Model: NEUTRAL as of 10/20/2017
LT Trend Model: BUY as of 4/12/2017
The Dollar is weak and that is good news for Gold which rallied off price by volume support and has now broken above the February top. The PMO is lining up for a BUY signal, the SCTR is recuperating and sentiment finally got bearish enough to look for a rally continuation. The 1300 level should be easy to reach right now.
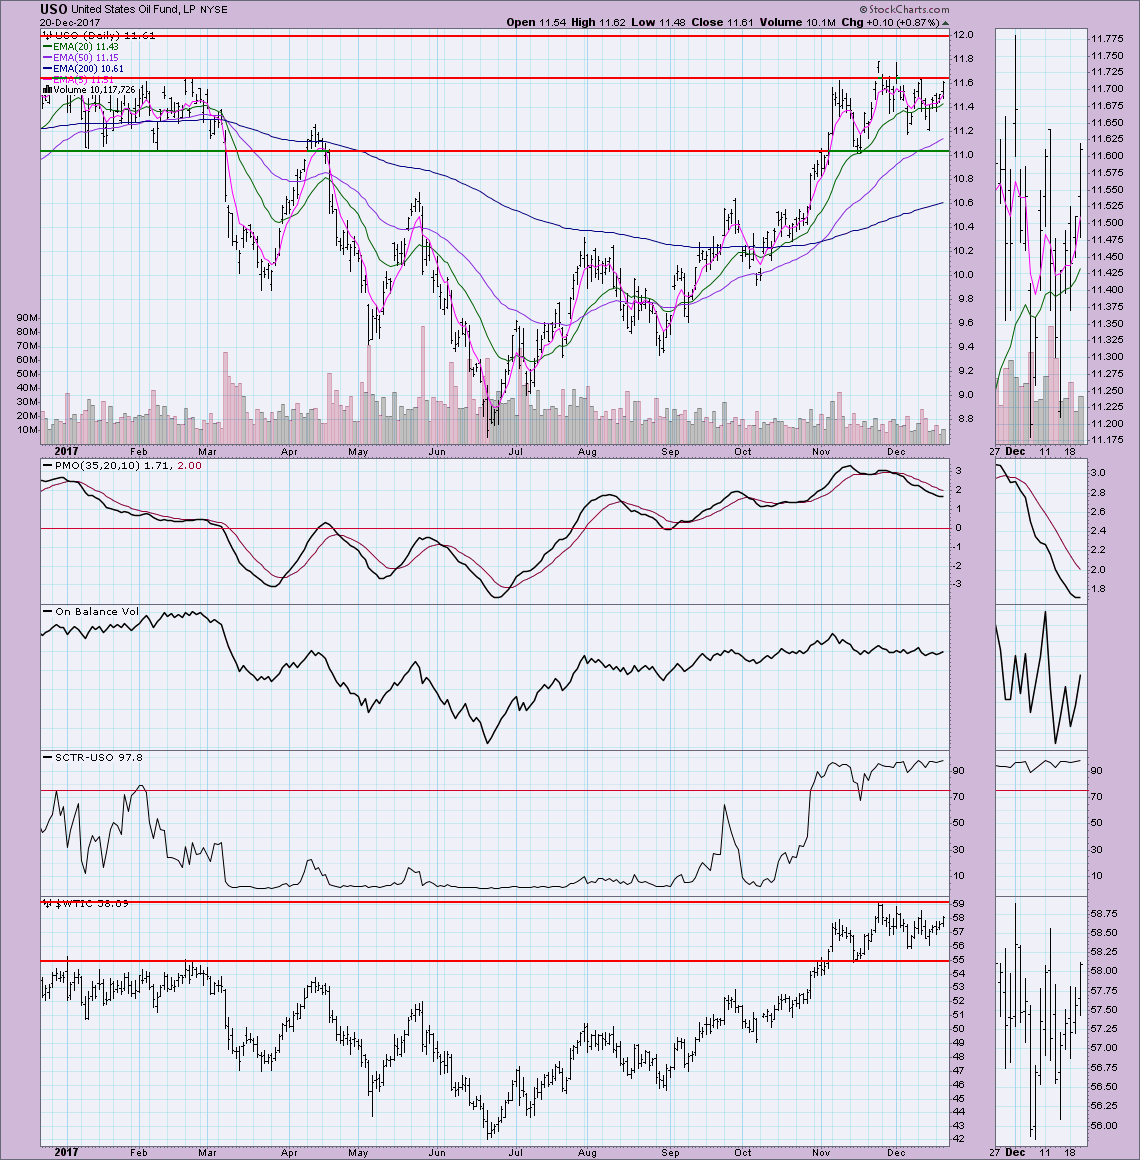
CRUDE OIL (USO)
IT Trend Model: BUY as of 11/2/2017
LT Trend Model: BUY as of 9/7/2017
USO is about to test overhead resistance again. The PMO is trying to turn up and it isn't that overbought in the grand scheme of things. The SCTR remains healthy and Oil ($WTIC) still has room to rise before it tests its overhead resistance. I suspect we will get a break and move up to $12.
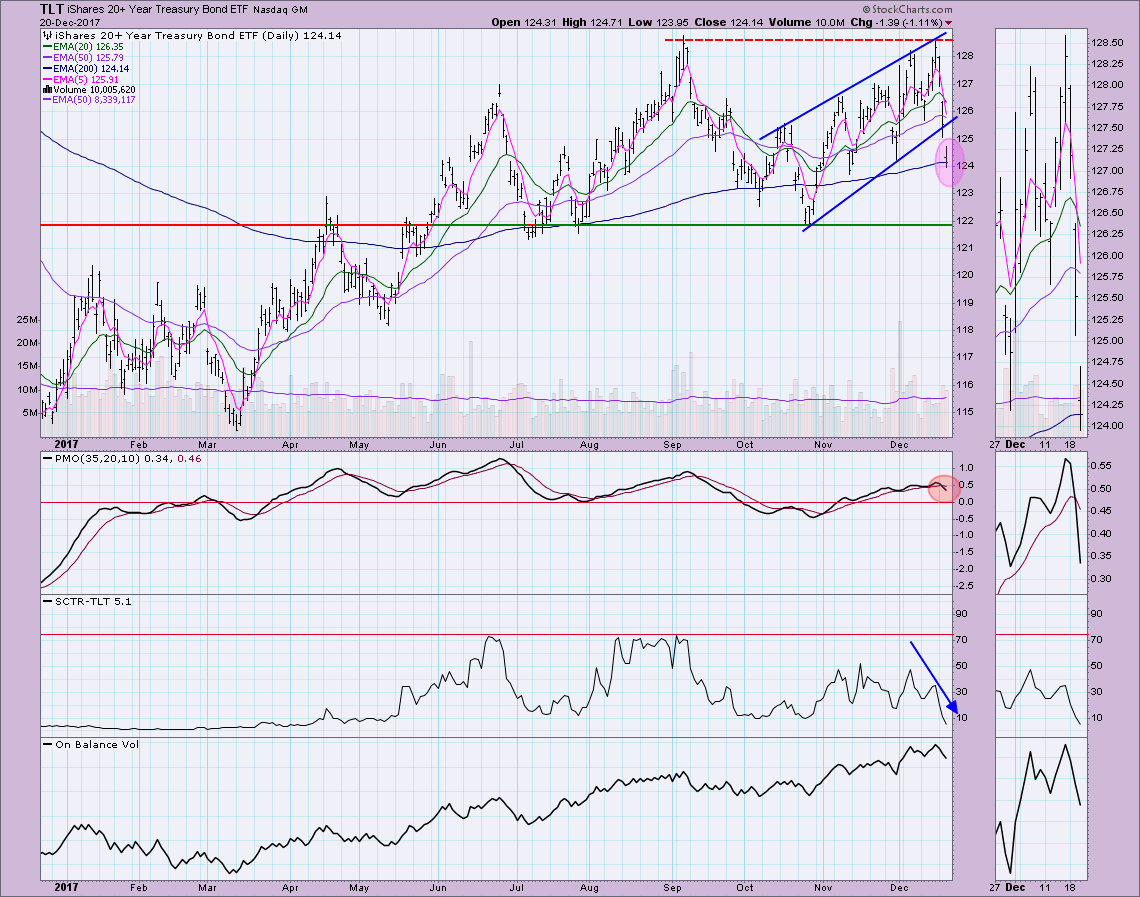
BONDS (TLT)
IT Trend Model: BUY as of 11/8/2017
LT Trend Model: BUY as of 6/16/2017
The rising wedge executed with a bang the last two days. Rates and yields are rising so I would expect to see TLT test the $122 level. Note also today ST Trend Model Neutral signal (5/20-EMA negative crossover) and the new PMO SELL signal. Nothing bullish here.
Helpful DecisionPoint Links:
DecisionPoint Shared ChartList and DecisionPoint Chart Gallery
Price Momentum Oscillator (PMO)
Swenlin Trading Oscillators (STO-B and STO-V)
Technical Analysis is a windsock, not a crystal ball.
Happy Charting!
- Erin
**Don't miss DecisionPoint Commentary! Add your email below to be notified of new updates"**
