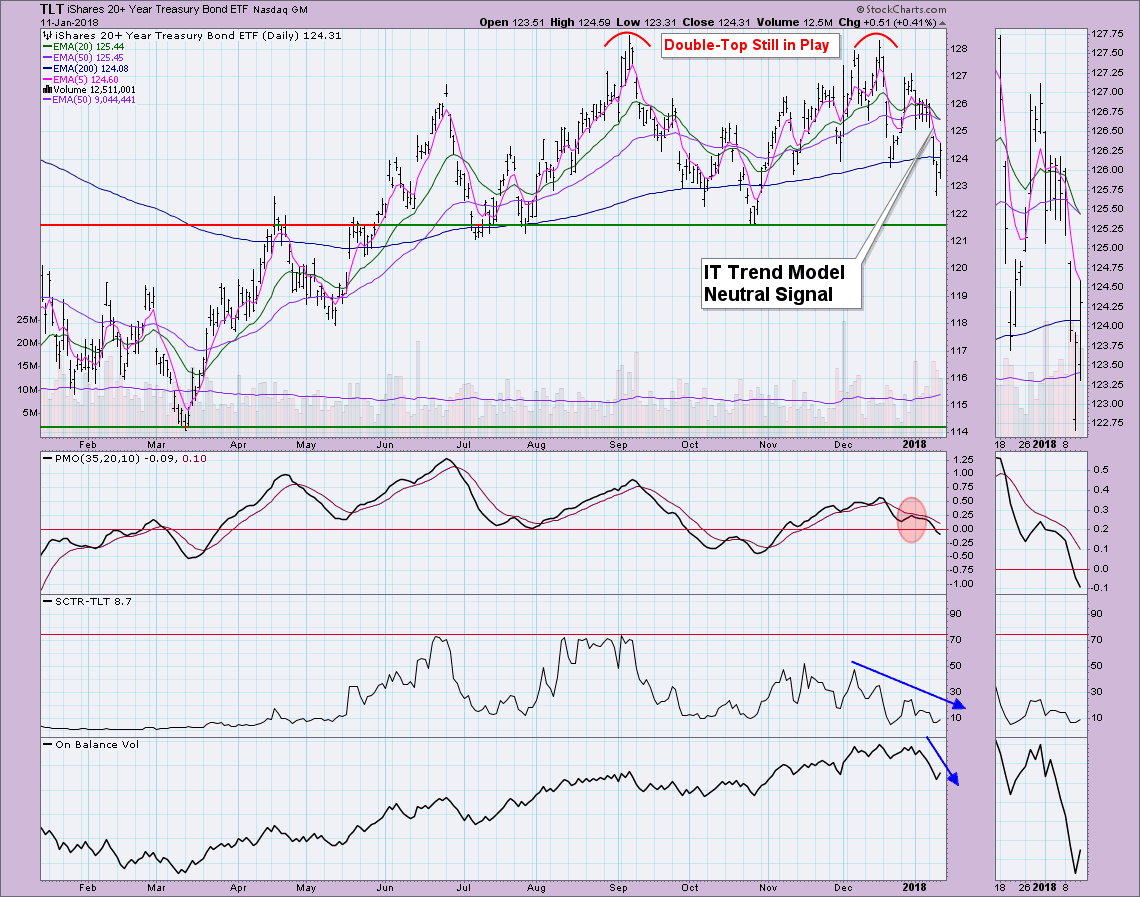
Today I received notice that TLT had triggered a new Intermediate-Term Trend Model (ITTM) Neutral signal. I decided to take a look at $TYX to see if yields were lining up with the action on TLT. Of course the relationship between TLT and $TYX is inverse, so a bearish TLT chart should yield (no pun intended) a 30-Yr Treasury Yield chart that is bullish. It did, only in a slightly different way than I expected.
The new ITTM Neutral signal was generated when the 20-EMA crossed below the 50-EMA. It was not a SELL signal because the 50-EMA is above the 200-EMA which implies TLT is in a bull market configuration. We prefer to go Neutral on these negative crossovers above the 200-EMA. Bull market rules still apply when the 50-EMA is greater than the 200-EMA. However, the chart is quite bearish. Carl pointed out recently the double-top formation. The pattern would become official if it were to execute. The neckline of the double-top is along the October low. The expectation, especially after this Neutral signal, is a breakdown below that neckline. The big risk here is that the minimum downside target would be just above the March low. I calculated the target by measuring the height of the double-top pattern and then subtracting it from the neckline. That's a hefty fall if it executes.
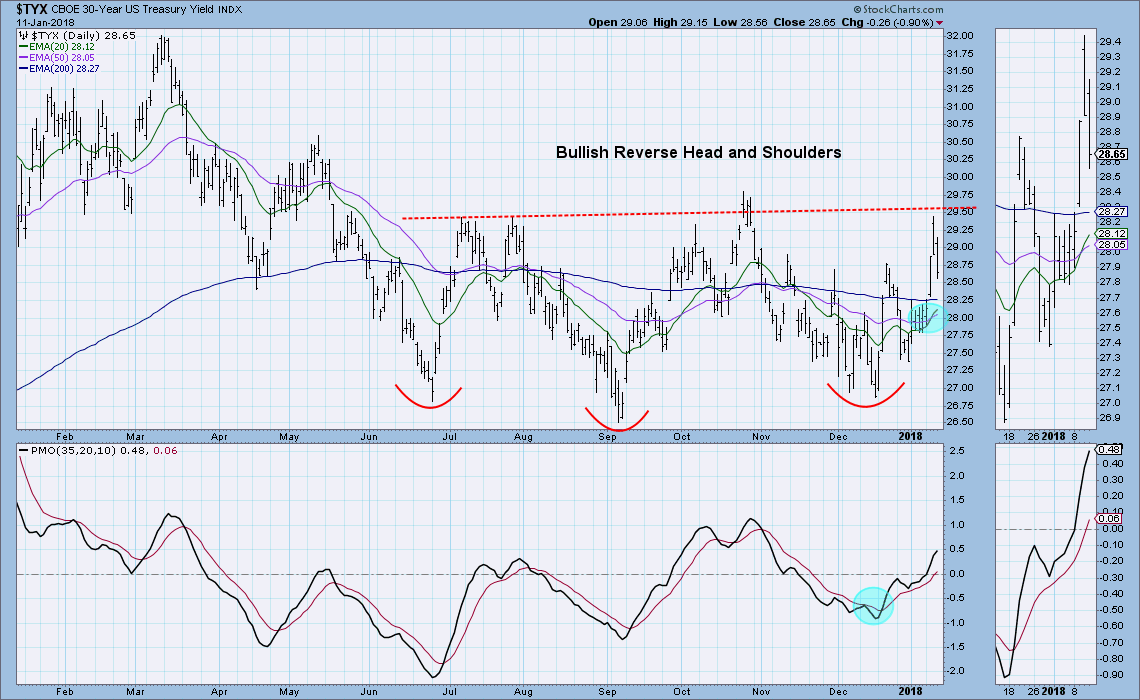
Let's look at the Yield chart. We would expect to see a bullish chart given the inverse relationship between bonds and yields. Indeed the chart is very bullish. Instead of a double-bottom to replicate the double-top on the TLT chart, we have a reverse head and shoulders which is also a bullish pattern. This pattern will become official if we see a break above the neckline. Notice that $TYX triggered an ITTM BUY signal earlier this week. The PMO is healthy and not at all overbought.
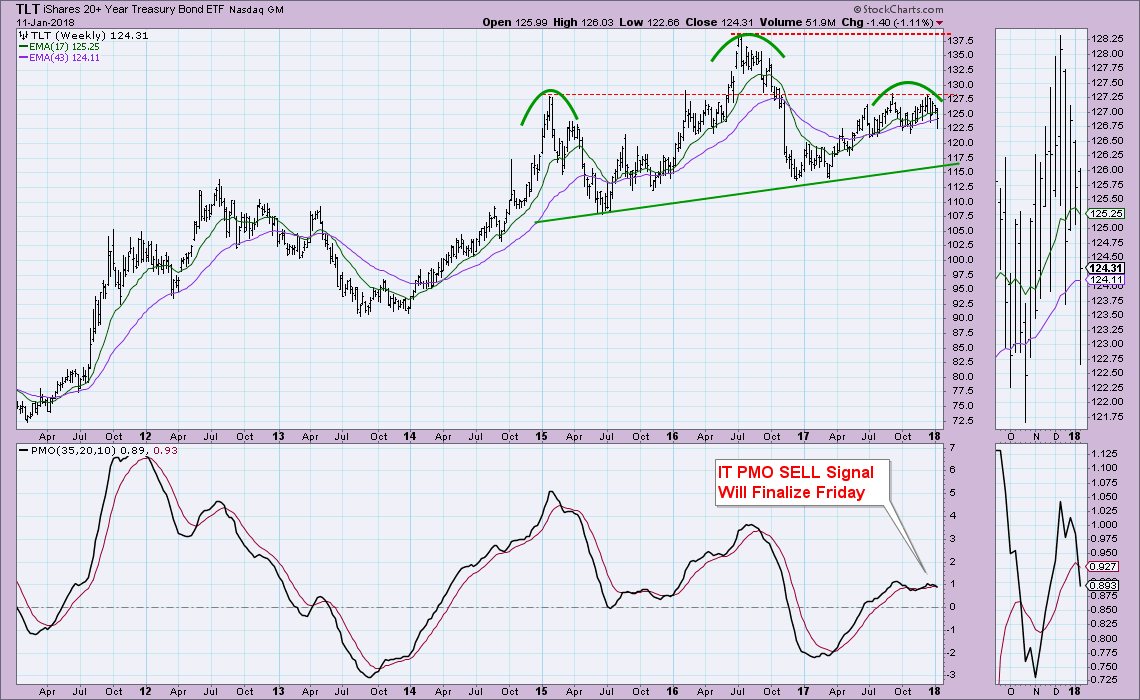
To shore up this discussion a review of the weekly chart for TLT shows a very bearish long-term head and shoulders. This is serious business. If we measure the height of this pattern from head to neckline, it adds up to a differential of about $25. That would mean on the conservative side, the minimum downside target would be around $90 at the 2013 lows. Notice that we have an IT PMO SELL signal in play right now too. This signal will go final tomorrow if the negative crossover is still there.
Helpful DecisionPoint Links:
DecisionPoint Shared ChartList and DecisionPoint Chart Gallery
Price Momentum Oscillator (PMO)
Swenlin Trading Oscillators (STO-B and STO-V)
Technical Analysis is a windsock, not a crystal ball.
Happy Charting!
- Erin
**Don't miss DecisionPoint Commentary! Add your email below to be notified of new updates"**
