The market was flat for the last two weeks of December, and I thought that might be a sign that it was hanging on by its fingernails until the first of the year, when we might see some profit taking. But, no. Why take profits when the market seems to be bulletproof? I have been hearing about a lot of positive statistical 'firsts' regarding market performance in the last year, and I recently realized I have a first of my own to report.
The DecisionPoint Weekly Wrap presents an end-of-week assessment of the trend and condition of the stock market (S&P 500), the U.S. Dollar, Gold, Crude Oil, and Bonds.
STOCKS
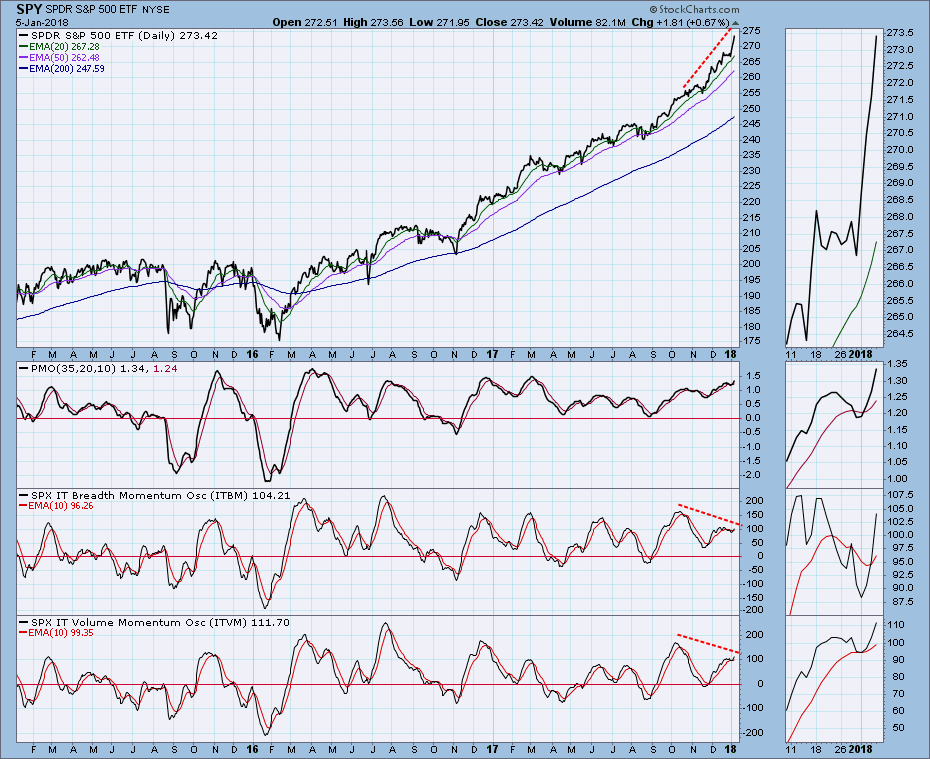
IT Trend Model: BUY as of 11/15/2016
LT Trend Model: BUY as of 4/1/2016
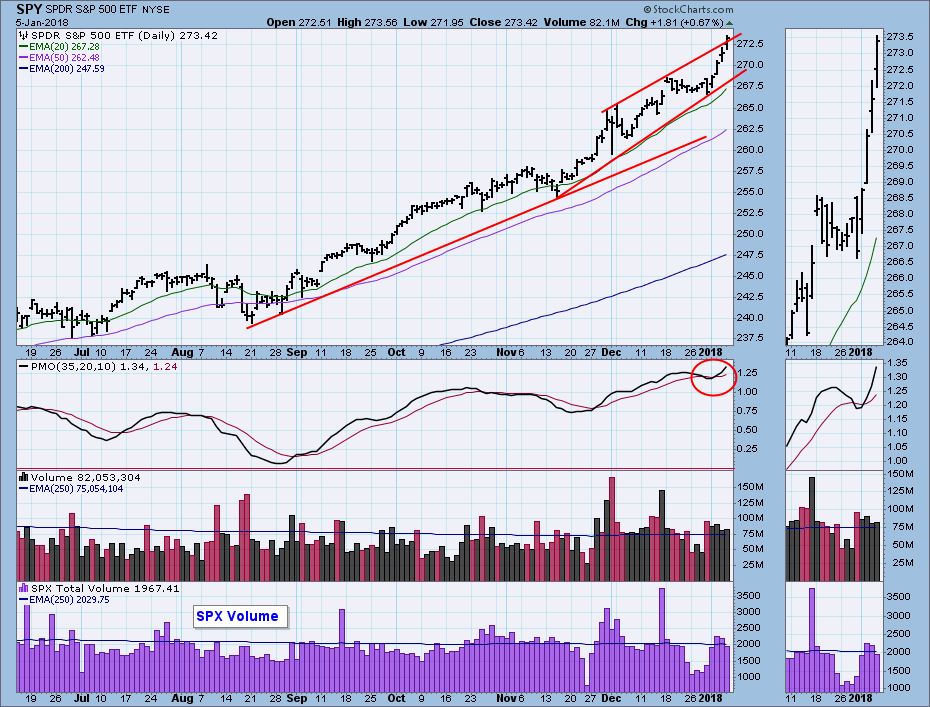
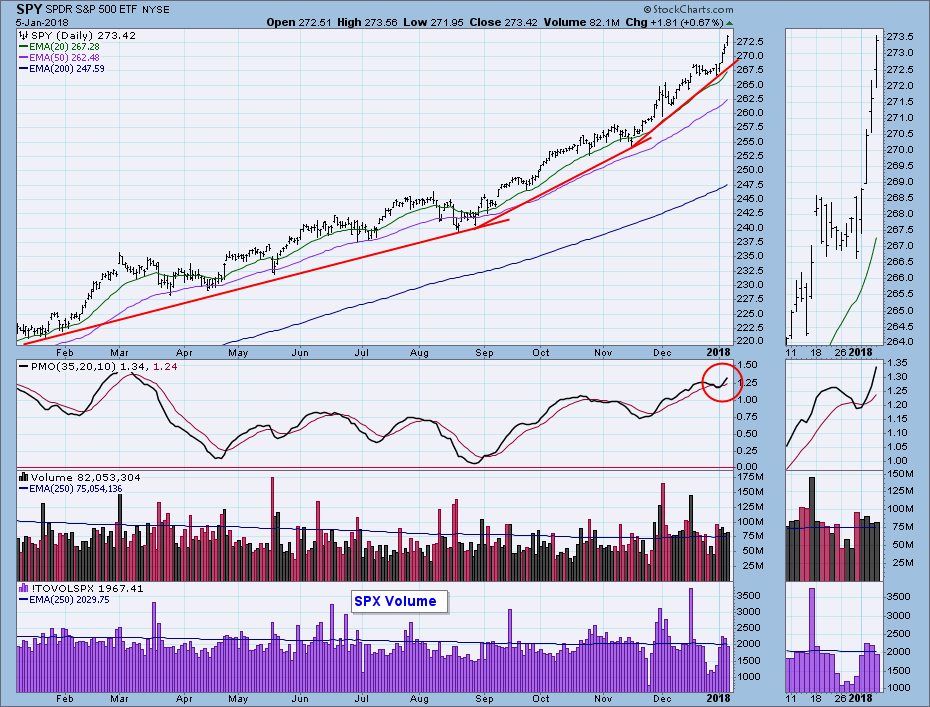
Daily Chart: Something I can't ever remember happening before: The SPY 20EMA has remained above the 50EMA for almost 14 months. This circumstance has overlapped the entire year of 2017, causing the DecisionPoint IT Trend Model (ITTM) to remain on a BUY signal for the whole year, and resulting in Erin being in an eleven-way tie for Timer Digest Timer of the Year. The market conditions were perfect for how the ITTM is designed. There were no pullbacks sufficient to kick the model into NEUTRAL, so we were spared those slippage-causing round trips from NEUTRAL back to BUY that so often happen in less sure-footed bull markets. Such benevolent market conditions favored intermediate trading styles that held steady through the minor blips.
Last week we had a PMO SELL signal, but that was quickly reversed this week. Other than the fact that ever-steepening rising trend lines are suggesting a parabolic advance, the most immediate problem I see on this chart is that SPY has gone short-term vertical again. Volume is average, so it probably isn't a blowoff, but the angle of ascent not sustainable.
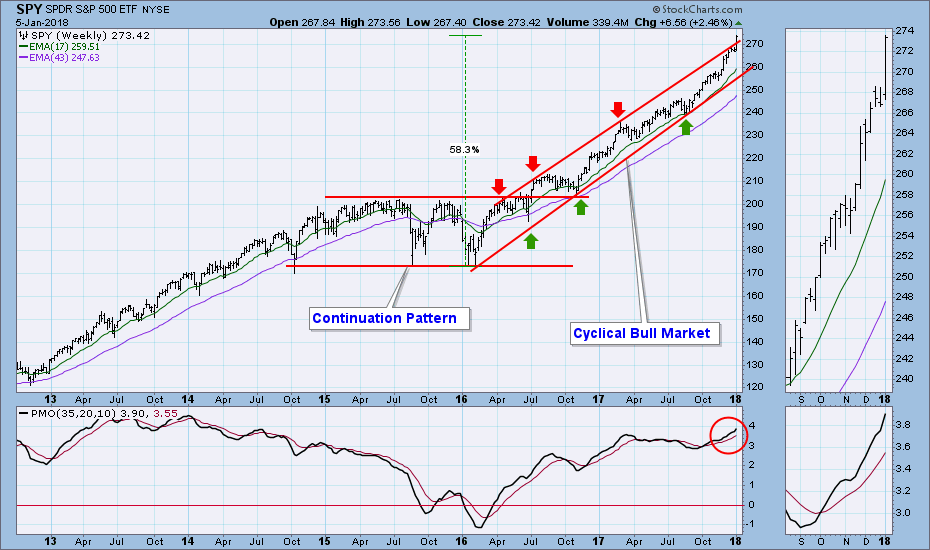
Weekly Chart: Some weeks ago SPY hit the top of the rising trend channel, and I thought its advance would be slowed, at the very least, but this week SPY broke out of the channel.
Short-Term Market Indicators: The negative divergences I have been watching seem to be evaporating. The indicators are not making new highs because they maintain a finite range, but they have broken above their declining tops lines.
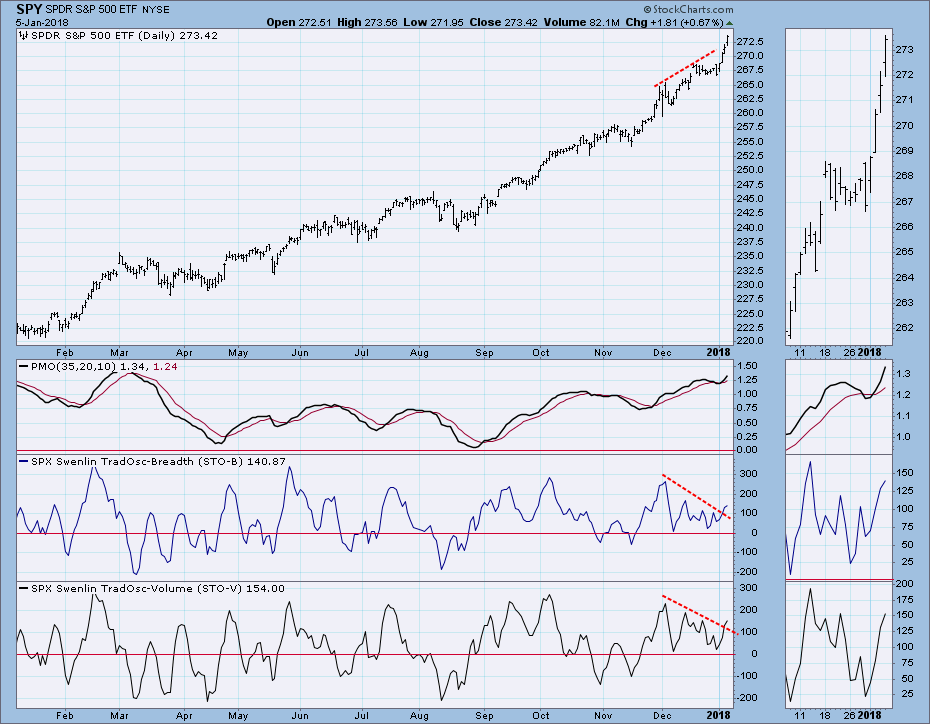
Intermediate-Term Market Indicators: The negative divergences remain, but the indicators are all above their signal lines and rising.
Conclusion: The people on the financial news are always trying to connect specific market movement to news. Sometimes there are rational, reasonable connections that can be made, and other times it is just nonsense. Recently it occurred to me that the 40% cut in corporate taxes recently signed into law has got to have a major impact on corporate earnings and market performance. I discuss it further in the ChartWatchers article I wrote this week, but I think the affect of this is going to be profoundly positive. That is not technical analysis, but it is too obvious to ignore. Was it already baked into the cake? Because congress was unable to dump Obama Care, tax reform never looked like a done deal until a few days before the fact, so I think there is still a big wave of positive news still to come.
The bull market has been so powerful that technical indicators have been somewhat neutralized. When they are overbought, the market doesn't seem to care, and they scarcely get oversold enough to give really solid buy signals. Indicators can be helpful, but more emphasis needs to be put on price movement in relation to support, resistance, and trends. With that in mind I will reiterate that price has just gone vertical, and offer the assertion that that situation cannot be sustained. Some adjustment will need to be made sooner rather than later.
DOLLAR (UUP)
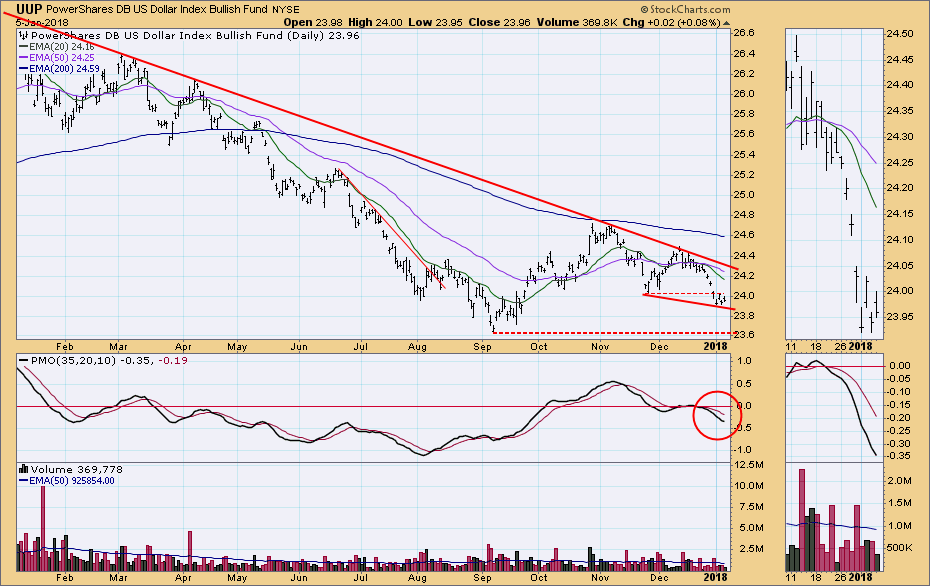
IT Trend Model: SELL as of 12/21/2017
LT Trend Model: SELL as of 5/24/2017
Daily Chart: UUP broke horizontal support last week, and it spent this week consolidating below the support-turned-resistance line.
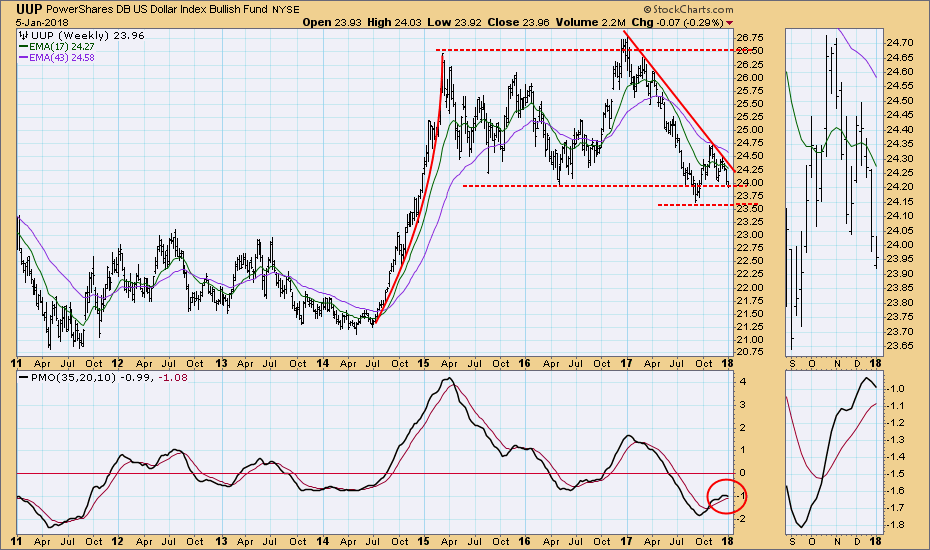
Weekly Chart: UUP is testing important support, and the weekly PMO has topped.
GOLD
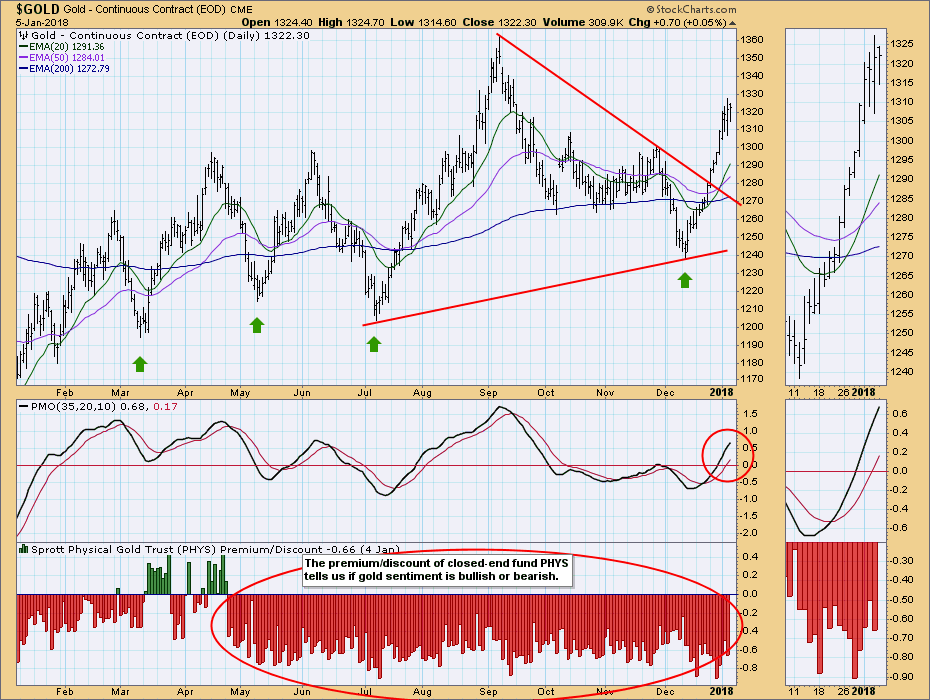
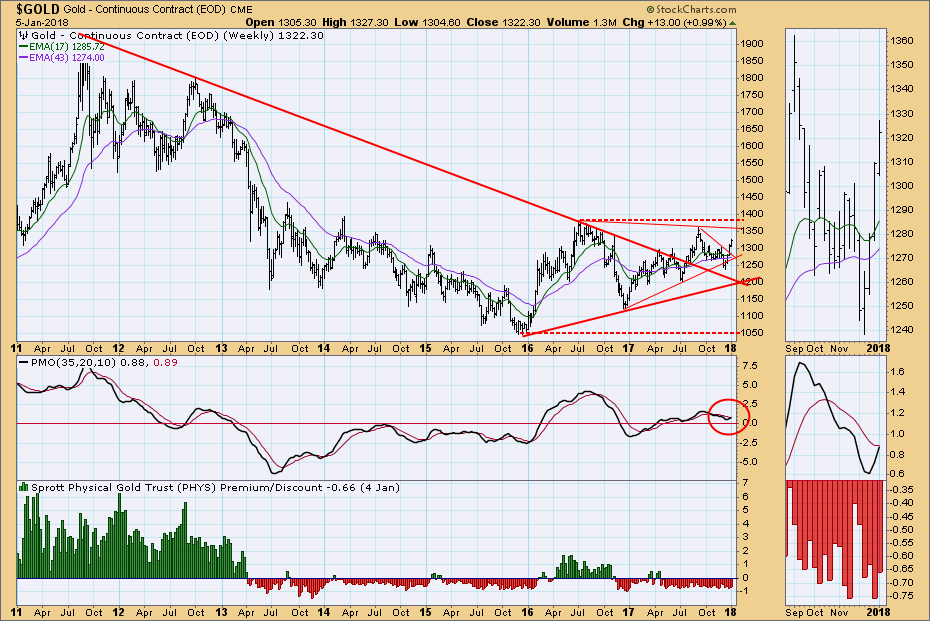
IT Trend Model: BUY as of 1/2/2018
LT Trend Model: BUY as of 4/12/2017
Daily Chart: While upward progress has faltered in the last two weeks, this chart looks positive, except for the persistence of bearish sentiment.
Weekly Chart: The picture of gold continues to improve in this time frame. The weekly PMO is rising, and price has some overhead room before it encounters resistance.
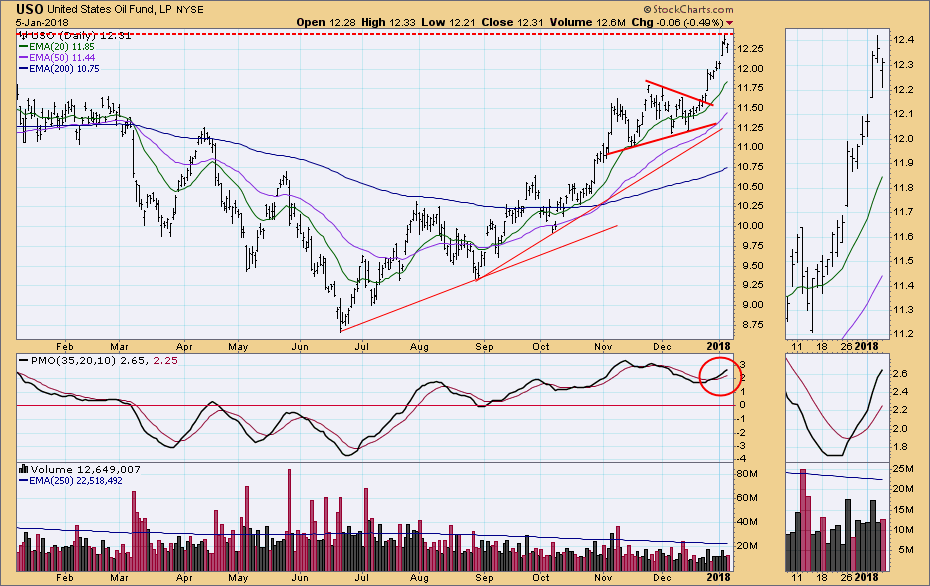
CRUDE OIL (USO)
IT Trend Model: BUY as of 9/6/2017
LT Trend Model: BUY as of 11/2/2017
Daily Chart: After nearly two months in a triangle/pennant formation, USO had a decisive breakout. The advance has taken price to the top of the two-year trading range. The daily PMO is overbought.
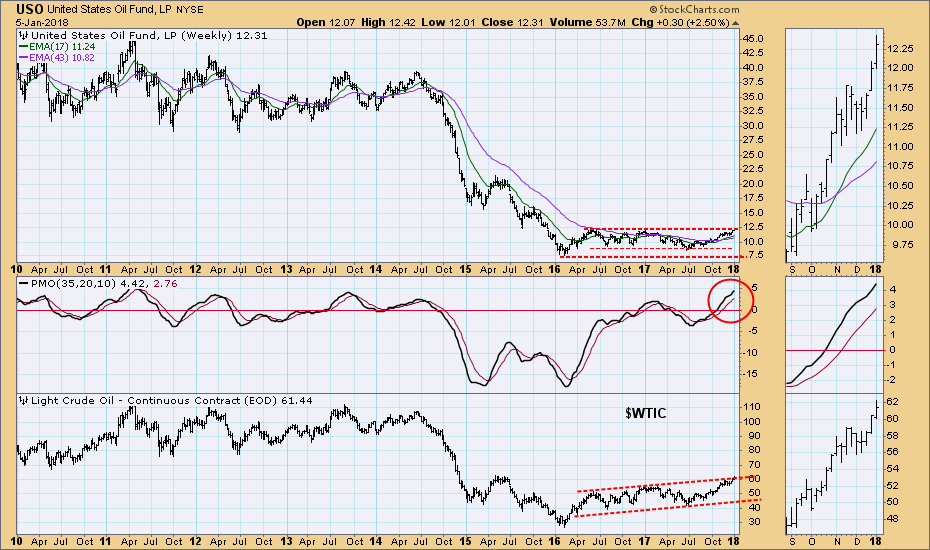
Weekly Chart: Price is still attacking overhead resistance in spite of the Trump administration's determination to further expand U.S. energy dominance through more aggressive offshore drilling. The weekly PMO is overbought, and overhead resistance is holding.
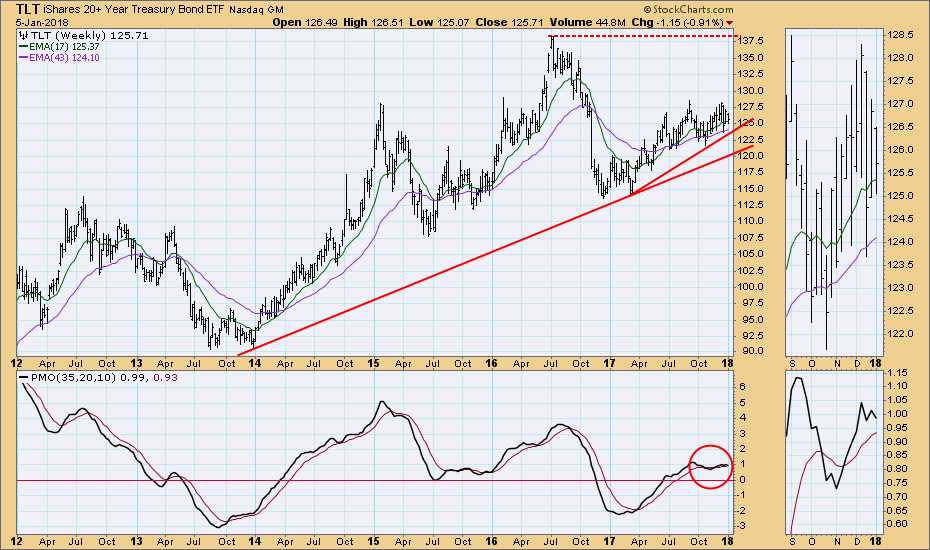
BONDS (TLT)
IT Trend Model: BUY as of 11/8/2017
LT Trend Model: BUY as of 6/16/2017
Daily Chart: My double top scenario is still viable.
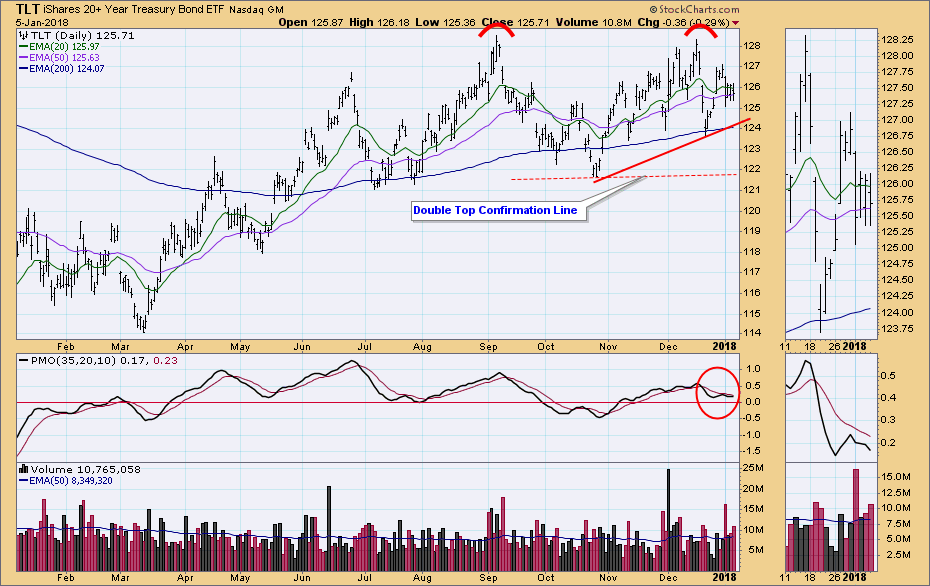
Weekly Chart: TLT is still above the three-month rising trend line, and the weekly PMO remains relatively flat. While the PMO has turned down, the chart is bullish overall.
**Don't miss any of the DecisionPoint commentaries! Go to the "Notify Me" box toward the end of this blog page to be notified as soon as they are published.**
Technical Analysis is a windsock, not a crystal ball.
Happy Charting!
- Carl
NOTE: The signal status reported herein is based upon mechanical trading model signals, specifically, the DecisionPoint Trend Model. They define the implied bias of the price index based upon moving average relationships, but they do not necessarily call for a specific action. They are information flags that should prompt chart review. Further, they do not call for continuous buying or selling during the life of the signal. For example, a BUY signal will probably (but not necessarily) return the best results if action is taken soon after the signal is generated. Additional opportunities for buying may be found as price zigzags higher, but the trader must look for optimum entry points. Conversely, exit points to preserve gains (or minimize losses) may be evident before the model mechanically closes the signal.
Helpful DecisionPoint Links:
DecisionPoint Shared ChartList and DecisionPoint Chart Gallery
Price Momentum Oscillator (PMO)
Swenlin Trading Oscillators (STO-B and STO-V)
