You'll note three BUY signals were lost today on the Dow and the OEX. The Industrials have been struggling. The Dow was unable to trigger a PMO BUY signal when the other three indexes had managed them with ease. The picture is getting worse for the Dow and the chart pattern is not encouraging. The question now is whether the deterioration of the Dow and now the OEX will tear down the SPX and NDX, neither of which is showing much strength as it is.
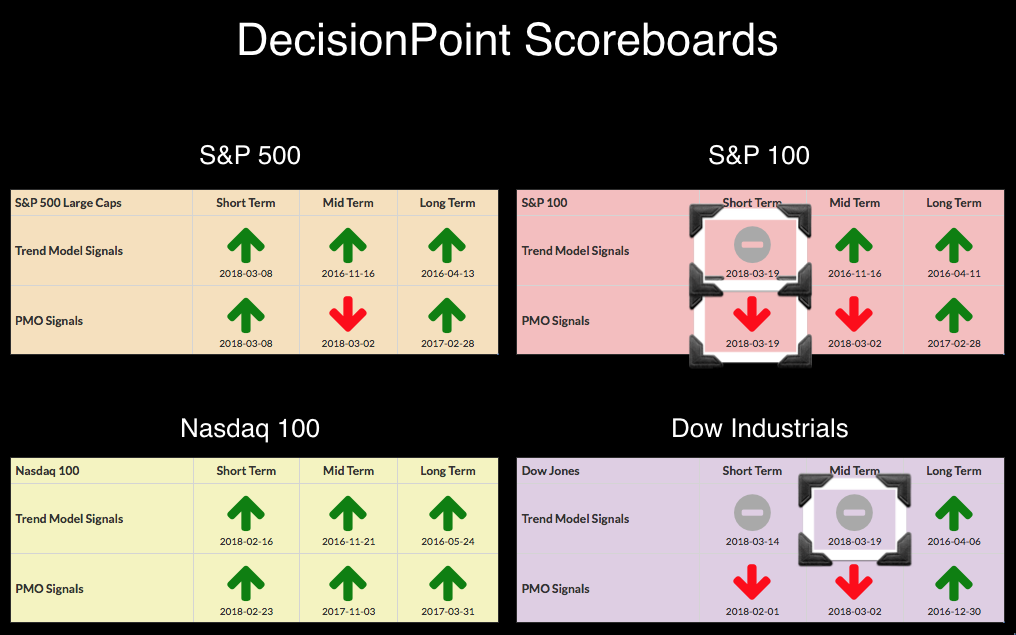
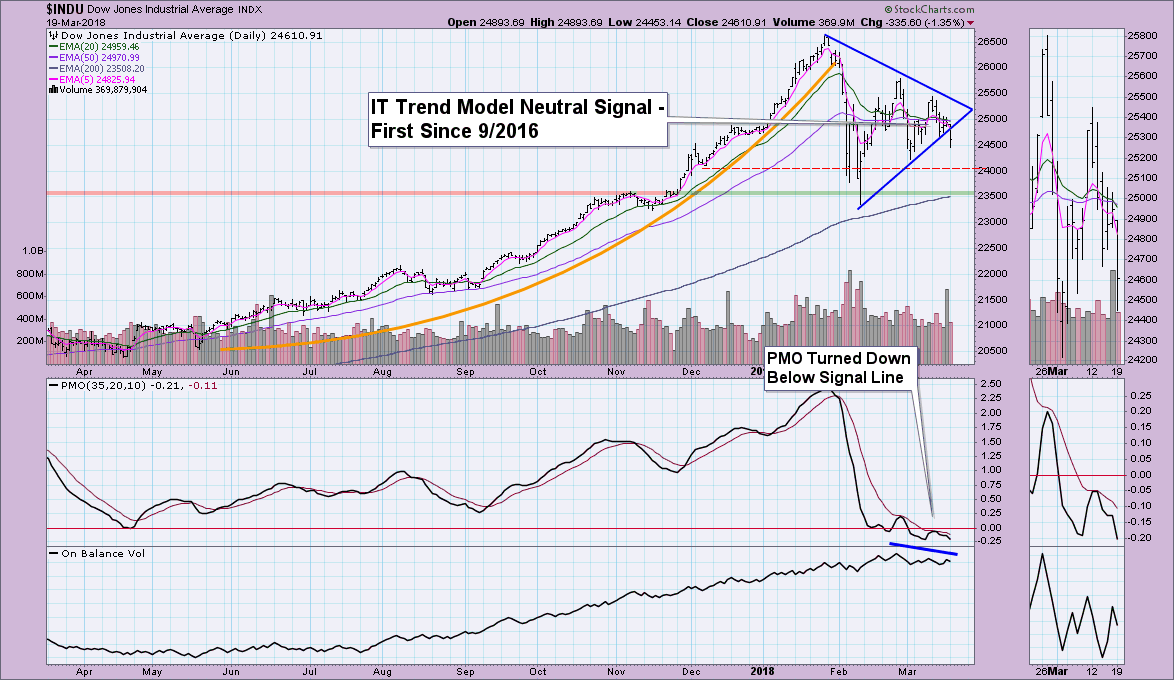
I have been watching a large symmetrical triangle on the Dow which more often than not is a continuation pattern, so the expectation was a breakout, not a breakdown. I'm now starting to eye the double-top on the Dow and especially on the OEX where that double-top is most prominent. This new IT Trend Model Neutral signal is the first one we've seen since September of 2016. Looking at the 5/20/50-EMAs, I see they are "braided". This means the Dow is in danger of lots of whipsaw on the Trend Models in the short and intermediate terms. I was already suspecting we may have trouble when the declining PMO bottoms matched with rising bottoms on price.
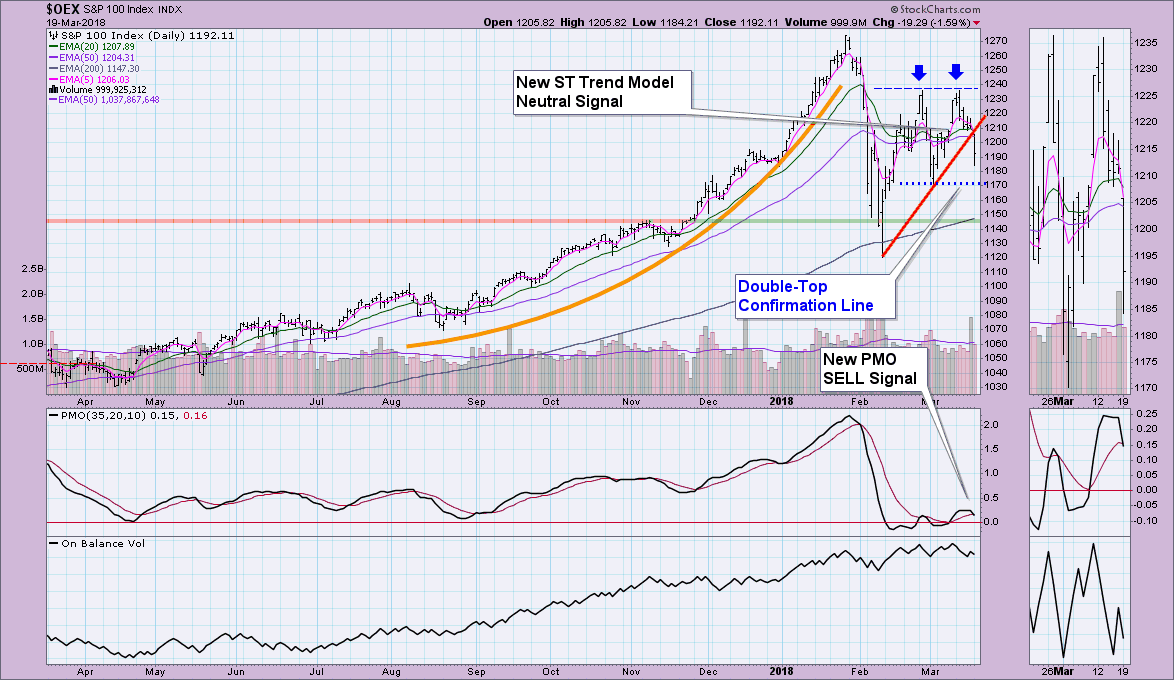
Although the PMO is still angling upward on the OEX, the double-top pattern looks ominous. If price breaks below the confirmation line, the downside expectation would bring price down past the February low.
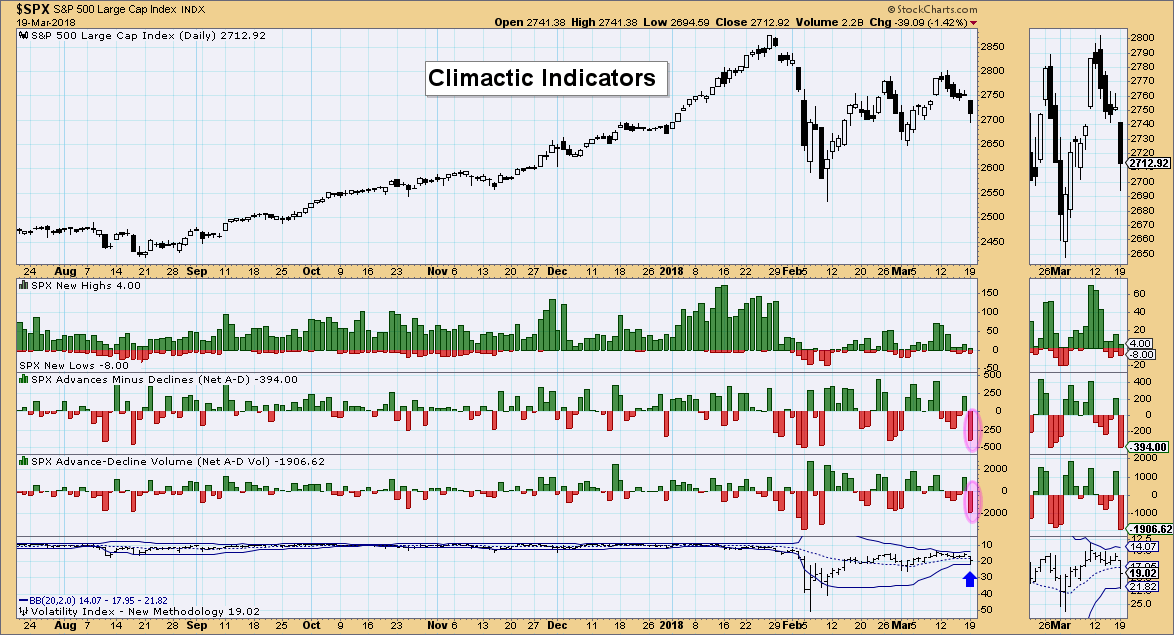
Looking at the climactic indicators, I note climactic breadth readings and a near penetration of the bottom Bollinger Band for the VIX. When I see this type of set-up, I determine if this is a selling initiation or exhaustion. Given that we were already in a steady downtrend, I suspect this is an exhaustion. I'd expect to see a snap-back rally today or tomorrow.
Unfortunately, the short and intermediate-term indicators are bearish. Short-term indicators have been falling for some time and they do not look interested in moving back up yet. There is plenty of downside room for them before they become oversold.
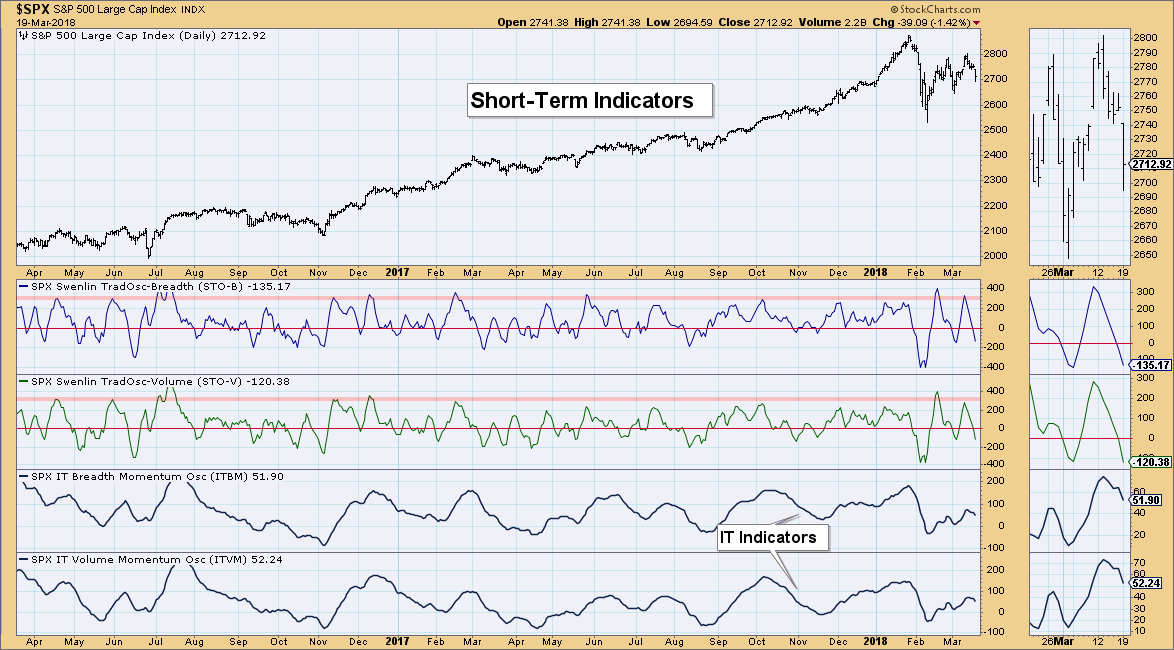
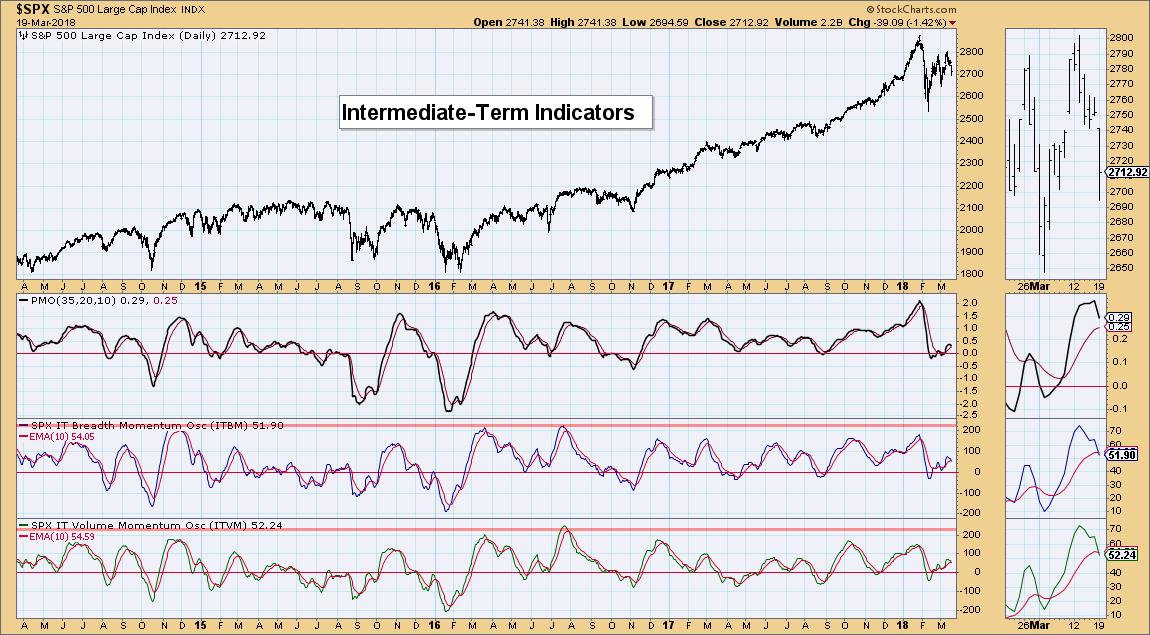
The good news is that IT indicators are trending up from their recent bottom. The bad news is that new negative crossovers have occurred on both the ITBM and ITVM. With so many bearish attention flags out there, I wouldn't be buying into this decline just yet.
Helpful DecisionPoint Links:
DecisionPoint Shared ChartList and DecisionPoint Chart Gallery
Price Momentum Oscillator (PMO)
Swenlin Trading Oscillators (STO-B and STO-V)
Technical Analysis is a windsock, not a crystal ball.
Happy Charting!
- Erin
**Don't miss DecisionPoint Commentary! Add your email below to be notified of new updates"**
