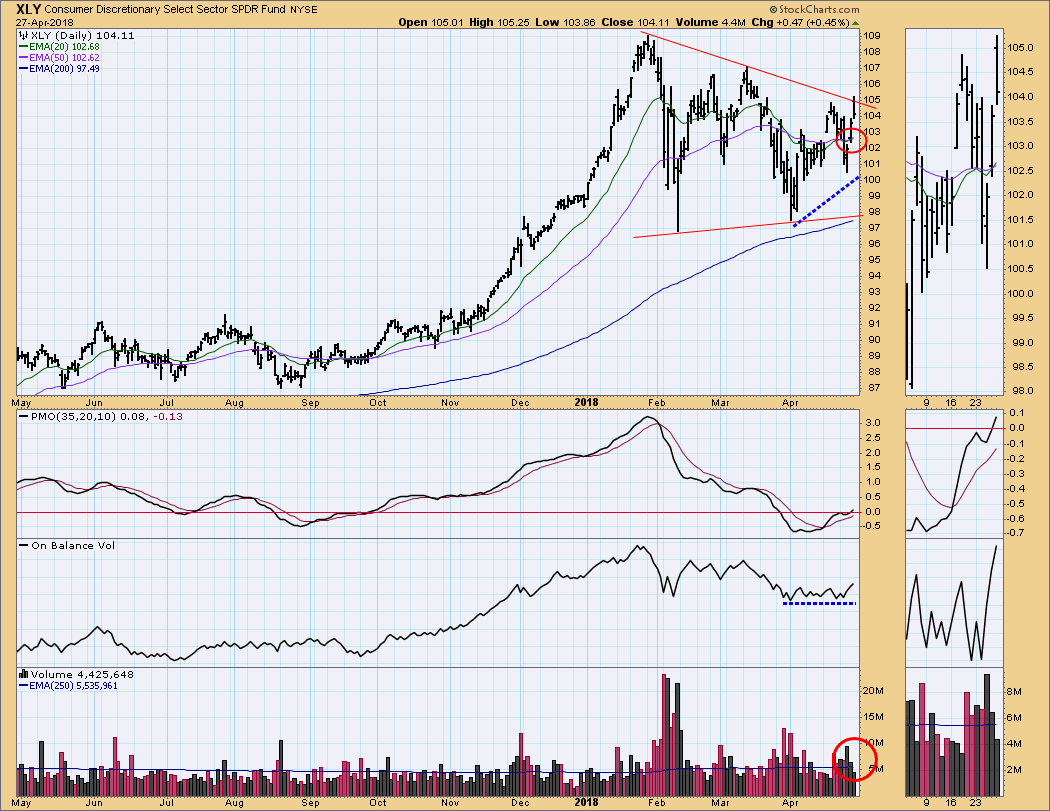
The Consumer Discretionary sector (XLY) switched from NEUTRAL to BUY when the 20EMA crossed up through the 50EMA. For me this is a low-confidence signal because XLY has been moving sideways, with price chopping above and below those EMAs with enough range to cause the dreaded whipsaw. Also undermining my confidence, On-Balance Volume (OBV) has been flat, failing to confirm the rising trend from this month's price low. (Rising price is not being driven by rising volume.) Finally, volume contracted today as price was trying to break out, and XLY closed near today's low.
The DecisionPoint Weekly Wrap presents an end-of-week assessment of the trend and condition of the stock market (S&P 500), the U.S. Dollar, Gold, Crude Oil, and Bonds.
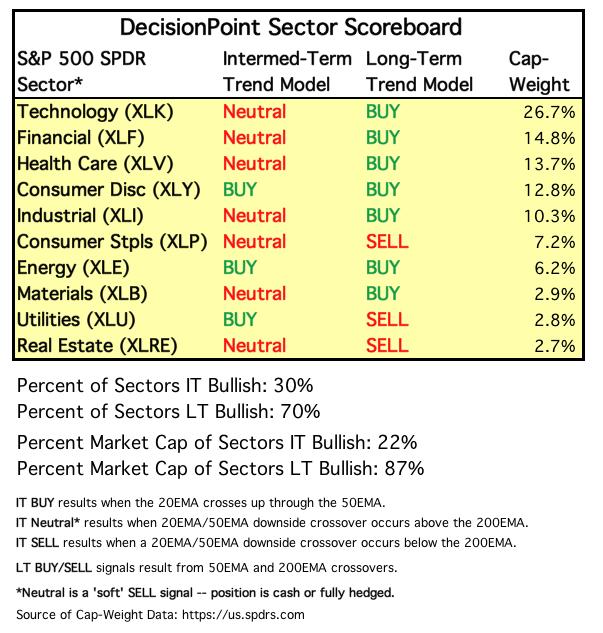
SECTORS
Each S&P 500 Index component stock is assigned to one, and only one, of 10 major sectors. This is a snapshot of the Intermediate-Term and Long-Term Trend Model signal status for those sectors.
STOCKS
IT Trend Model: NEUTRAL as of 3/23/2018
LT Trend Model: BUY as of 4/1/2016
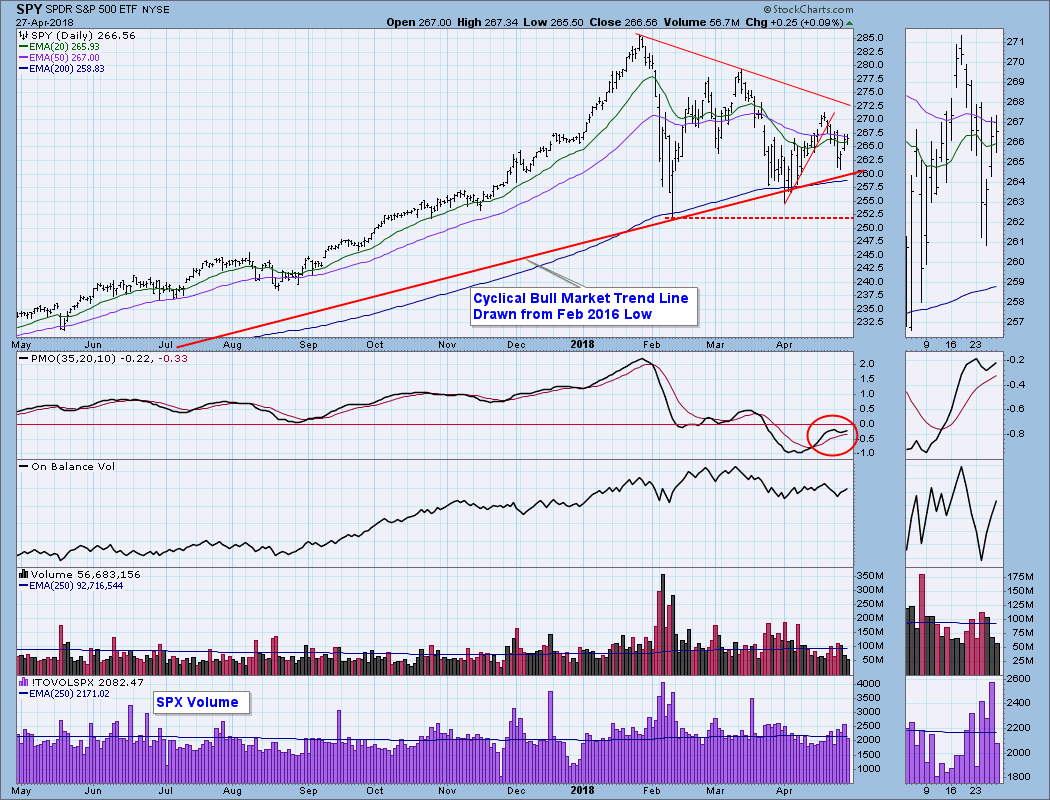
SPY Daily Chart: The symmetrical triangle is the dominant formation, and because it is symmetrical, it could resolve either up or down.
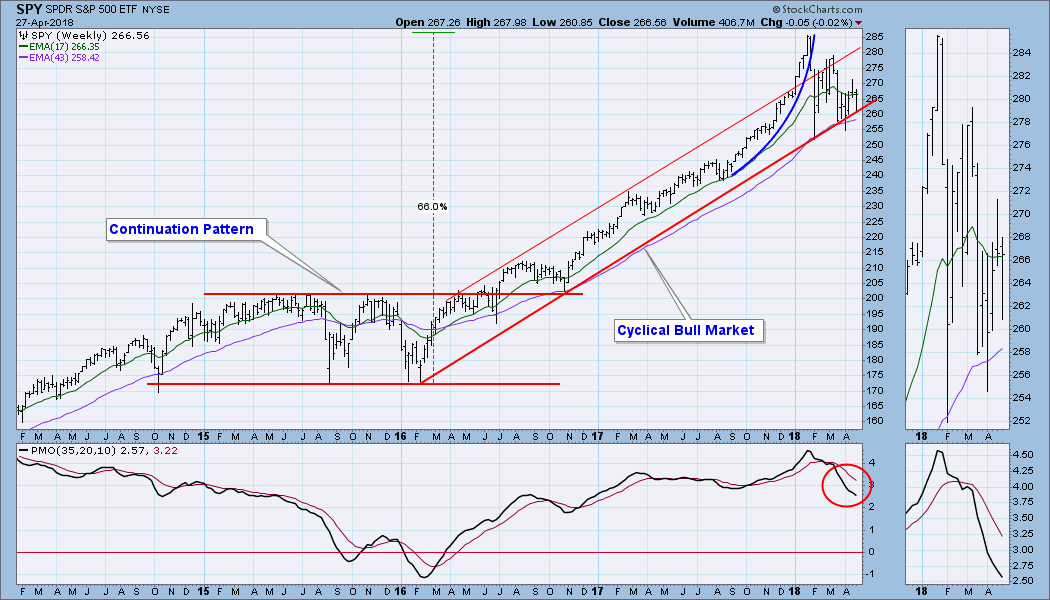
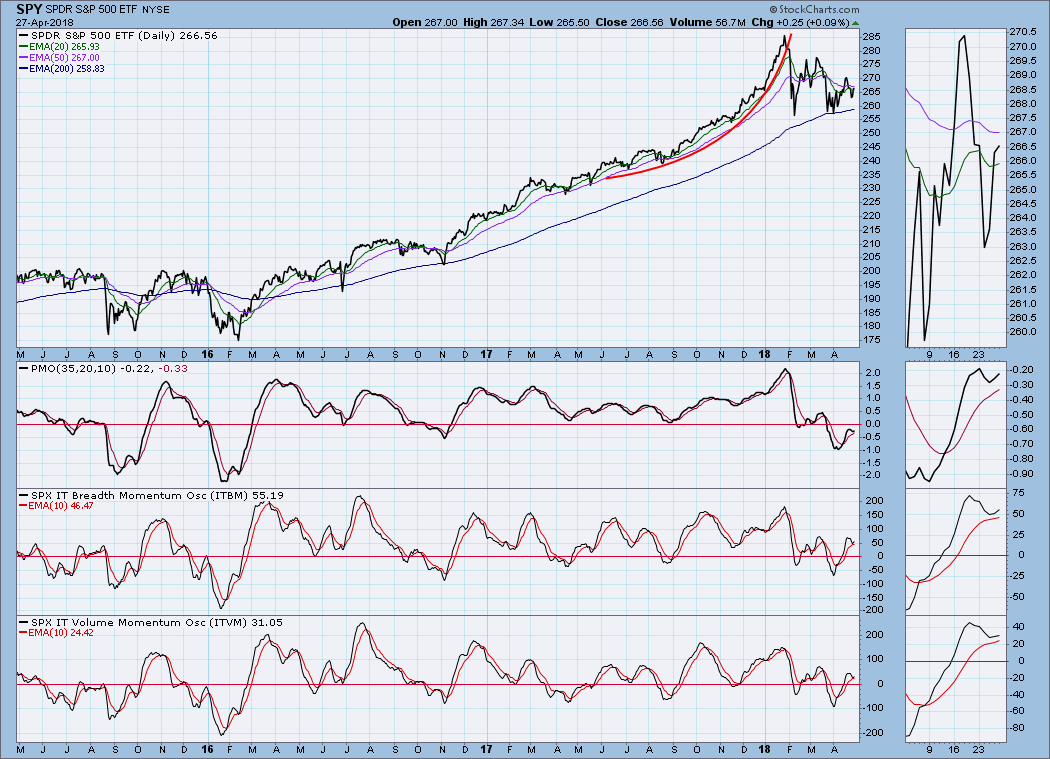
SPY Weekly Chart: SPY successfully retested the cyclical bull market rising trend line and rebounded. The weekly PMO is still falling.
Short-Term Market Indicators: The STO-B and STO-V are exactly neutral in their range. They are rising, and therefore positive.
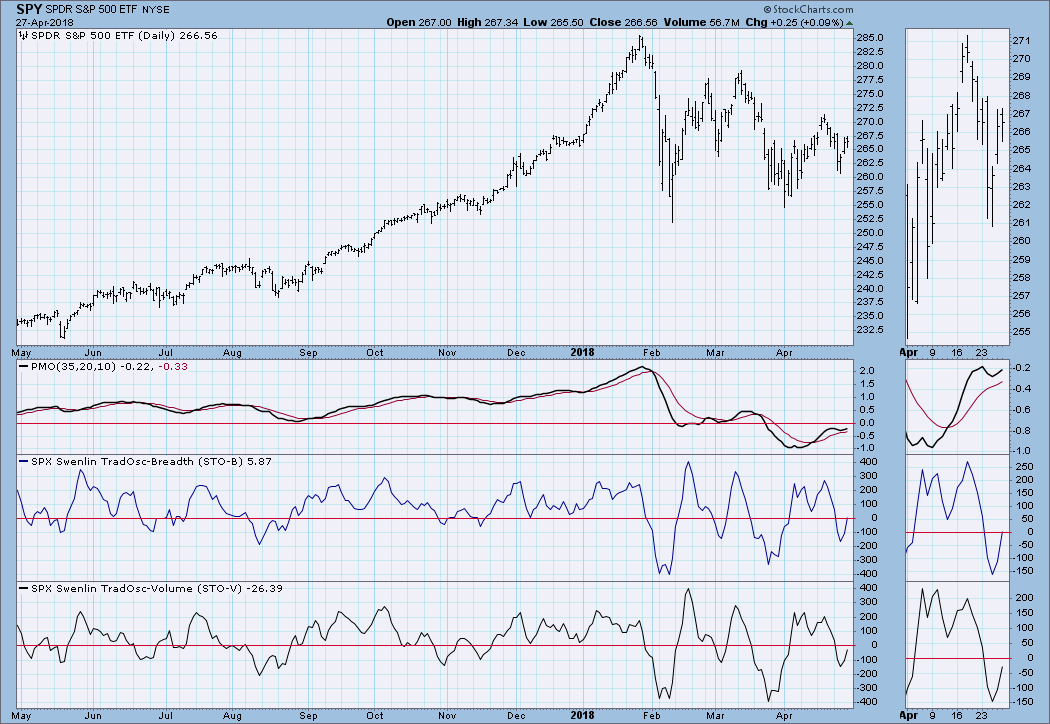
Intermediate-Term Market Indicators: The ITBM and ITVM are high-neutral and rising. Slightly positive.
Conclusion: The IT Trend Model for SPY is NEUTRAL, which in my opinion is just about perfect. I think we are in a bear market, but currently the market is moving sideways, forming a big continuation pattern. Being on the sidelines is a better posture than being short. Otherwise, since I think we're in a bear market, I drape that template over my decision-making process, and suddenly I have no interest in going long either.
DOLLAR (UUP)
IT Trend Model: BUY as of 4/24/2018
LT Trend Model: SELL as of 5/24/2017
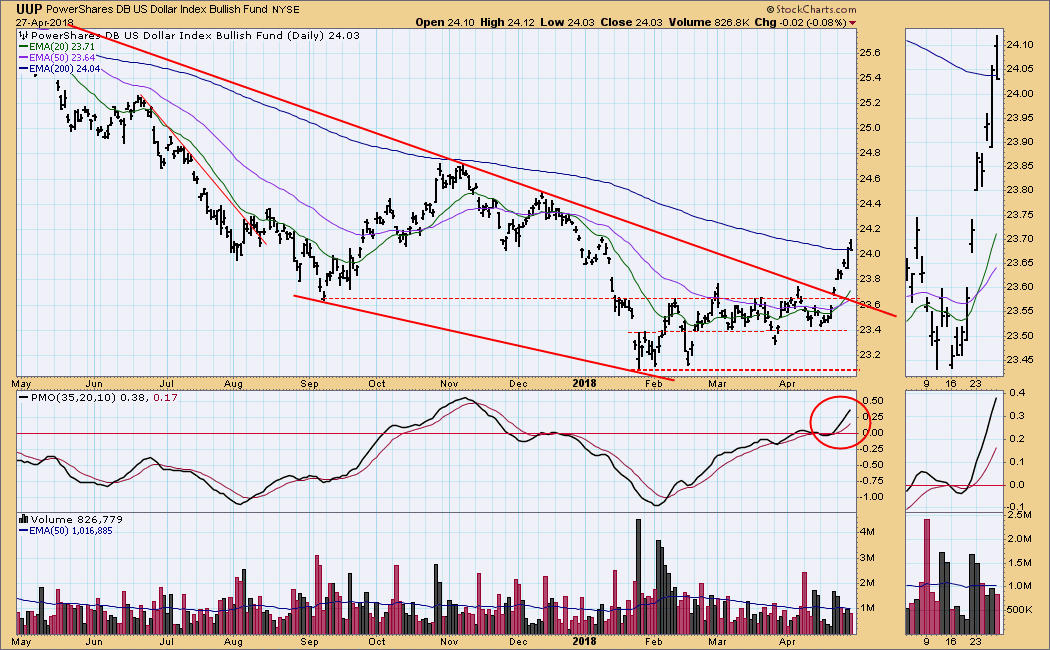
UUP Daily Chart: Last week UUP broke above the two-month trading range, but more importantly it also penetrated the long-term declining tops line, which is the top of a falling wedge formation. This week's rising price action removed any doubt regarding the efficacy of the breakout, although it is still short of being "decisive". The IT Trend Model changed from SELL to BUY.
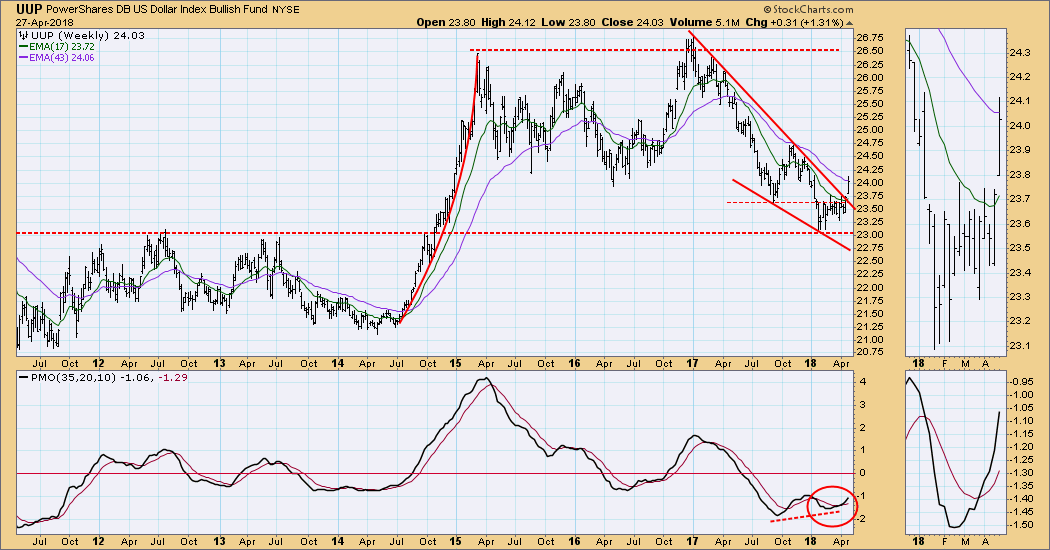
UUP Weekly Chart: The breakout looks even more dramatic in this time frame. While we expect falling wedge formations to resolve upward, it is not always clear how things will proceed after that has happened. This chart looks very positive, in my opinion, and I expect that a rising trend will eventually be established.
GOLD
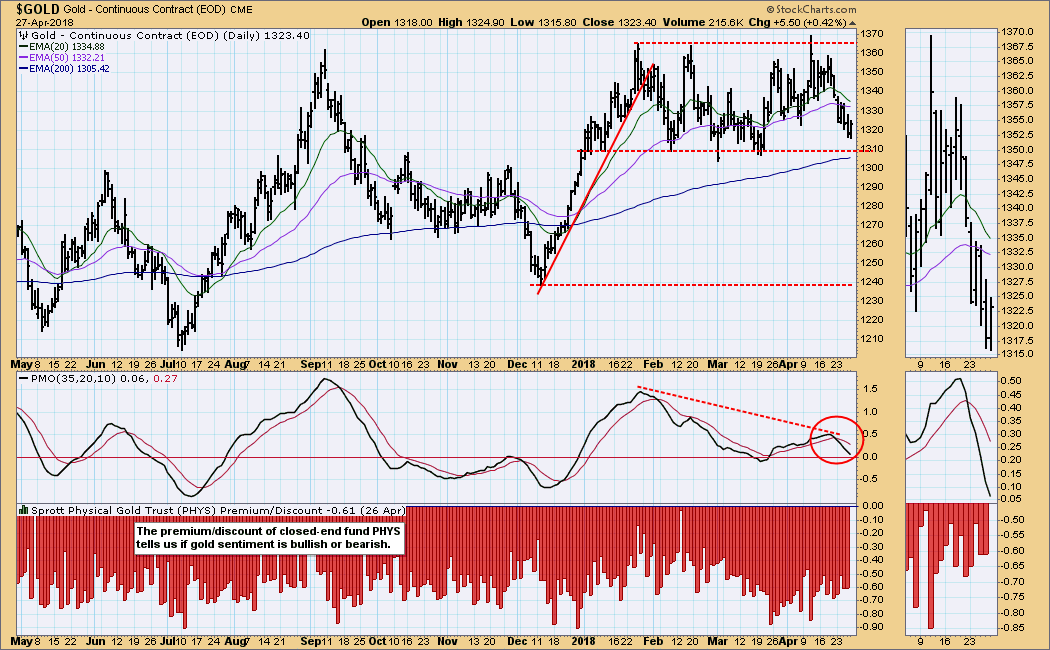
IT Trend Model: BUY as of 1/2/2018
LT Trend Model: BUY as of 4/12/2017
GOLD Daily Chart: The strength in the dollar is taking a toll on gold. While IT and LT Trend Model BUY signals are in effect, it is highly likely that this positive status will be eroded as the dollar continues to rally. The PMO negative divergence reinforces this outlook.
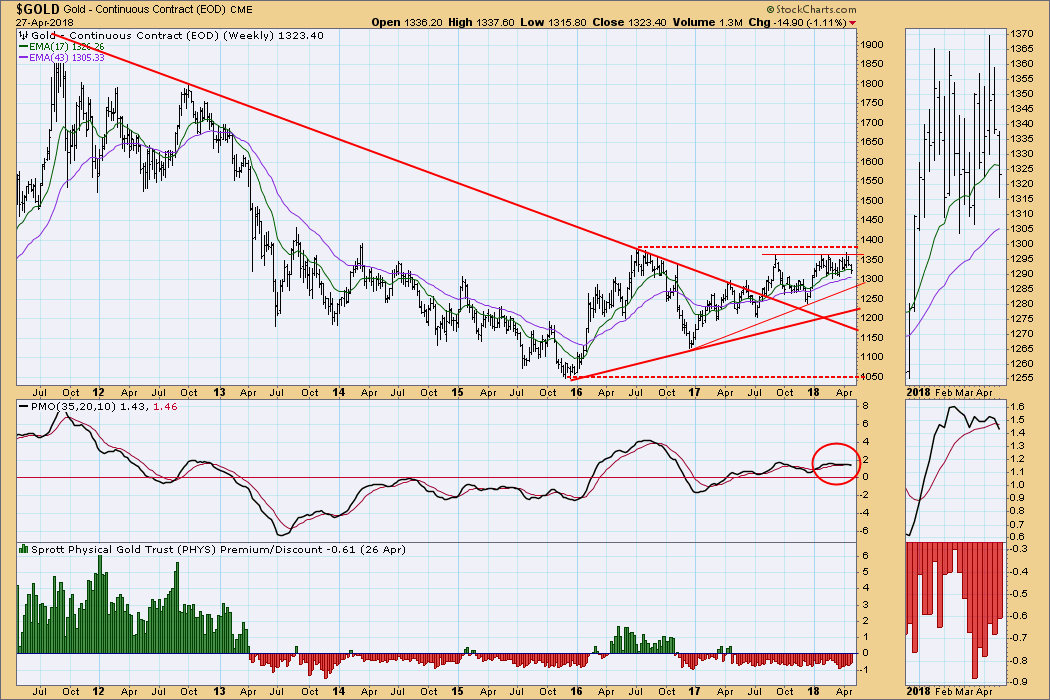
GOLD Weekly Chart: The weekly PMO has topped and crossed down through the signal line.
CRUDE OIL (USO)
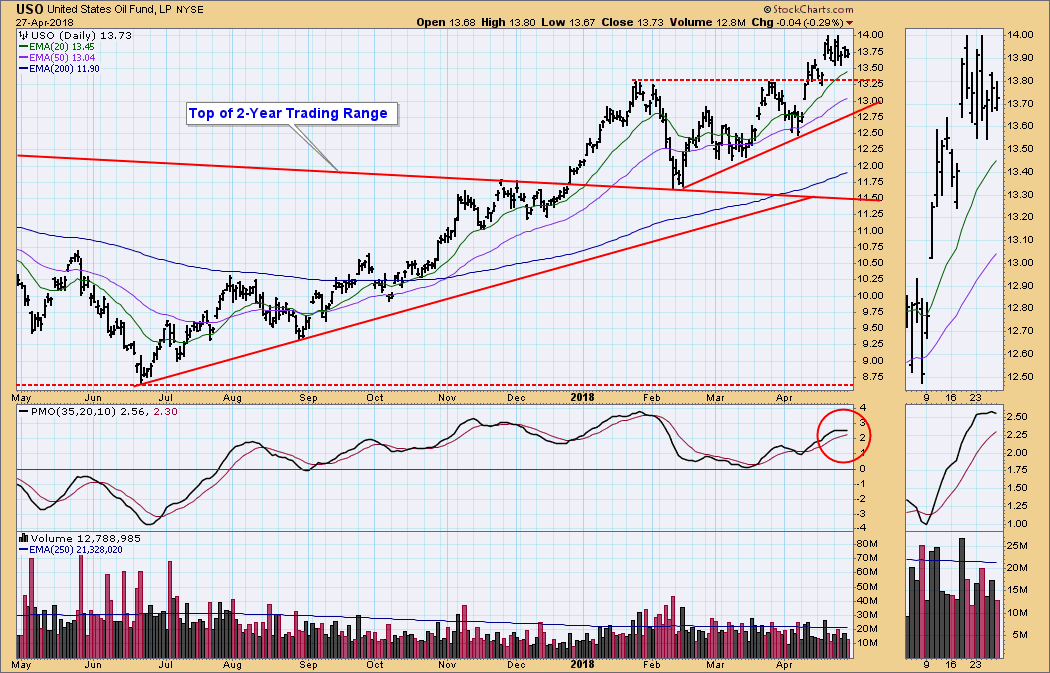
IT Trend Model: BUY as of 9/6/2017
LT Trend Model: BUY as of 11/2/2017
USO Daily Chart: After breaking out of the two-year trading range in December, there was a full snapback to the point of breakout. From the February low an up trend began, and USO recently broke above resistance at 13.30. The daily PMO is trying to top, so another pullback could materialize.
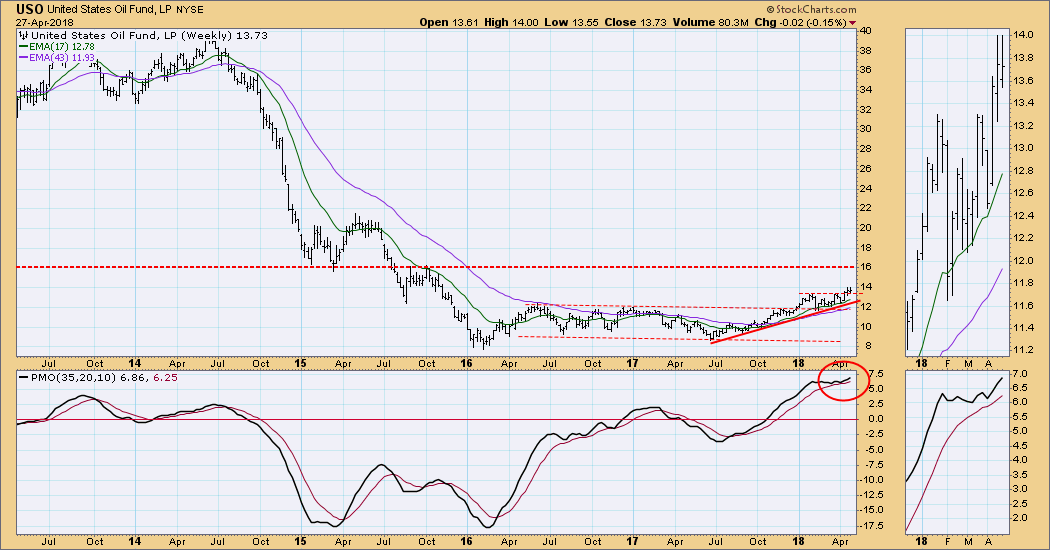
USO Weekly Chart: The importance of the breakout above 13.30 is obvious in this longer time frame, and we can see that 16.00 is the most obvious level where overhead resistance could be encountered.
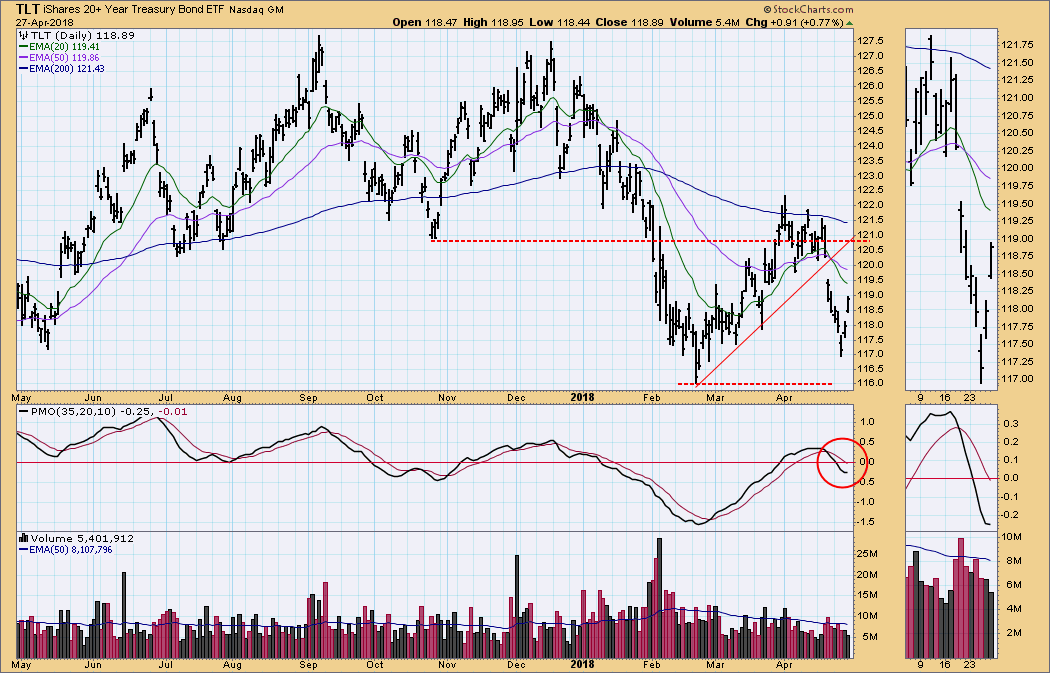
BONDS (TLT)
IT Trend Model: SELL as of 4/20/2018
LT Trend Model: SELL as of 2/8/2018
TLT Daily Chart: After continuing last week's breakdown, TLT then bounced back from Wednesday's low. Perhaps all this choppiness has something to do with the Fed announcement due next Wednesday.
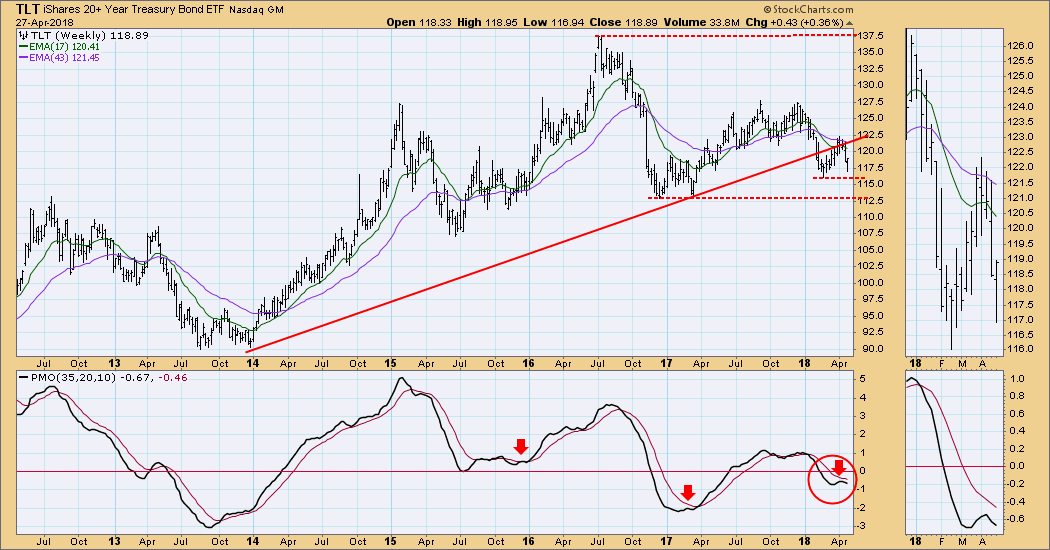
TLT Weekly Chart: When the PMO tops below the signal line, I normally interpret it as very bearish; however, last week I pointed out on the chart where on two previous occasions the bearish PMO tops actually occurred near the end of price declines. This week it looks as if TLT may have completed a retest of support near the February low, but we need to see the weekly PMO turn up again to confirm that.
**Don't miss any of the DecisionPoint commentaries! Go to the "Notify Me" box toward the end of this blog page to be notified as soon as they are published.**
Technical Analysis is a windsock, not a crystal ball.
Happy Charting!
- Carl
NOTE: The signal status reported herein is based upon mechanical trading model signals, specifically, the DecisionPoint Trend Model. They define the implied bias of the price index based upon moving average relationships, but they do not necessarily call for a specific action. They are information flags that should prompt chart review. Further, they do not call for continuous buying or selling during the life of the signal. For example, a BUY signal will probably (but not necessarily) return the best results if action is taken soon after the signal is generated. Additional opportunities for buying may be found as price zigzags higher, but the trader must look for optimum entry points. Conversely, exit points to preserve gains (or minimize losses) may be evident before the model mechanically closes the signal.
Helpful DecisionPoint Links:
DecisionPoint Shared ChartList and DecisionPoint Chart Gallery
Price Momentum Oscillator (PMO)
Swenlin Trading Oscillators (STO-B and STO-V)
