All of our monthly charts went "final" today so it is time for a review of the current signals and their implications. The DecisionPoint Scoreboards show BUY signals on all of the four major indexes and that is not changing today. However the DP Scoreboards don't necessarily reveal the current strength of those signals. One thing that is important to note, the Long-Term Trend Model signals are derived from the 50/200-EMA crossovers on the DAILY chart. I recommend you go read Carl's Weekly Wrap from Friday to understand the LT Trend Model signals.
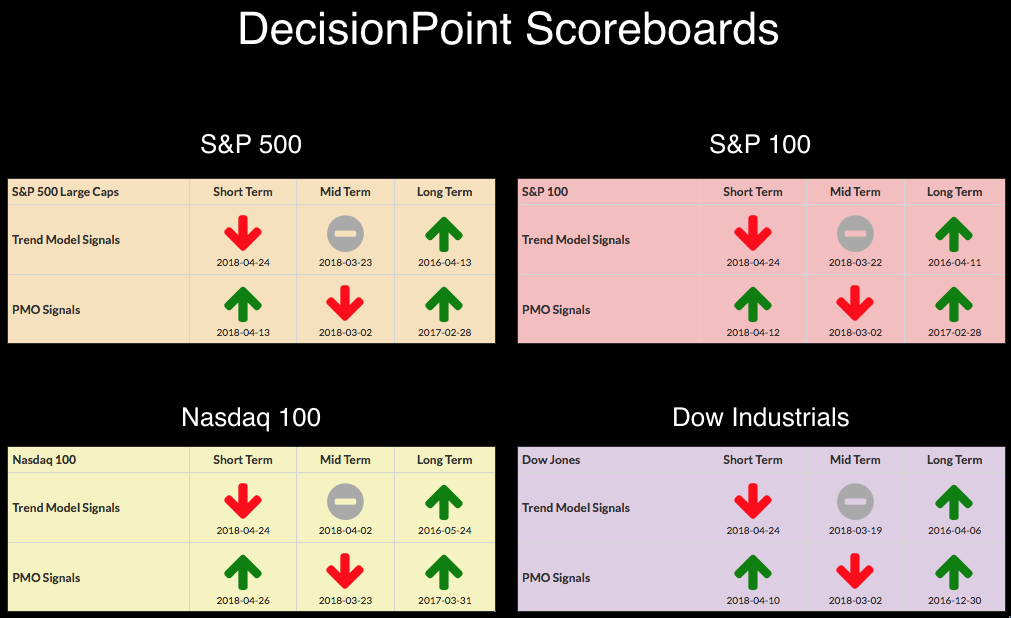
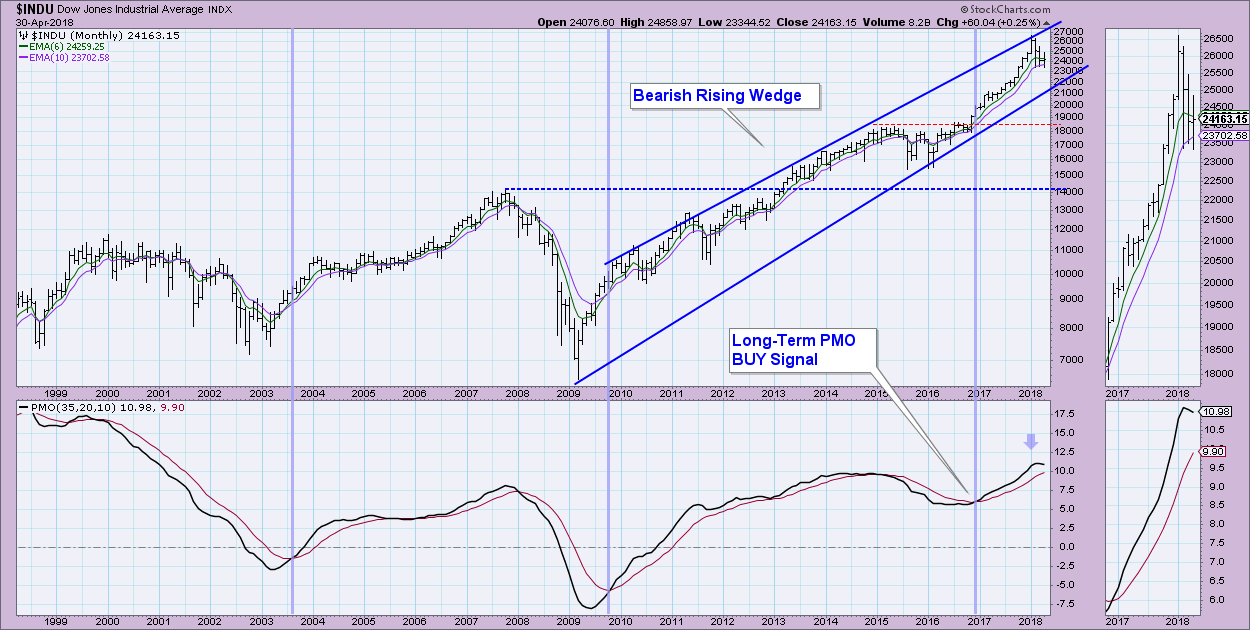
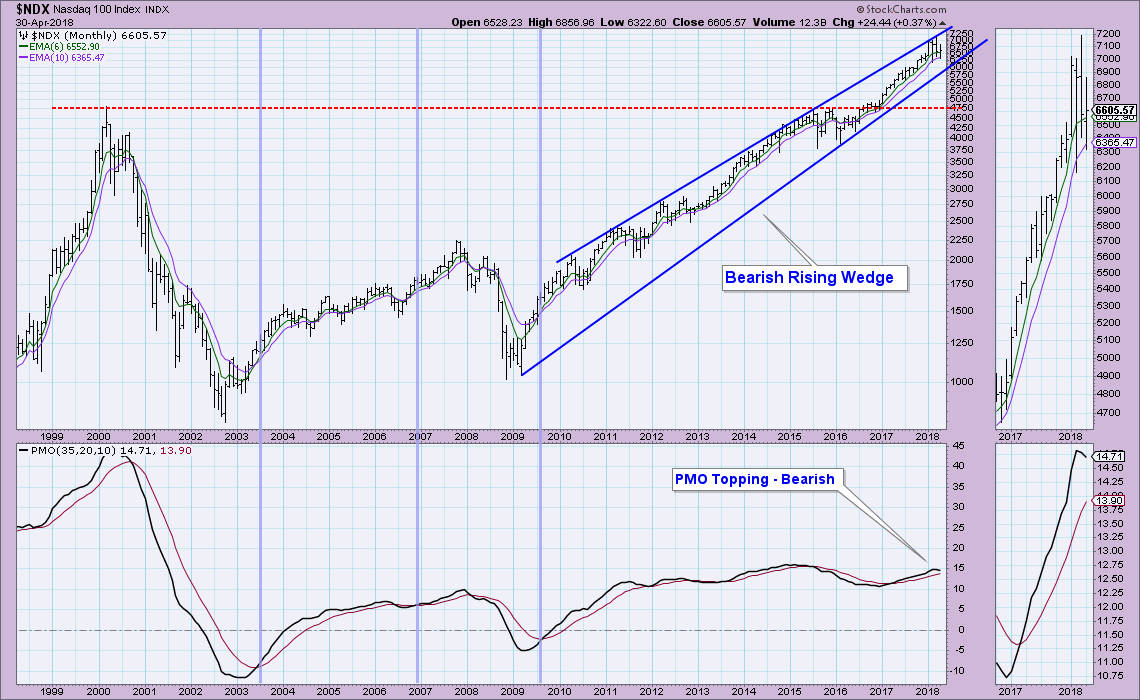
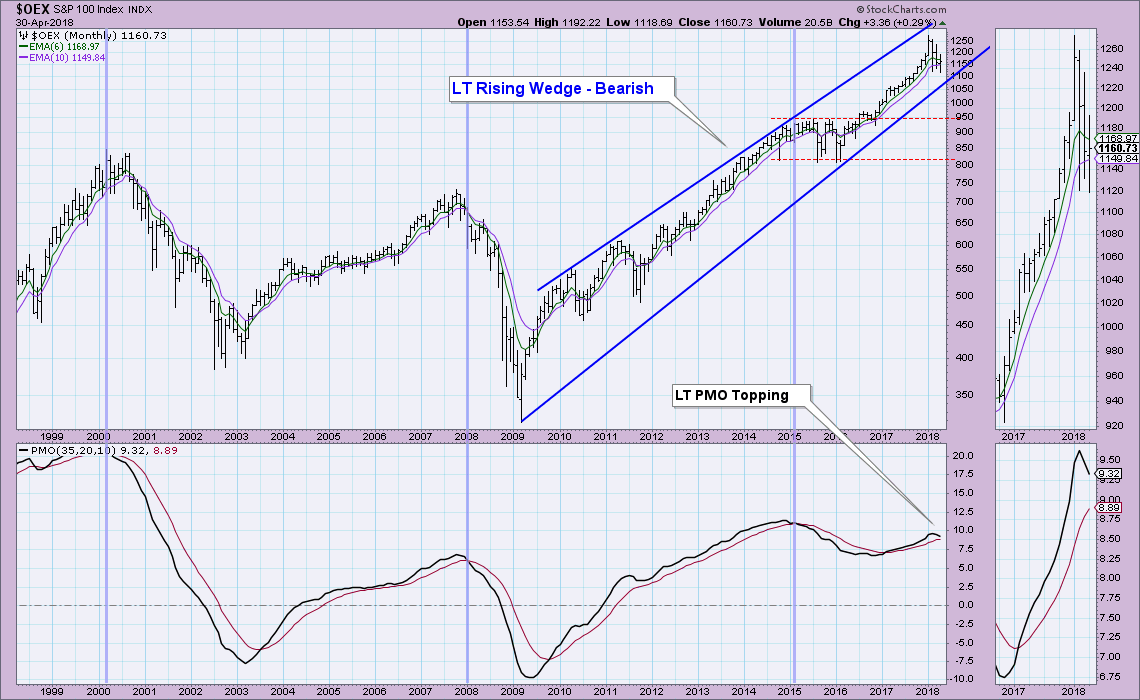
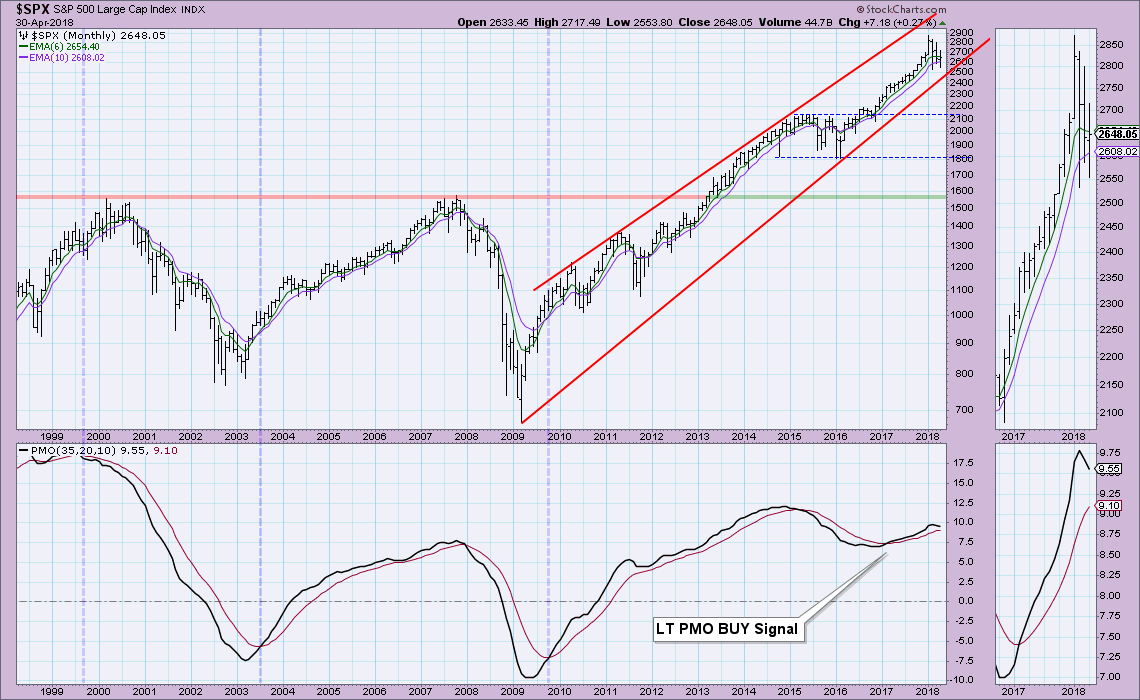
Let's first review the four Scoreboard indexes. The most important characteristics on all four of these monthly charts are the bearish rising wedges and the PMOs that have all topped. The Long-Term PMO signals on the DP Scoreboards are determined by crossovers of the monthly PMO. We still have some margin between the LT PMOs and signal lines on large-cap indexes. The monthly PMO tends to move more slowly but seeing them in decline for another month is concerning. The rising bottom trendlines drawn from 2009 lows are in play.
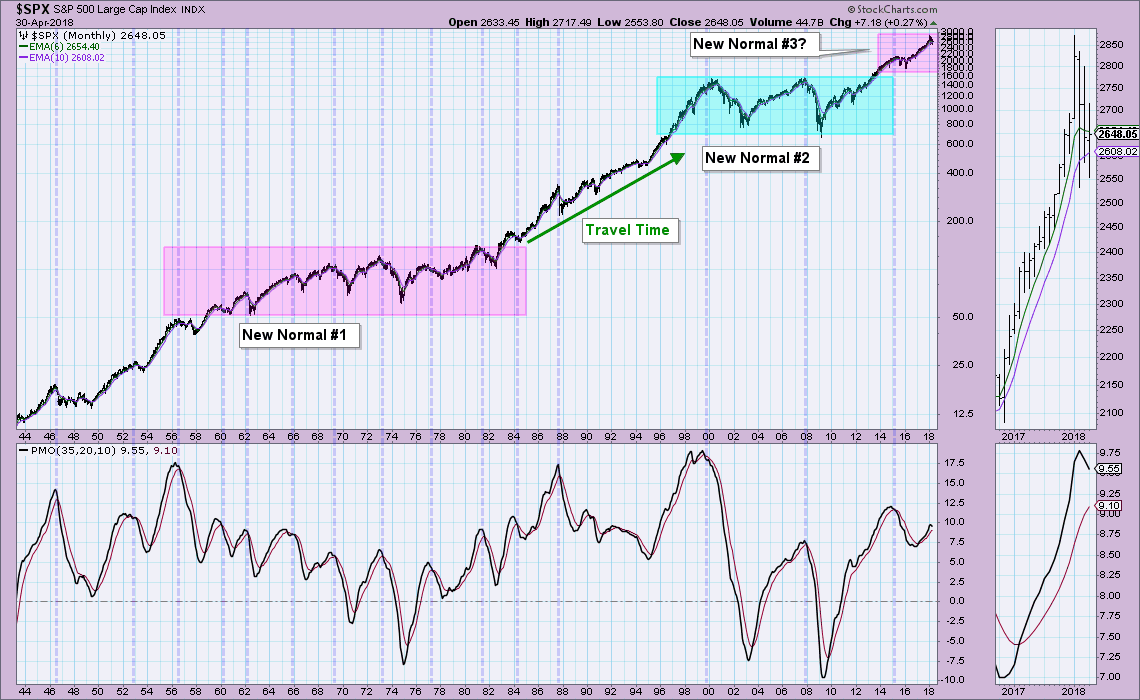
I've included the longer-term monthly chart below to show my thoughts on where we could be in the very big pictured. My thought is that we experienced long periods of 'normality' within the overall rising market and that we are now possibly traveling in a new normal for the cyclical bull and bear markets. I'm NOT suggesting a drop to the bottom of this new range is probable, even if we do enter or have entered a bear market; I'm thinking (writing) out loud. As noted above, the declining monthly PMOs and bearish chart patterns are the important take-aways from this blog.
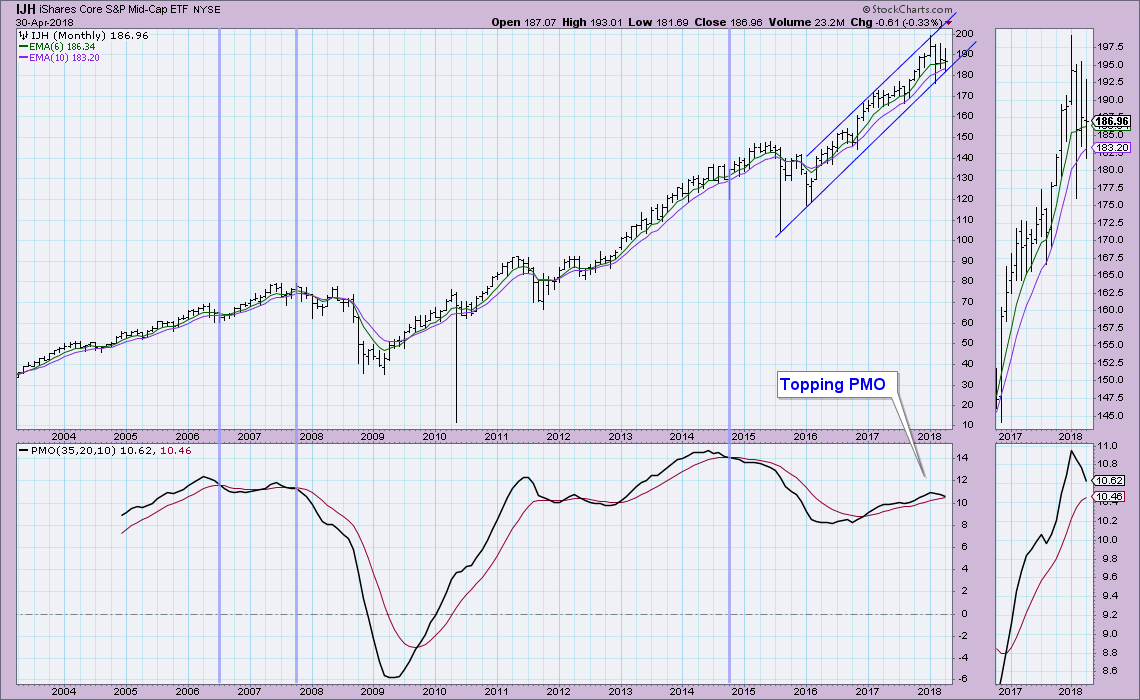
The picture for mid-caps shows that the rising bottoms trendline is being tested right now. The monthly PMO is closing in on a SELL signal.
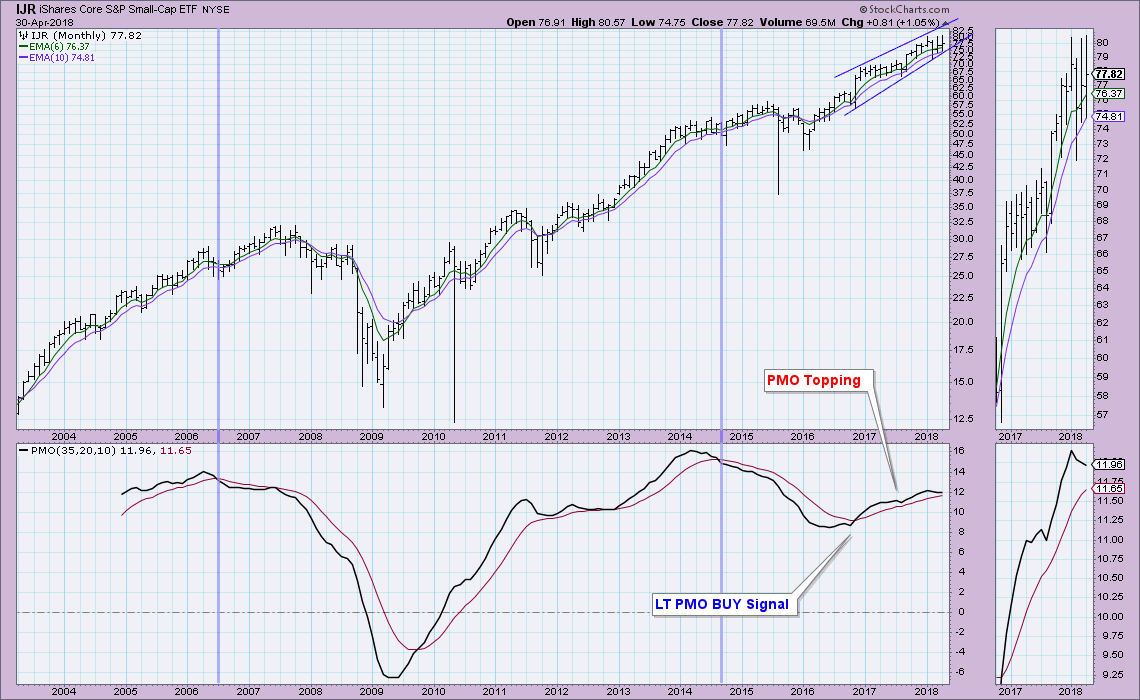
Similar picture for small-caps only I see a bearish rising wedge on this chart. The monthly PMO has topped which suggests that rising bottoms trendline will be broken.
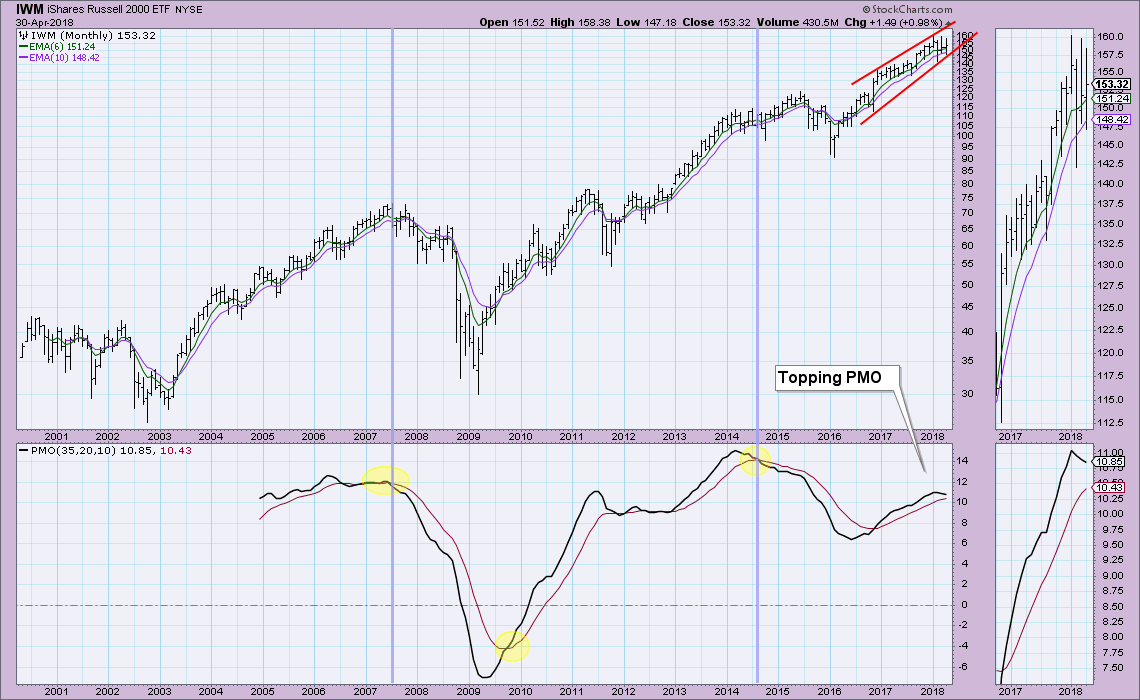
Russell 2000 also shows a bearish rising wedge and topping PMO. Note also that this PMO top is below the previous, yet price is showing rising bottoms across that same period. That is considered a bearish divergence.
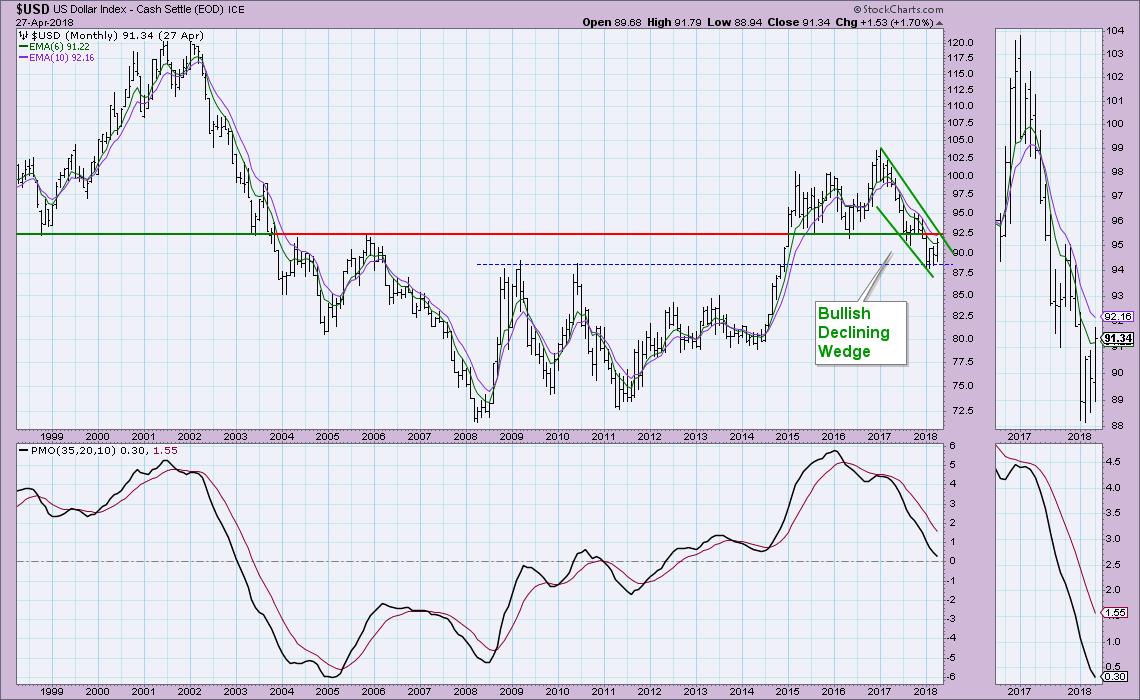
Let's take a look at the "Big Four". I've been bullish on the Dollar for quite some time and I'm happy that it has broken out on the daily chart. The bullish declining wedge hasn't executed and I do note very strong resistance at about 92.50. I suspect the pattern will execute next month. The monthly PMO is fairly ugly as it declines, but it is still technically in neutral territory. If we get a decisive breakout above 92.50, I wouldn't worry too much about the monthly PMO.
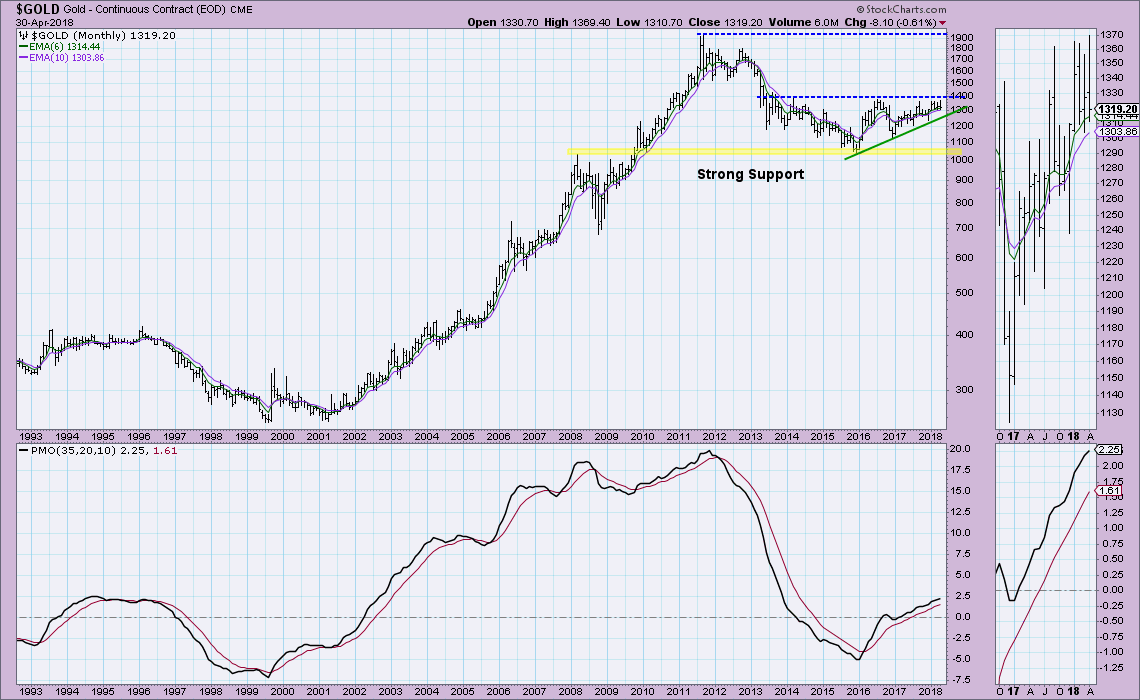
Gold has been struggling again overhead resistance at 1400 since 2013/2014. The pattern is an ascending triangle which is bullish and the PMO is rising nicely. While this chart has bullish implications, the strengthening of the Dollar and the failed tests at 1365 for Gold will weigh heavy. Additionally, Carl noted a new IT PMO SELL signal on the weekly chart for Gold.
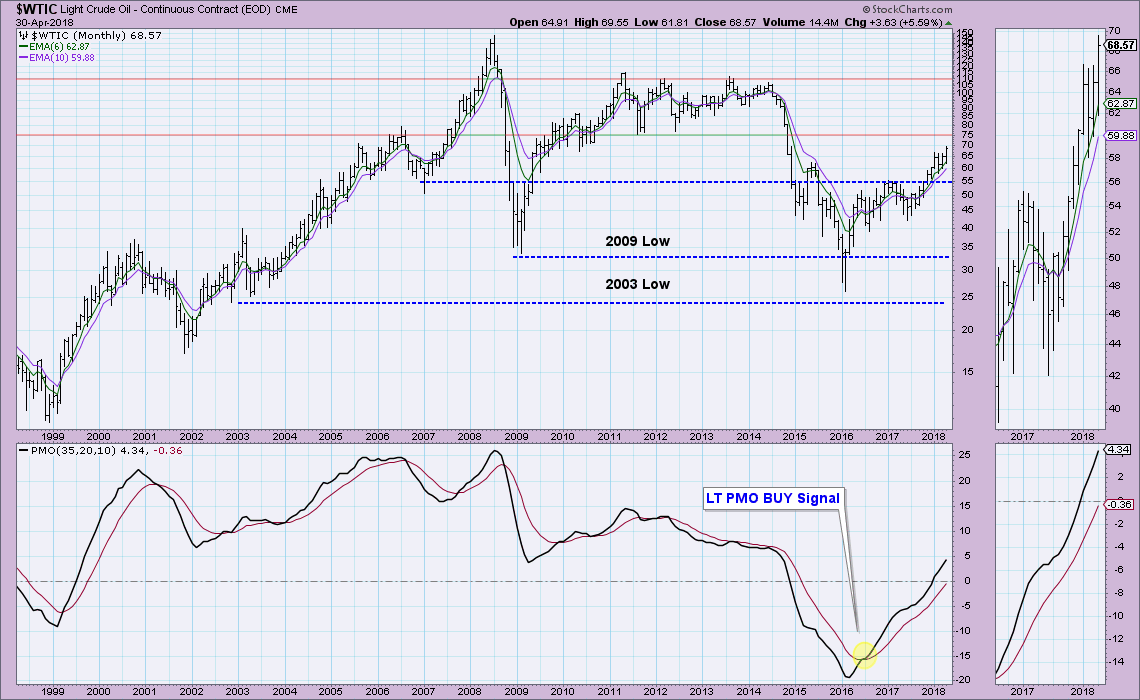
Oil has been enjoying a nice rally since mid-2017 and I don't think it is over yet. The next area of strongish resistance is at $75. I'm looking for a test there.
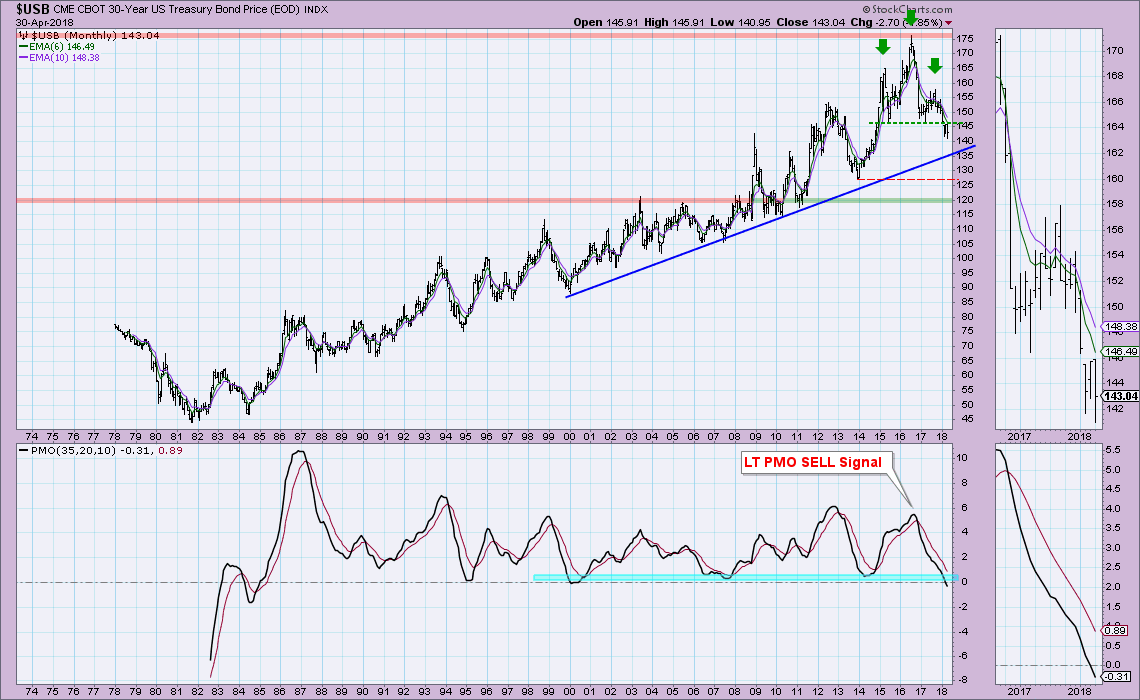
The massive head and shoulders pattern on Bonds has triggered with the breakdown below the neckline around $145. While support isn't far away along the rising bottoms trendline, notice the PMO has now hit negative territory for the first time since early 2000. If the head and shoulders fulfills the pattern, the minimum downside target is around $115-$120.
To summarize my long-term view:
Large-cap indexes - Neutral - While we see topping PMOs and bearish chart patterns, we are still technically on a LT BUY signal on daily charts and rising bottoms support isn't being tested yet.
Mid and small-cap indexes - Neutral to Bearish - Same problems as large-cap monthly charts, but unlike large-caps, they are now testing rising bottoms support.
Dollar - Bullish
Gold - Bearish
Oil - Bullish
Bonds - Bearish
Helpful DecisionPoint Links:
DecisionPoint Shared ChartList and DecisionPoint Chart Gallery
Price Momentum Oscillator (PMO)
Swenlin Trading Oscillators (STO-B and STO-V)
Technical Analysis is a windsock, not a crystal ball.
Happy Charting!
- Erin
**Don't miss DecisionPoint Commentary! Add your email below to be notified of new updates"**
