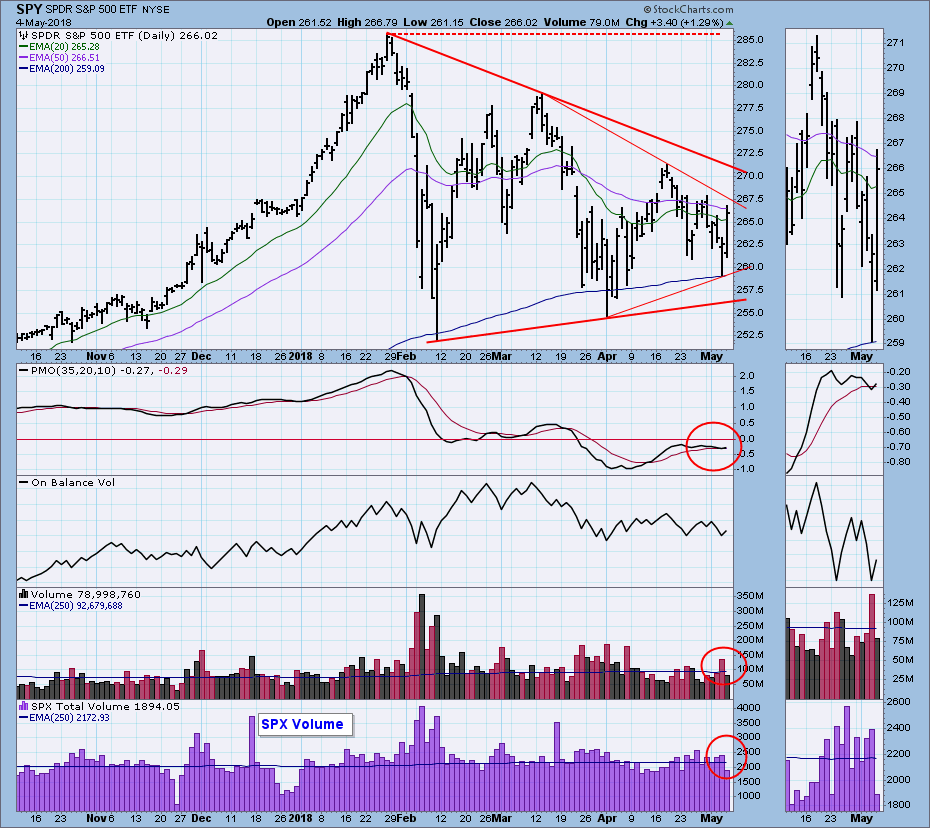
On Thursday the market recovered nicely from an early selloff, and today it had a strong finish. But in the market, volume equals love, and the short volume on Friday was barely a peck on the cheek. On my SPY chart I like to show, in addition to SPY volume, volume for the S&P 500, and the benchmark is the 250EMA of volume. In this case both gave a resounding "meh." Despite some interim excitement, the market was virtually unchanged for the week.
The DecisionPoint Weekly Wrap presents an end-of-week assessment of the trend and condition of the stock market (S&P 500), the U.S. Dollar, Gold, Crude Oil, and Bonds.
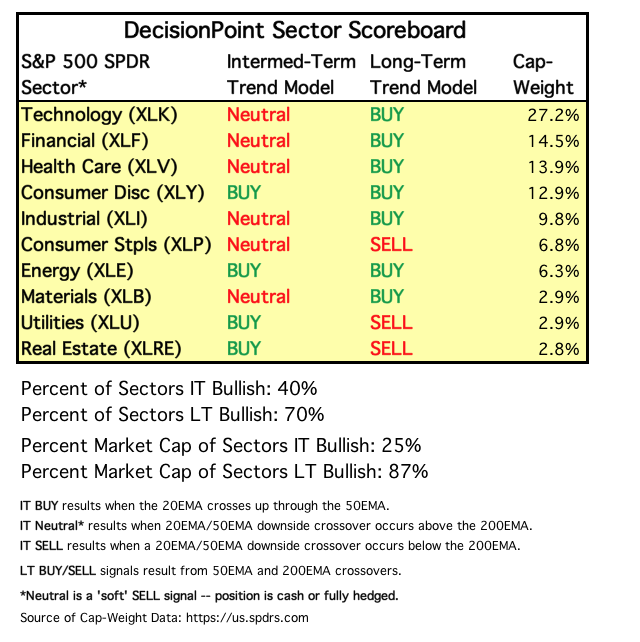
SECTORS
Each S&P 500 Index component stock is assigned to one, and only one, of 10 major sectors. This is a snapshot of the Intermediate-Term and Long-Term Trend Model signal status for those sectors.
This week Real Estate (XLRE) changed from an IT Trend Model SELL to BUY.
STOCKS
IT Trend Model: NEUTRAL as of 3/23/2018
LT Trend Model: BUY as of 4/1/2016
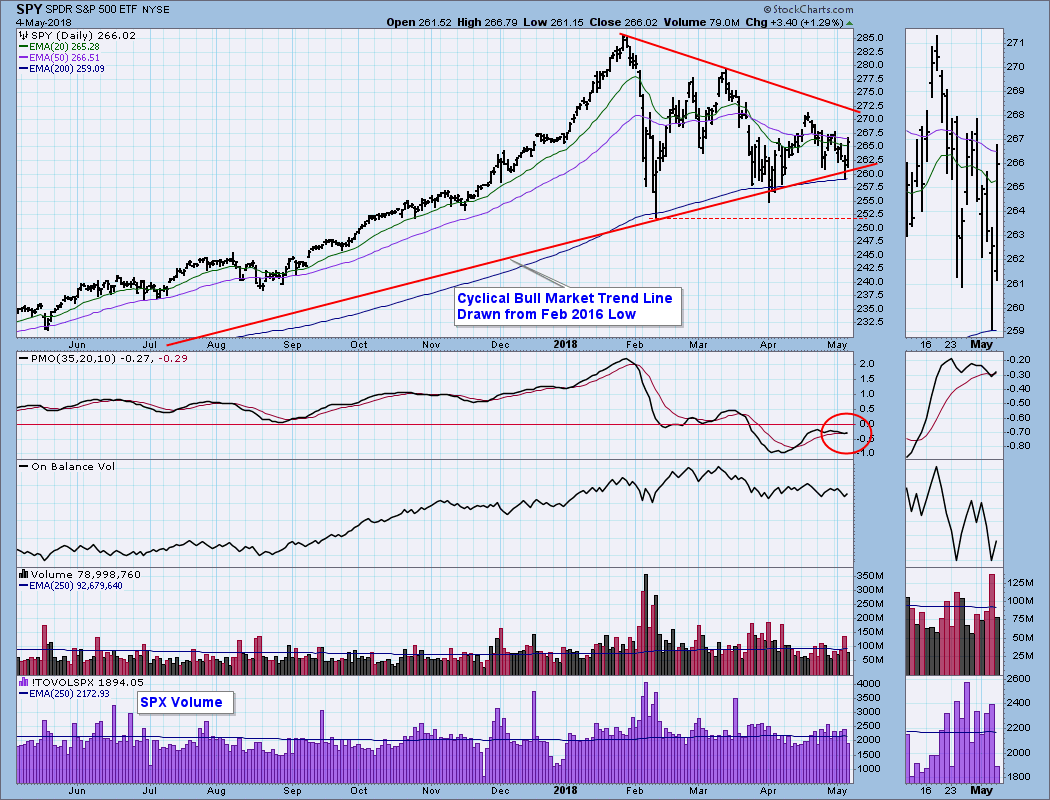
SPY Daily Chart: Since the January price top, the market has been moving sideways and forming a symmetrical triangle. The failure of the April rally to reach the top of the triangle implies weakness. The daily PMO changed direction six times in the last two weeks. While I said that a symmetrical triangle had formed, it is not quite symmetrical. The bottom side of the triangle is flatter than the top side, which favors a downside resolution of the pattern.
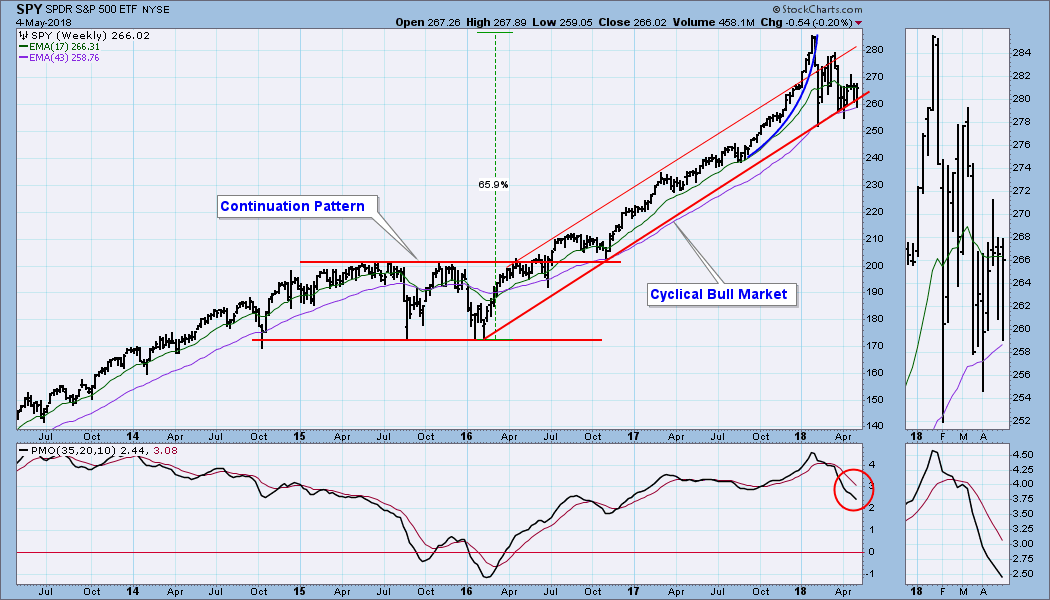
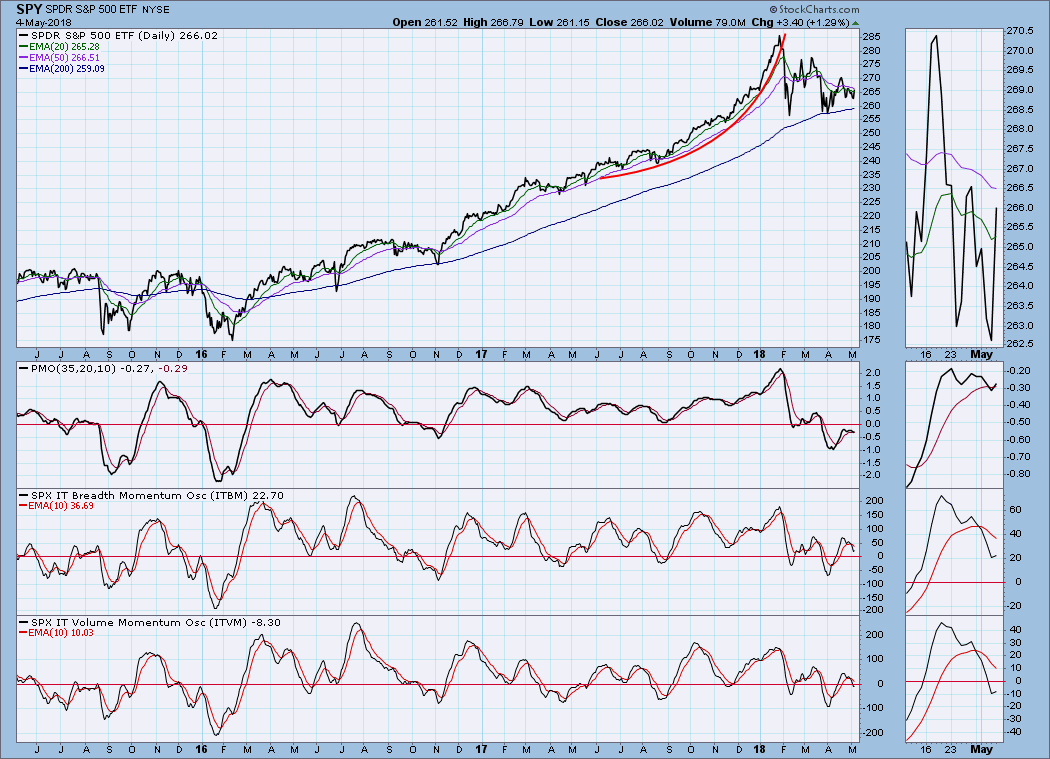
SPY Weekly Chart: The weekly PMO continues to fall, but price remains within the cyclical bull market rising trend channel.
Short-Term Market Indicators: The STO-B and STO-V are not very useful at this point. They are only modestly oversold, and have changed direction five times in the last two weeks.
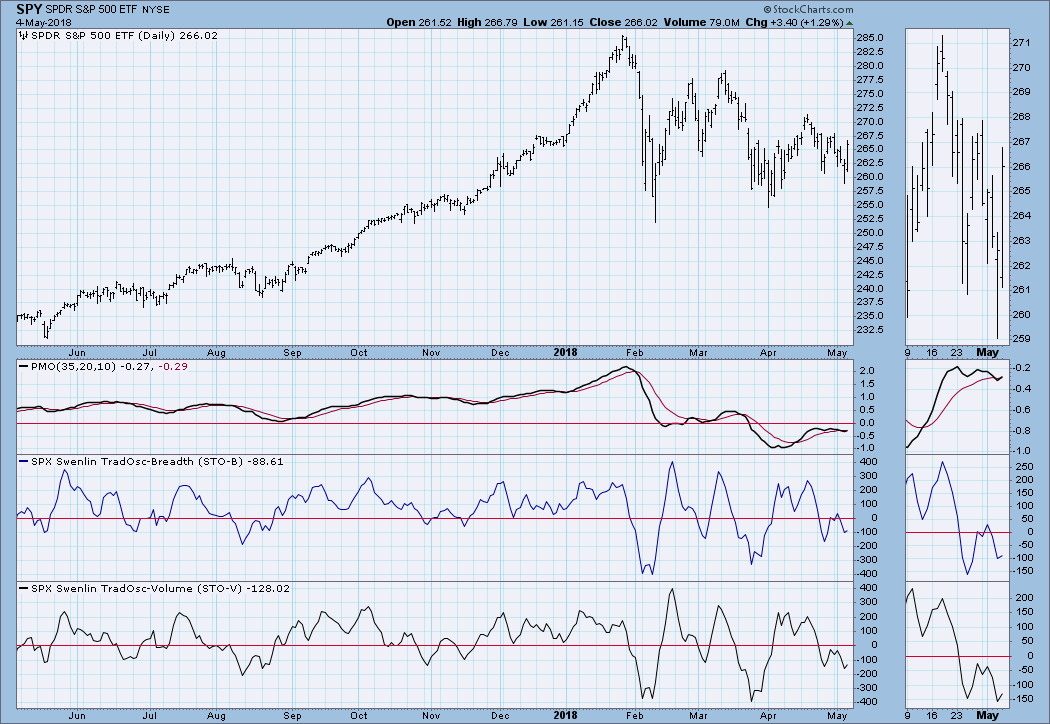
Intermediate-Term Market Indicators: The ITBM and ITVM are in the neutral zone.
Conclusion: While I think we have entered a bear market, it is clear that, at the very least, the market is in a correction mode. As a practical matter, is there really any difference? The IT Trend Model being NEUTRAL suggests being in cash or fully hedged. Bull or bear, that is a reasonable approach in either circumstance.
DOLLAR (UUP)
IT Trend Model: BUY as of 4/24/2018
LT Trend Model: SELL as of 5/24/2017
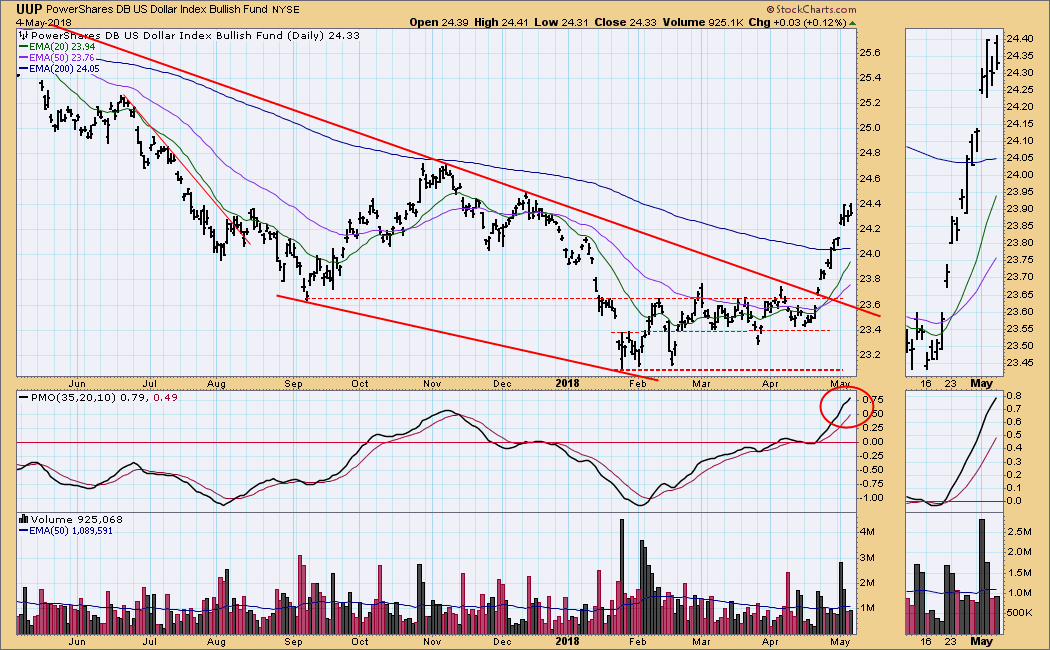
UUP Daily Chart: UUP began the week with another gap up, then consolidated the rest of the week.
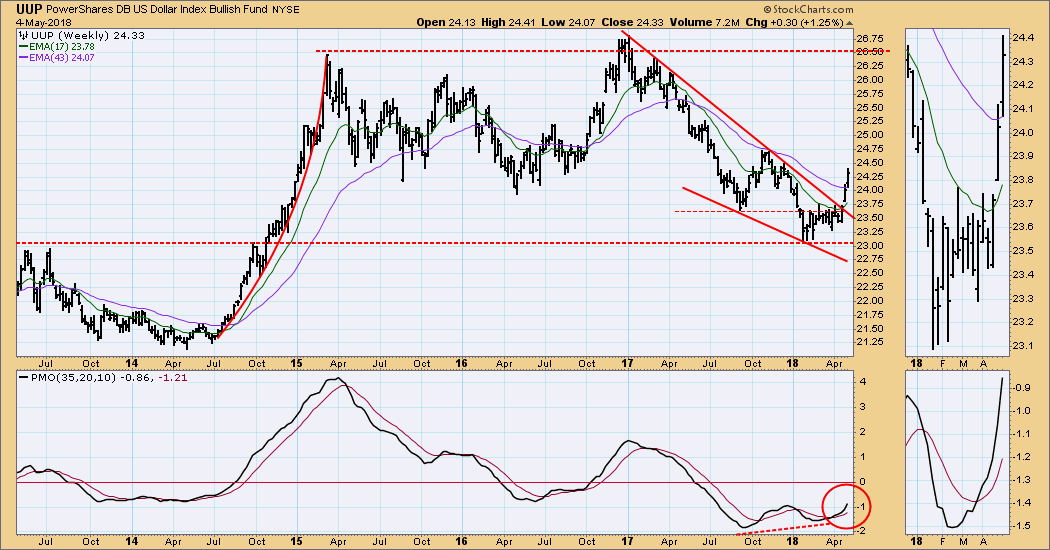
UUP Weekly Chart: In this time frame the breakout from the falling wedge formation is quite dramatic, and it appears that a strong up move has begun.
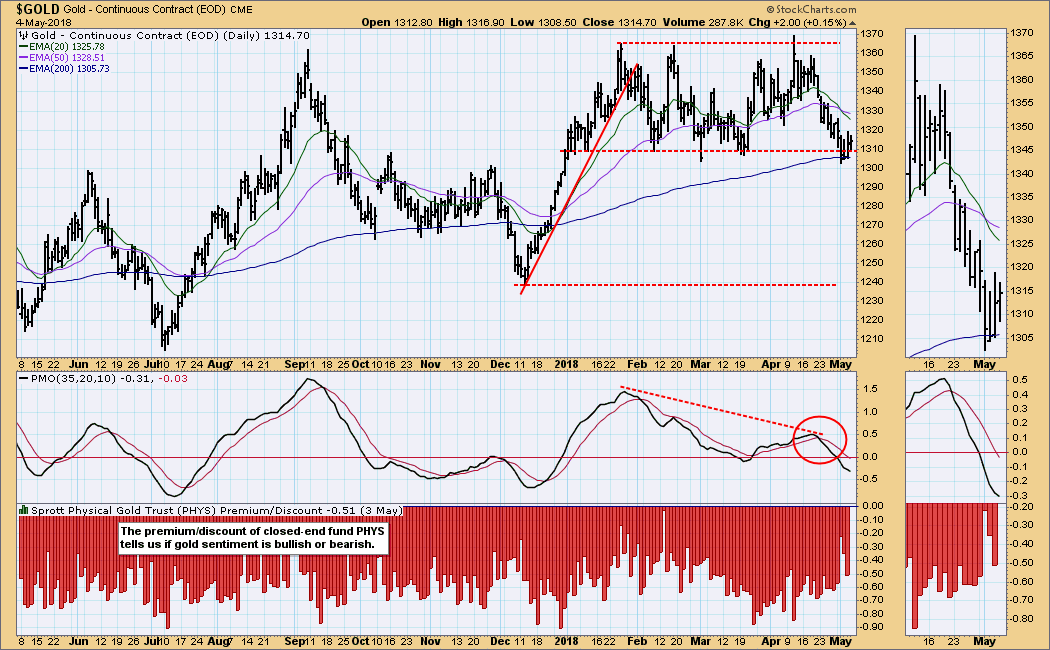
GOLD
IT Trend Model: NEUTRAL as of 5/2/2018
LT Trend Model: BUY as of 4/12/2017
GOLD Daily Chart: Thanks to strength in the dollar, on Tuesday the IT Trend Model for gold changed from BUY to NEUTRAL, because the 20EMA/50EMA downside crossover took place above the 200EMA. If the dollar continues to advance, gold will suffer.
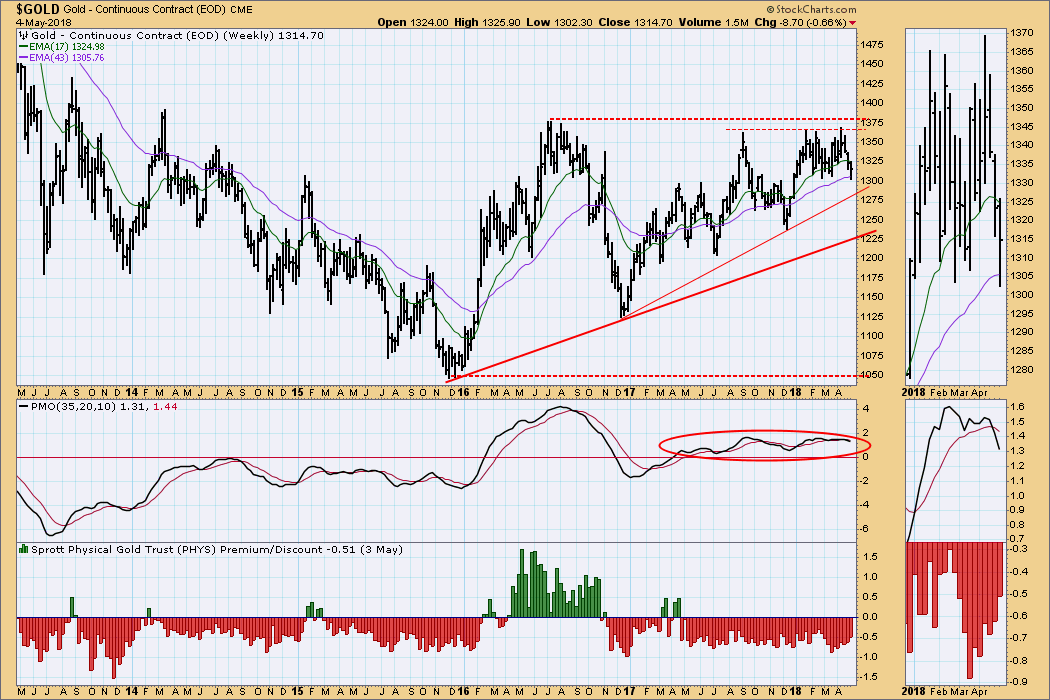
GOLD Weekly Chart: Gold still looks positive on the weekly chart. While the weekly PMO has crossed down through the signal line, we can see that the PMO remains in positive territory in a flat configuration that it has held for about a year.
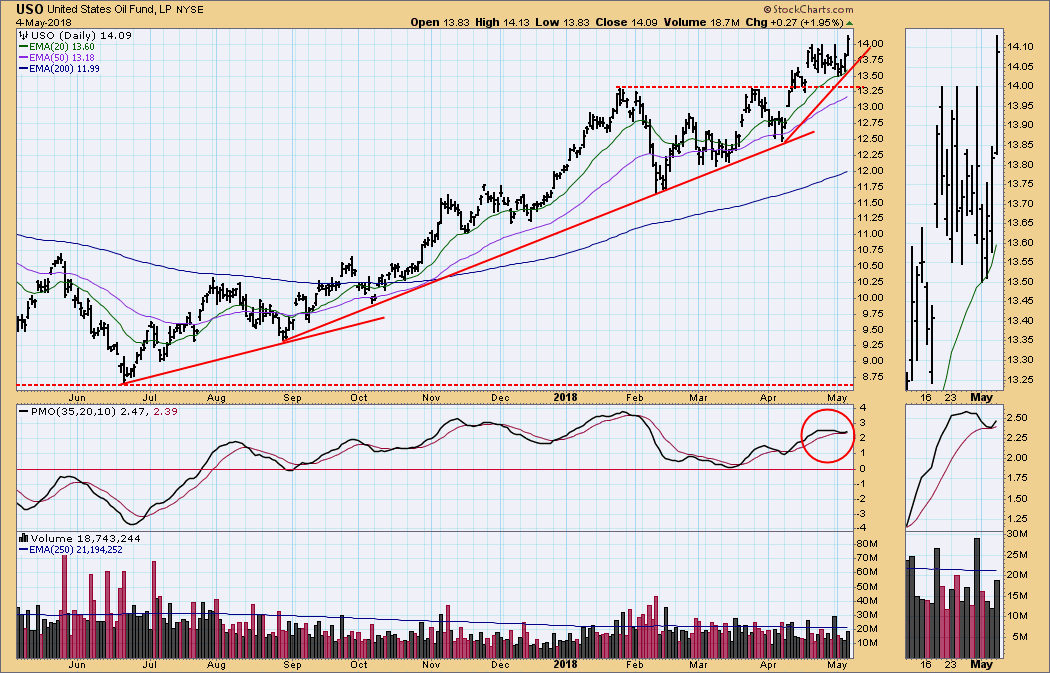
CRUDE OIL (USO)
IT Trend Model: BUY as of 9/6/2017
LT Trend Model: BUY as of 11/2/2017
USO Daily Chart: It isn't a classic parabolic rise, but you can see how the angle of the rising trend lines from the June low are accelerating their angles. This will probably call for some corrective action in the near future.
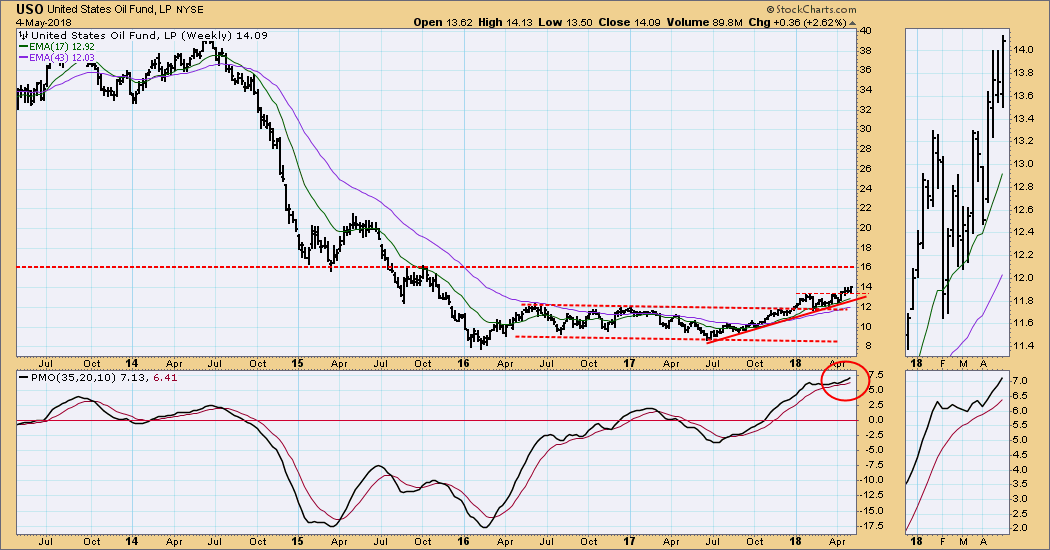
USO Weekly Chart: USO will encounter important resistance at about 16.00. This equates to about $78/bbl for crude.
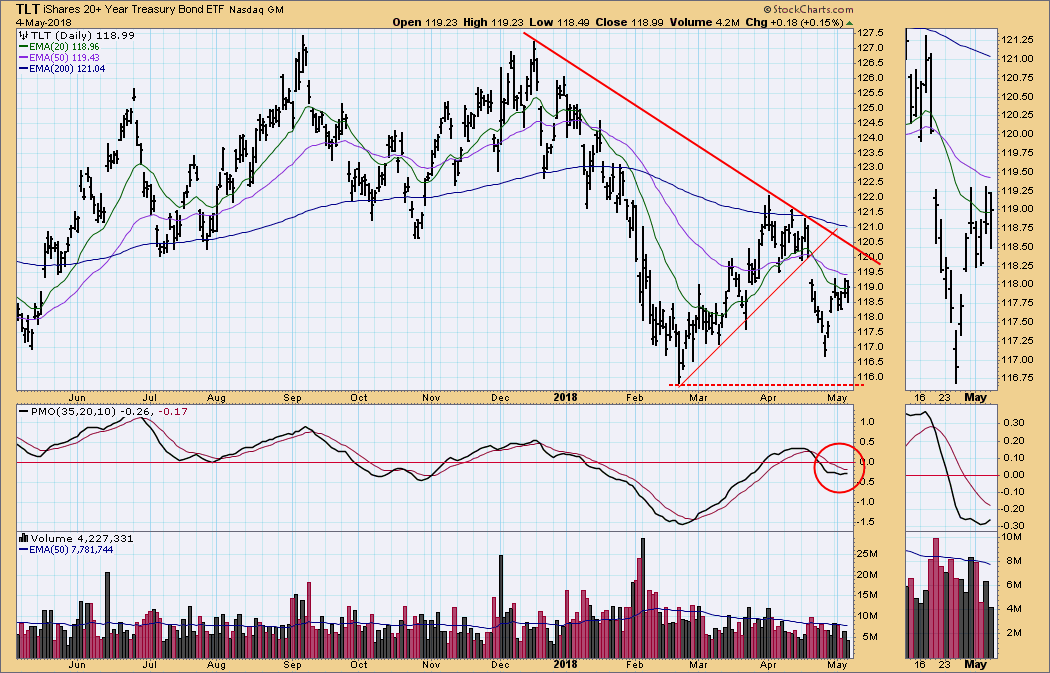
BONDS (TLT)
IT Trend Model: SELL as of 4/20/2018
LT Trend Model: SELL as of 2/8/2018
TLT Daily Chart: The daily PMO has formed a second bottom in as many weeks, while TLT has entered a short consolidation. TLT could move higher in the short term, but with interest rates on the rise, it is hard to visualize a positive longer-term outcome.
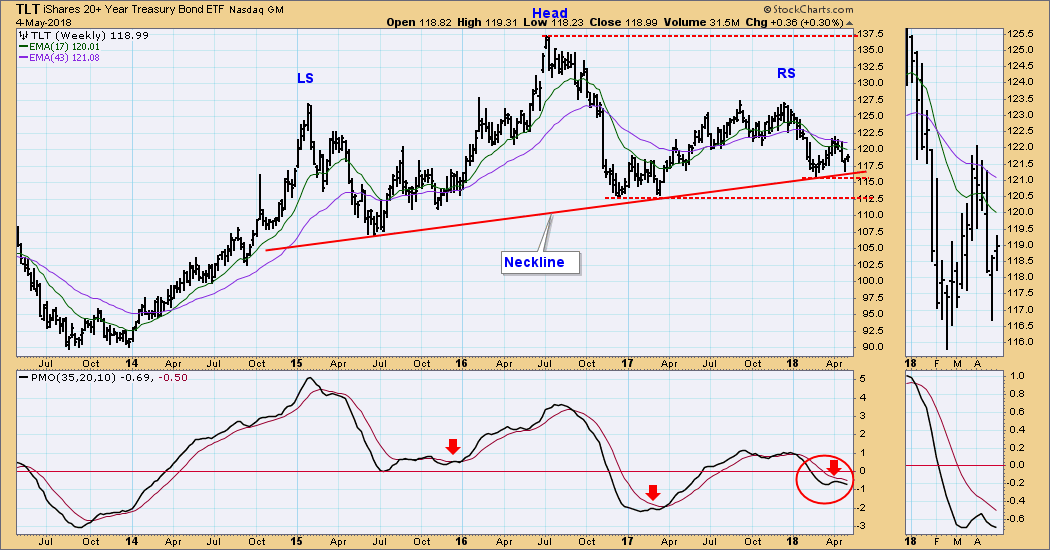
TLT Weekly Chart: The current weekly PMO top below the signal line should be viewed as negative, although, it has the potential to be a sign of a pending rally like the two similar tops in 2017 and 2015. But I also noticed this week that there is a head and shoulders formation, which implies a negative outcome.
**Don't miss any of the DecisionPoint commentaries! Go to the "Notify Me" box toward the end of this blog page to be notified as soon as they are published.**
Technical Analysis is a windsock, not a crystal ball.
Happy Charting!
- Carl
NOTE: The signal status reported herein is based upon mechanical trading model signals, specifically, the DecisionPoint Trend Model. They define the implied bias of the price index based upon moving average relationships, but they do not necessarily call for a specific action. They are information flags that should prompt chart review. Further, they do not call for continuous buying or selling during the life of the signal. For example, a BUY signal will probably (but not necessarily) return the best results if action is taken soon after the signal is generated. Additional opportunities for buying may be found as price zigzags higher, but the trader must look for optimum entry points. Conversely, exit points to preserve gains (or minimize losses) may be evident before the model mechanically closes the signal.
Helpful DecisionPoint Links:
DecisionPoint Shared ChartList and DecisionPoint Chart Gallery
Price Momentum Oscillator (PMO)
Swenlin Trading Oscillators (STO-B and STO-V)
