 I mentioned in yesterday's blog that I was expecting the PMO BUY signals to come in on the Dow and NDX. Well, NDX missed the positive crossover by less than a tenth of a point, but I suspect it'll come in tomorrow barring a particularly bad day of selling. The Swenlin Trading Oscillators (STOs) remain extremely overbought, but appear to be topping. I'm expecting some sideways consolidation or perhaps a pullback.
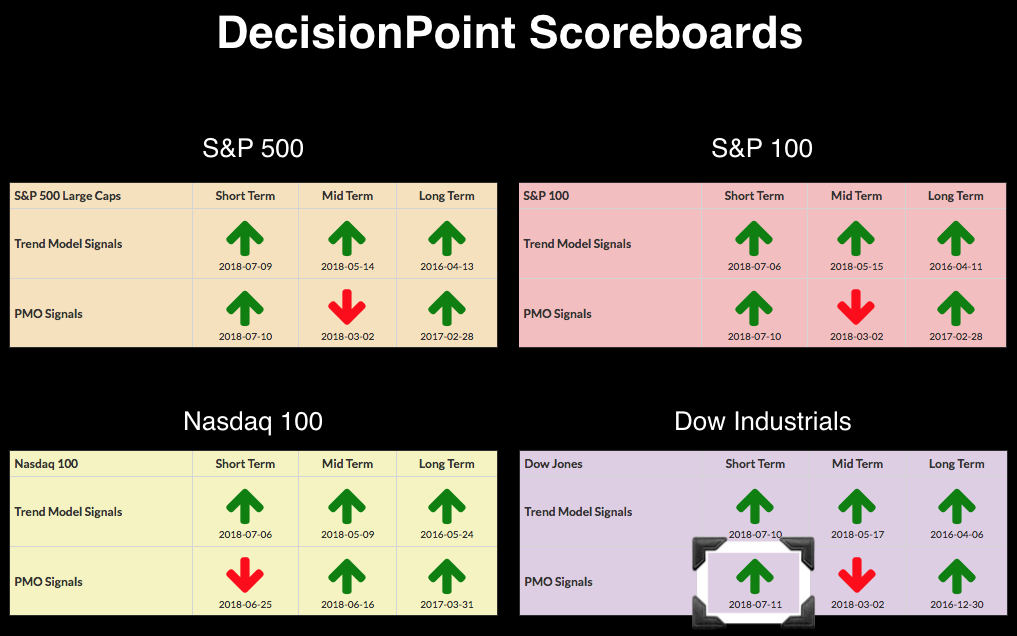
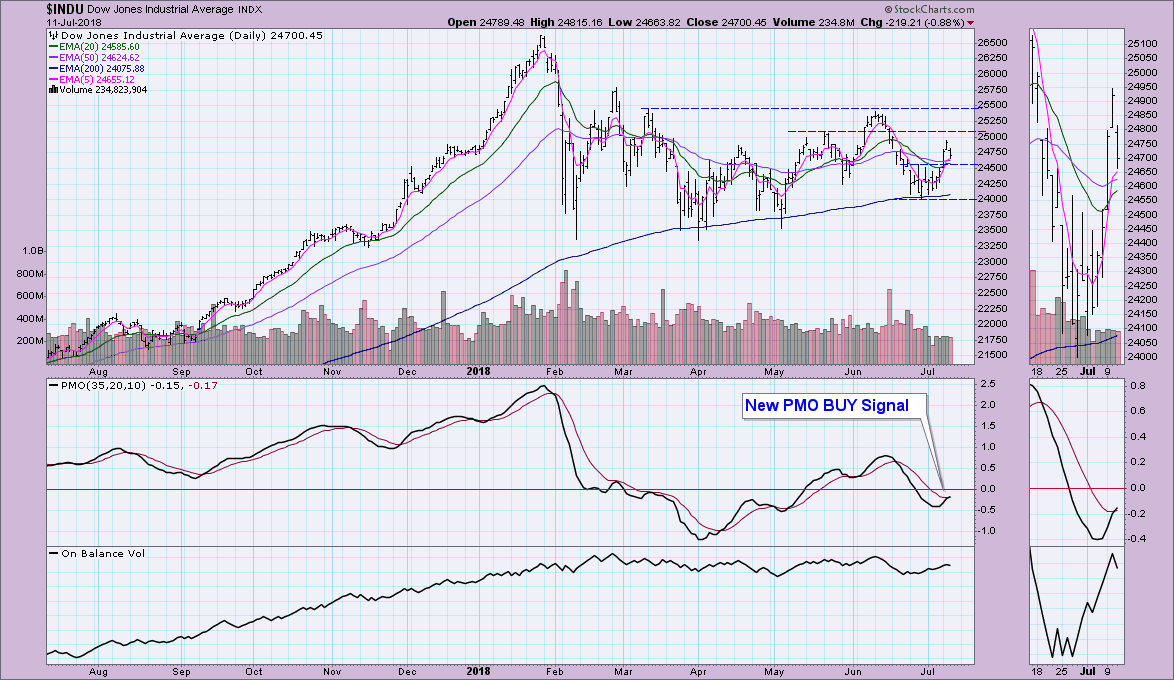
Looking at the Dow chart, we can see that the BUY signal did trigger, but the margin is very thin between the PMO and its signal line. Should we see a pullback instead of consolidation, it will most certainly fail. I expect to see consolidation between 24500 and 25200 based on the PMO BUY signal as well as the OBV trending higher.
The DecisionPoint Weekly Wrap presents an end-of-week assessment of the trend and condition of the stock market (S&P 500), the U.S. Dollar, Gold, Crude Oil, and Bonds.
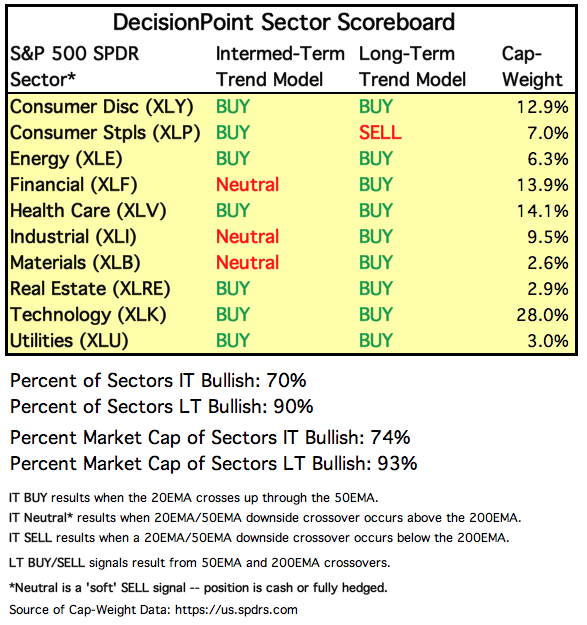
SECTORS
Each S&P 500 Index component stock is assigned to one, and only one, of 10 major sectors. This is a snapshot of the Intermediate-Term and Long-Term Trend Model signal status for those sectors.
STOCKS
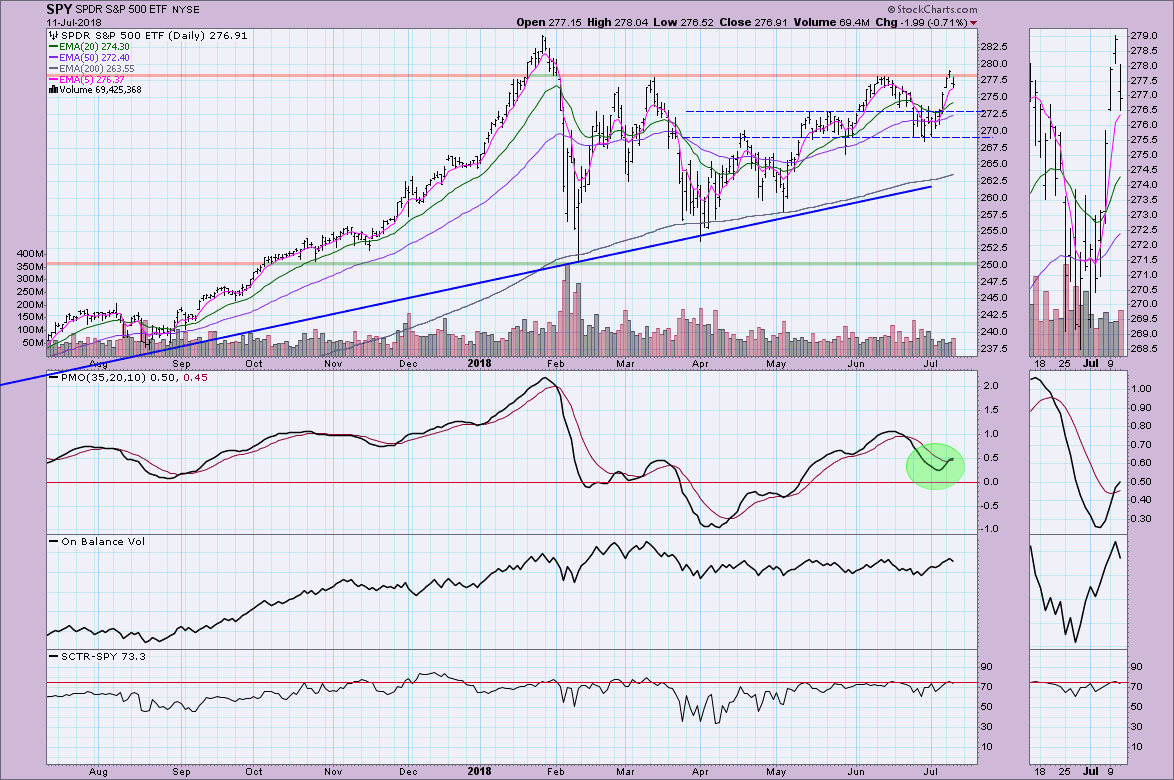
IT Trend Model: BUY as of 5/11/2018
LT Trend Model: BUY as of 4/1/2016
SPY Daily Chart: The failure to surpass overhead resistance at the June top isn't surprising when you look at the indicator charts below. The PMO is decelerating, but it should flatten out if we do see consolidation. Look for consolidation between 272.50 and 277.50 for the SPY. That is a fairly large zone and would require a somewhat painful drop to test that area of support at 272.50 so perhaps the 20-EMA will provide the necessary support for a consolidation zone.
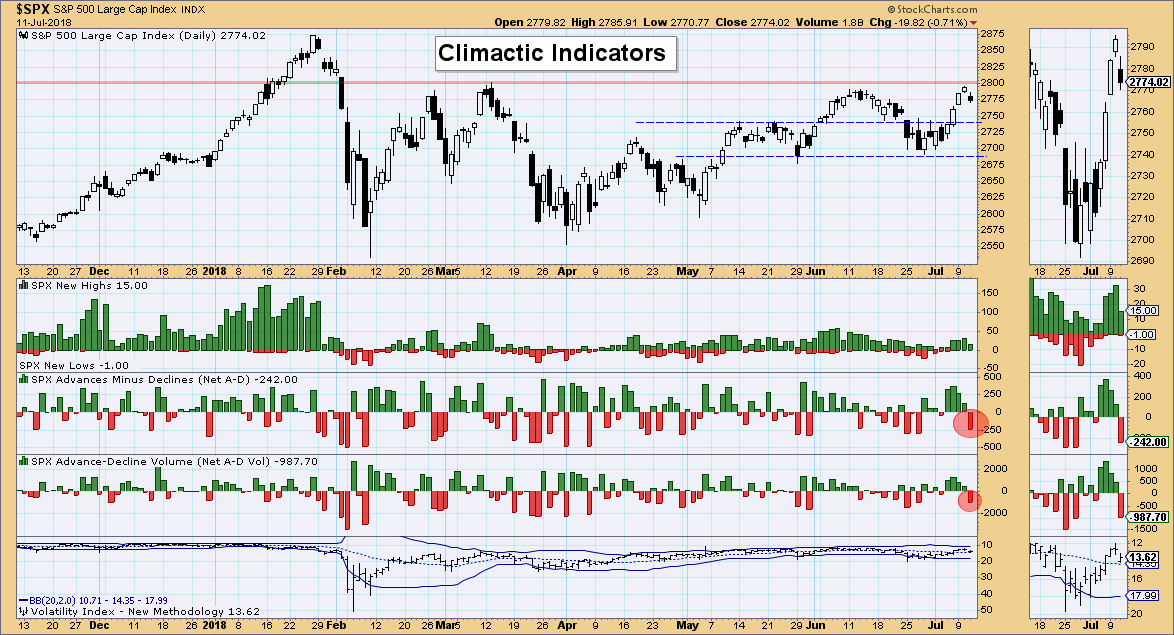
Climactic Market Indicators: Breadth today suggests a selling initiation. The VIX is sitting in the middle of the Bollinger Bands so sentiment won't likely play a role in the possible decline or consolidation.
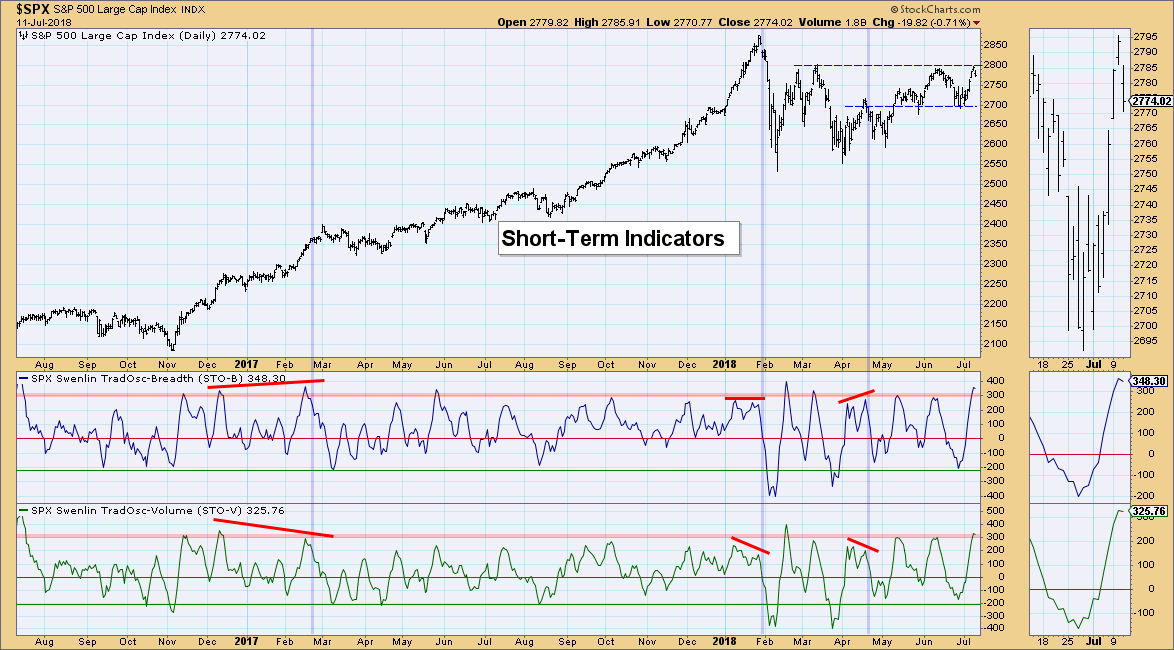
Short-Term Market Indicators: These are the indicators that have me concerned. On the bright side, both are topping above their previous tops. Note that when the STO-V shows declining tops, that usually leads to a difficult decline. I'm still looking for some consolidation in the short term.
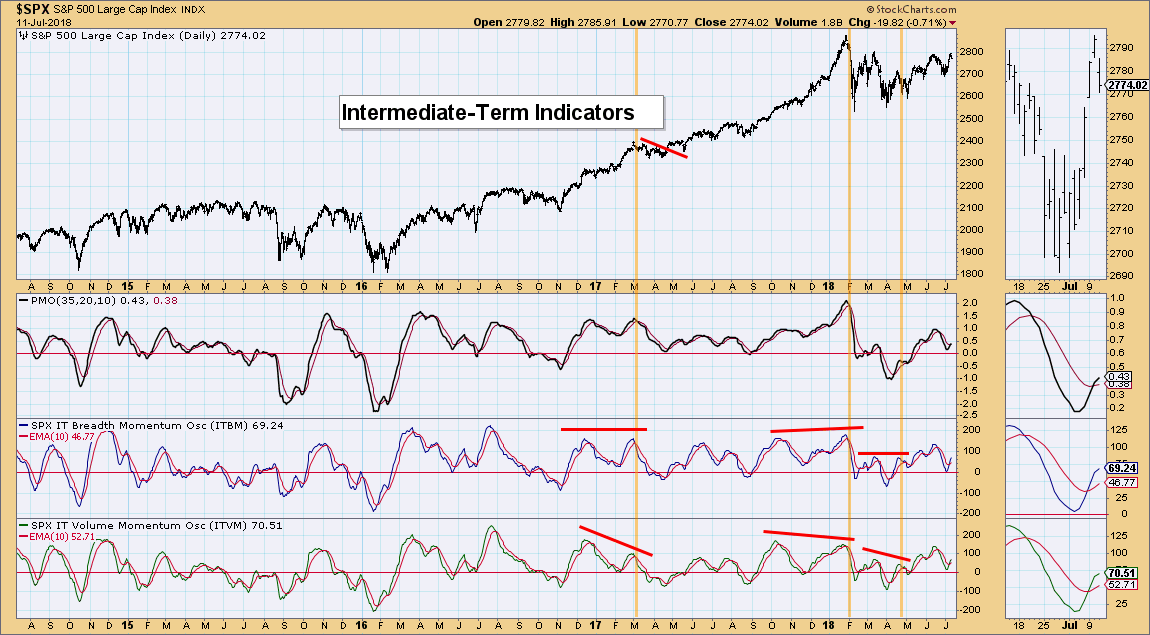
Intermediate-Term Market Indicators: These indicators are looking very promising. While they are decelerating, they managed positive crossovers above the zero line and have plenty of room to support a rally to all-time highs once this short-term weakness is dispensed with.
Conclusion: Short-term conditions are very overbought. The indexes are in a bull market configuration (50-EMAs well above 200-EMAs) and are now on PMO BUY signals (minus the NDX). Remember bull market rules tell us that overbought conditions can work themselves out with consolidation. That's exactly what I'm looking for. Once those overbought conditions are clearing or are cleared, IT indicators tell us to expect a rally possibly to all-time highs again.
DOLLAR (UUP)
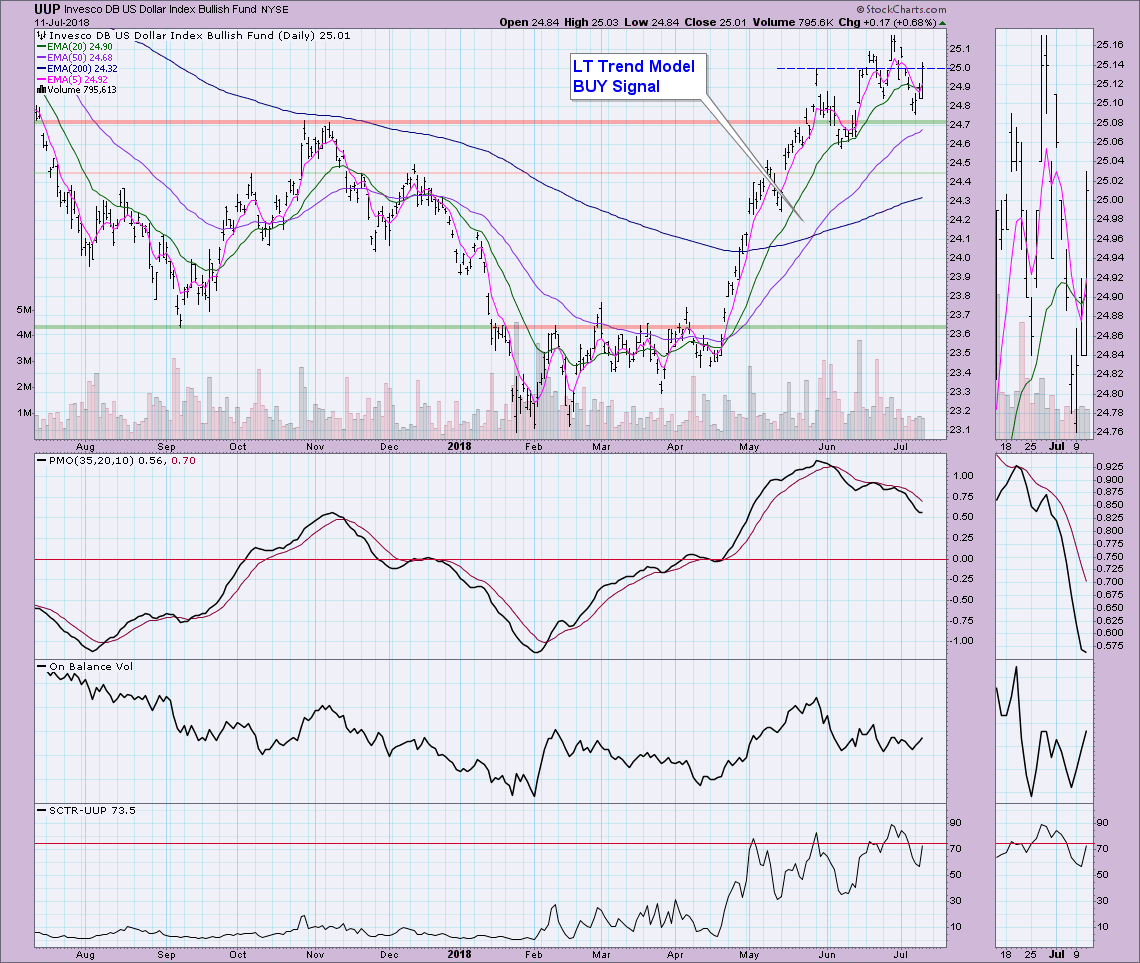
IT Trend Model: BUY as of 4/24/2018
LT Trend Model: BUY as of 5/25/2018
UUP Daily Chart: The Dollar was experiencing quite a pullback, but today it propped itself back up with a close above overhead resistance at the May top. The PMO is starting to decelerate its decline after clearing very overbought conditions. It is now setting up for another rally higher and likely above last month's top.
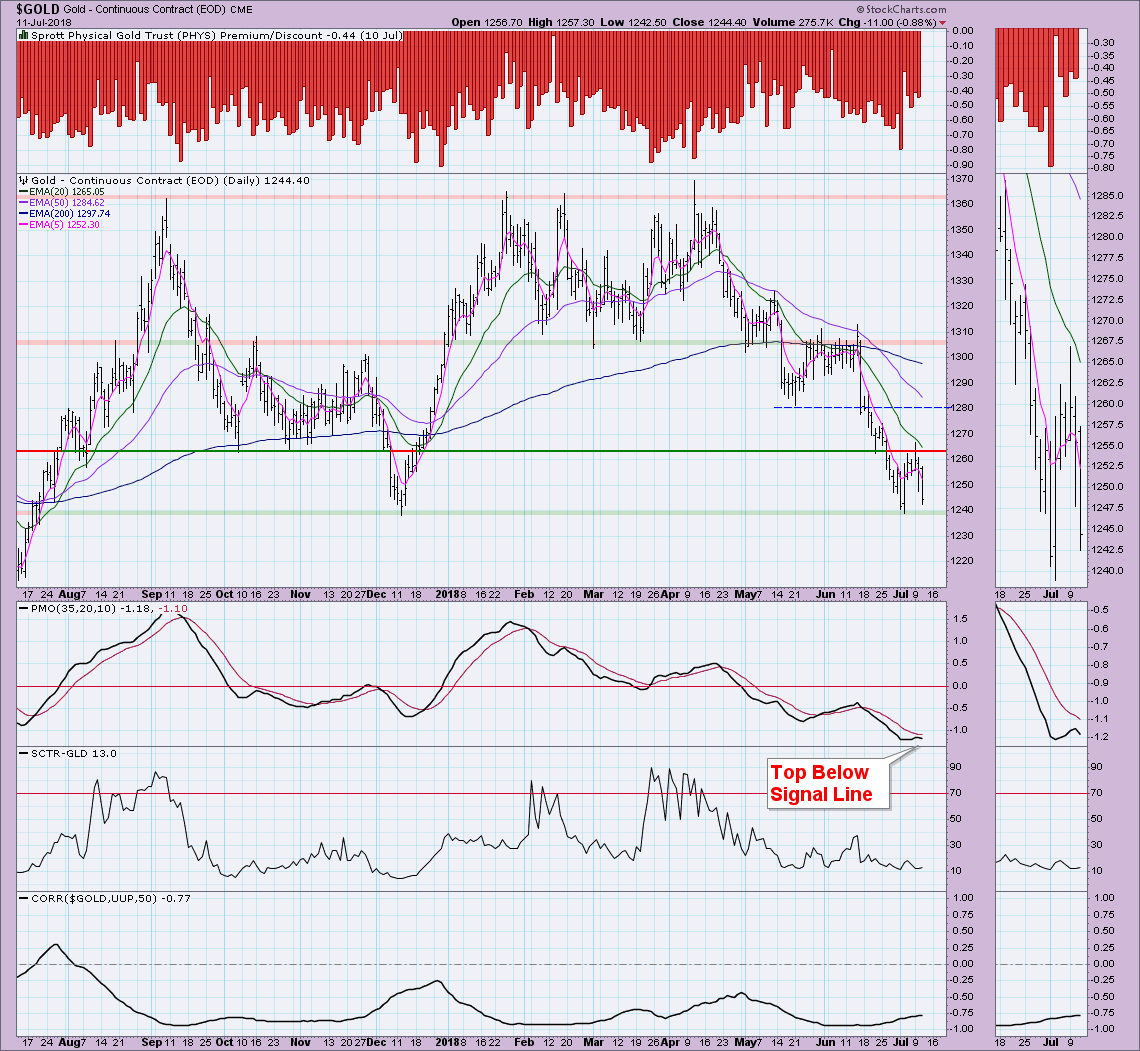
GOLD
IT Trend Model: Neutral as of 5/2/2018
LT Trend Model: SELL as of 6/22/2018
GOLD Daily Chart: Given the very tight reverse correlation between Gold and the Dollar, I'm not expecting Gold to fair well. There isn't enough bearishness in premium/discount sentiment and the failure to close above overhead resistance at 1280, I expect to see the 1240 support level broken. A PMO top below its signal line is an ominous signal as well.
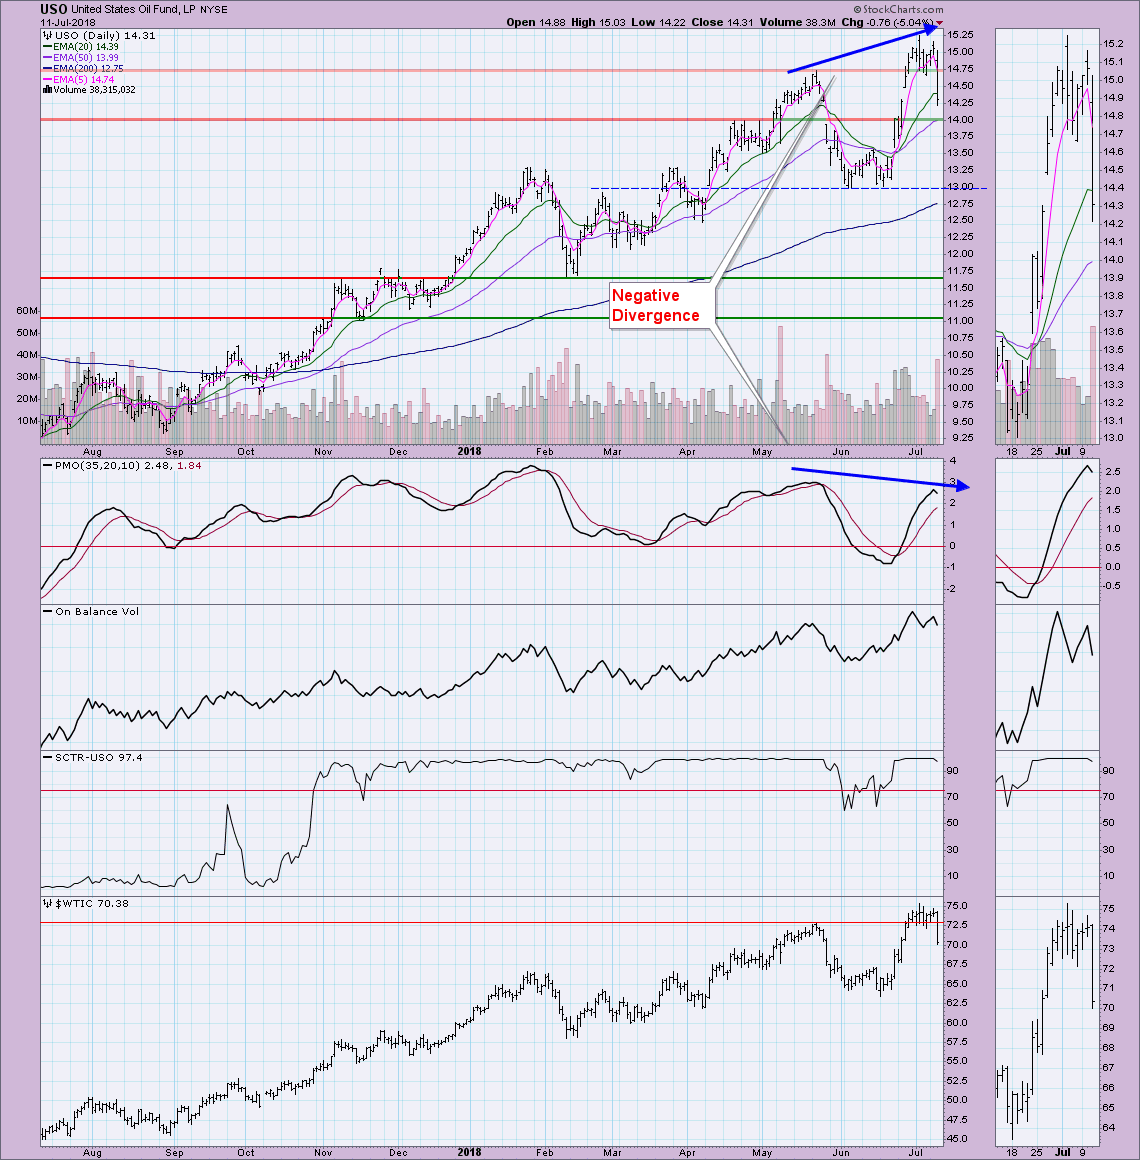
CRUDE OIL (USO)
IT Trend Model: BUY as of 6/26/2018
LT Trend Model: BUY as of 11/2/2017
USO Daily Chart: USO pulled waaaaay back today, nearly testing support at $14.00. This deep decline of over 5% yanked the PMO lower setting up a negative divergence between PMO tops and price tops. This suggests to me that we will continue to see USO fall. Support needs to hold at $14.00 because the next interim support level is at $13.50 and $13.00.
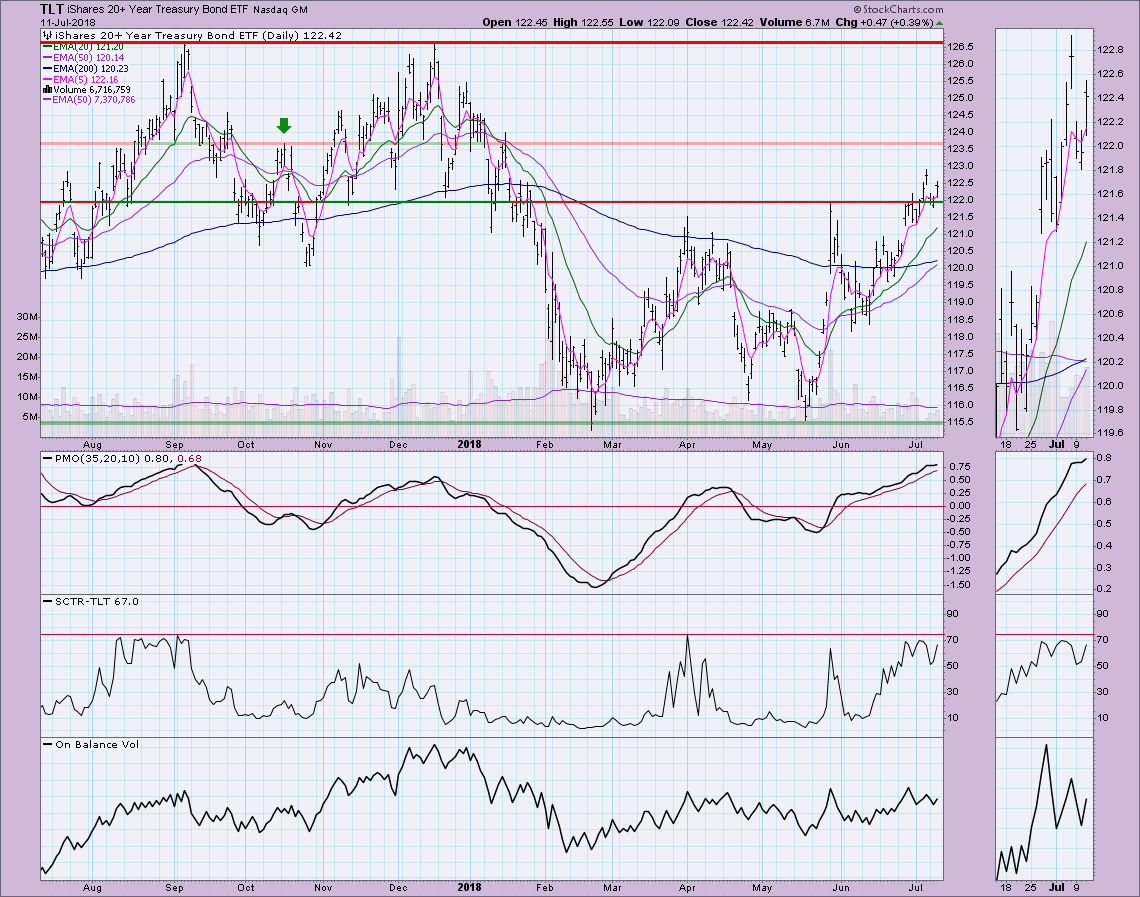
BONDS (TLT)
IT Trend Model: BUY as of 6/1/2018
LT Trend Model: SELL as of 2/8/2018
TLT Daily Chart: Bonds have staged quite a comeback from the June lows and is now setting up for at Long-Term Trend Model BUY signal as the 50-EMA reaches up to cross above the 200-EMA. I've marked a possible area of overhead resistance at the mid-October high, but the next area of serious resistance isn't until it reaches back to all-time highs. I am concerned about the PMO being so overbought, but it did just bottom above the signal line which is very bullish.
Technical Analysis is a windsock, not a crystal ball.
Happy Charting!
- Erin
**Don't miss any of the DecisionPoint commentaries! Go to the "Notify Me" box toward the end of this blog page to be notified as soon as they are published.**
NOTE: The signal status reported herein is based upon mechanical trading model signals, specifically, the DecisionPoint Trend Model. They define the implied bias of the price index based upon moving average relationships, but they do not necessarily call for a specific action. They are information flags that should prompt chart review. Further, they do not call for continuous buying or selling during the life of the signal. For example, a BUY signal will probably (but not necessarily) return the best results if action is taken soon after the signal is generated. Additional opportunities for buying may be found as price zigzags higher, but the trader must look for optimum entry points. Conversely, exit points to preserve gains (or minimize losses) may be evident before the model mechanically closes the signal.
Helpful DecisionPoint Links:
DecisionPoint Shared ChartList and DecisionPoint Chart Gallery
Price Momentum Oscillator (PMO)
Swenlin Trading Oscillators (STO-B and STO-V)
