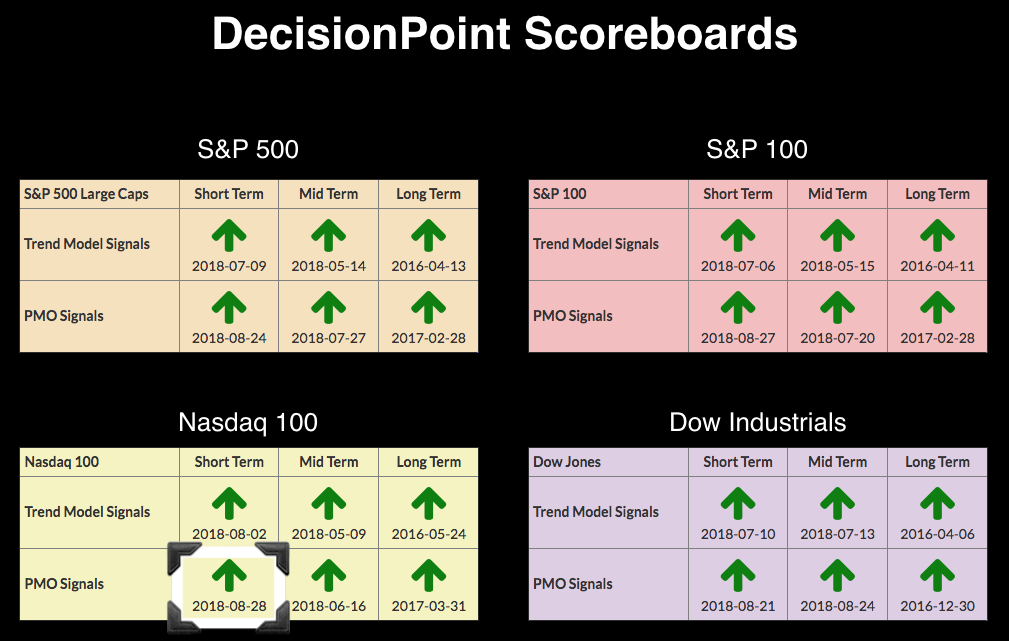
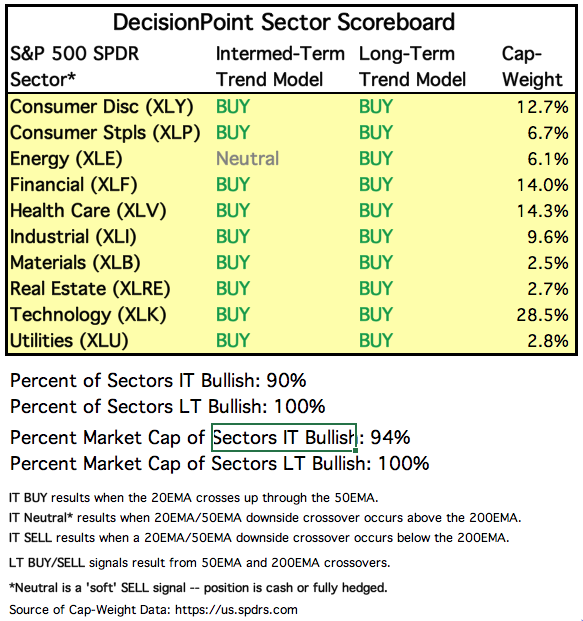
 The last time all four of the DecisionPoint Scoreboards were completely "green" (or on BUY signals in all three time frames as far as price trend and momentum/condition) was back on 11/6/2017. It lasted only ONE day when the SPX whipsawed back into a PMO SELL signal on 11/7. I think these green Scoreboards will last a bit longer than a day, but it does make one wonder if the markets are stretched or sentiment is too bullish. Carl was on MWL today talking about the possible formation of another parabolic price trend. You'll also note that the Sector Scoreboard is sporting all BUY signals except for the Energy SPDR (XLE).
The DecisionPoint Alert presents an mid-week assessment of the trend and condition of the stock market (S&P 500), the U.S. Dollar, Gold, Crude Oil, and Bonds.
SECTORS
Each S&P 500 Index component stock is assigned to one, and only one, of 10 major sectors. This is a snapshot of the Intermediate-Term and Long-Term Trend Model signal status for those sectors.
STOCKS
IT Trend Model: BUY as of 5/11/2018
LT Trend Model: BUY as of 4/1/2016
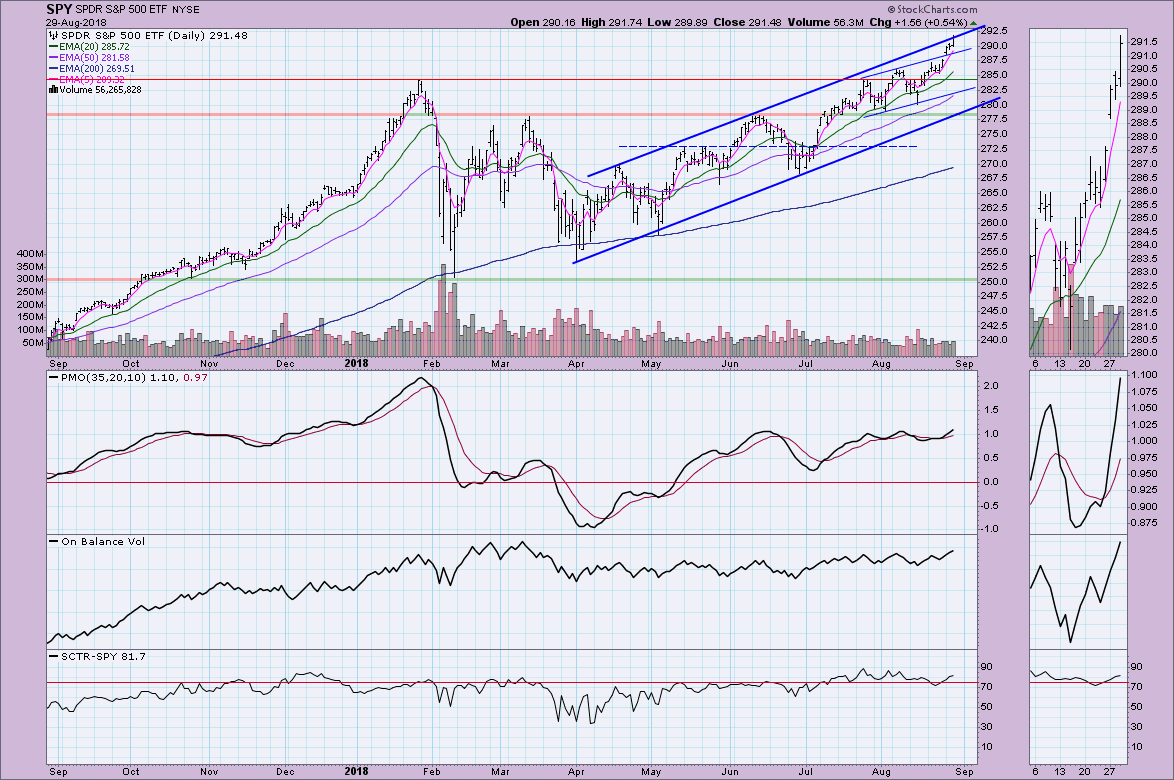
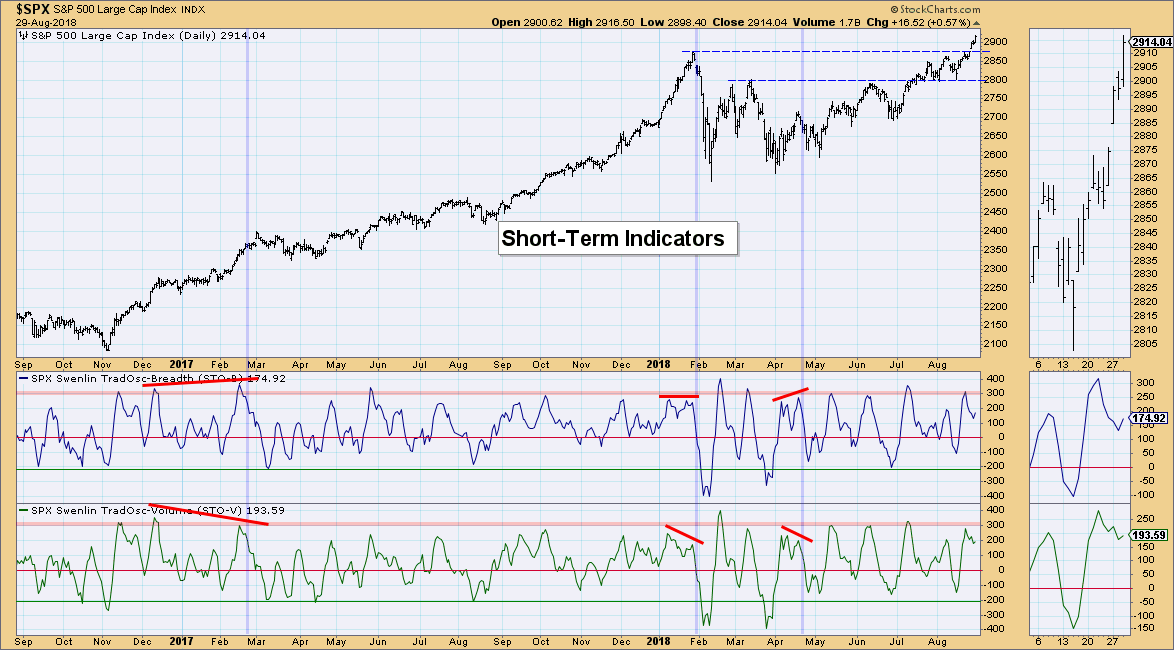
SPY Daily Chart: I don't see a parabolic move just yet, as the rising trend channel is holding up in the intermediate term. In the shorter term, I annotated a smaller rising trend channel and price has broken up above it. The PMO is on a healthy BUY signal and it has outpaced the previous two tops. The "normal" range for the PMO on the SPX is between -2 and +2, so the current reading of 1.10 could only be considered moderately overbought or if going from February, 'near-term overbought'. There doesn't appear to be any deterioration of volume. If we have an upside breakout from this intermediate-term rising trend channel then we could be looking at a parabolic. This week's rally is nearly vertical so a pause or pullback seems likely.
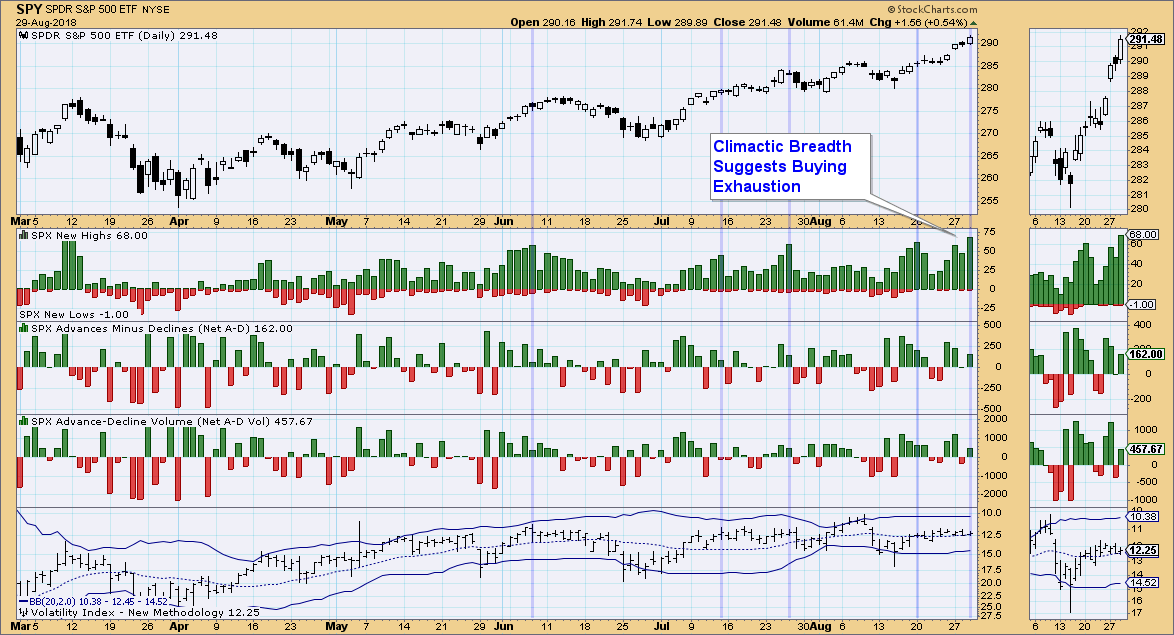
Climactic Market Indicators: The climactic reading on the New Highs suggests a buying exhaustion has been reached. Note that typically these climactic breadth readings are followed by a pause or decline.
Short-Term Market Indicators: While these indicators have turned up, they still could use some unwinding. I think this also points to a possible pullback or pause.
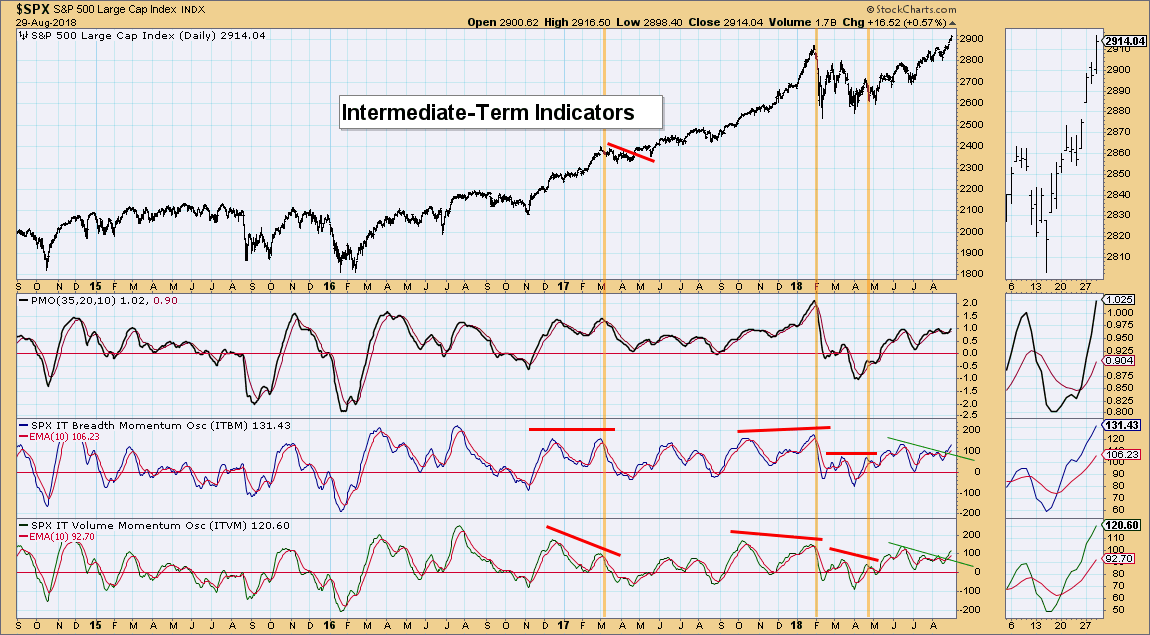
Intermediate-Term Market Indicators: The breakout from the declining trend tells us that the future is bright in the intermediate term. Both indicators are only moderately overbought, so I would look for higher prices after a near-term pause or pullback.
Conclusion: With the upcoming three day weekend, look for a pause or digestion of this rally with light holiday trading.
DOLLAR (UUP)
IT Trend Model: BUY as of 4/24/2018
LT Trend Model: BUY as of 5/25/2018
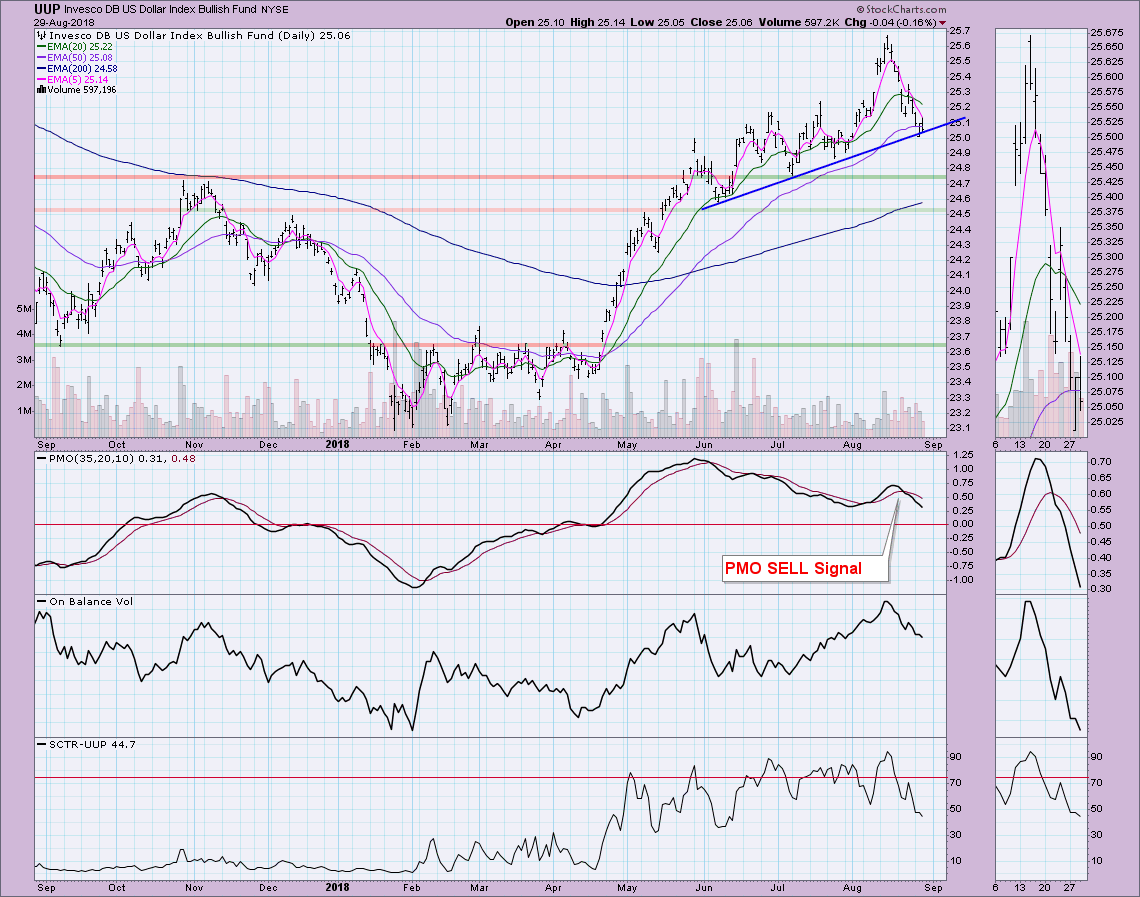
UUP Daily Chart: As noted in the title of this blog, I believe that the Dollar is at a critical decision point. It is so far clinging to the rising bottoms trendline. However, we have a PMO SELL signal and both the OBV and SCTR is pointing downward. I am bearish on the Dollar, at least until it gets closer to support at $24.75. At that point, I'll reevaluate.
GOLD
IT Trend Model: Neutral as of 5/2/2018
LT Trend Model: SELL as of 6/22/2018
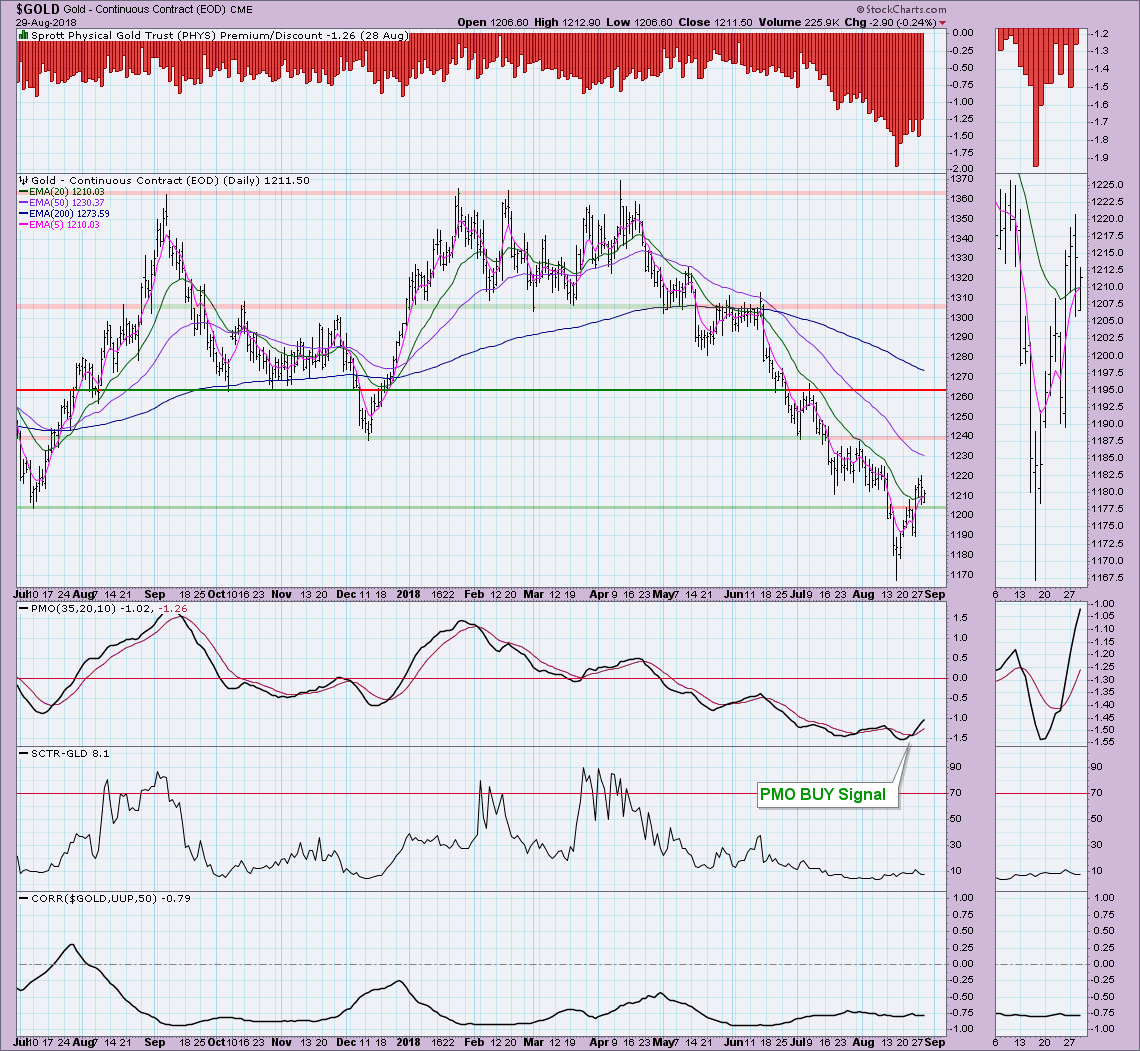
GOLD Daily Chart: Gold broke out on Friday above overhead resistance formed at the July 2017 low, but has spent the past three days pulling back toward the breakout point. If the Dollar should find footing on the rising bottoms trendline, Gold will likely fail to hold $1205 which has now become support. The PMO and bearish discounts on $PHYS suggests it will continue to rally forth. My thoughts based on the UUP chart and this chart below is that the Dollar will breakdown, but hold support at $24.75. Gold on the other hand should rally to test resistance at $1240. After that, I would look for a reversal.
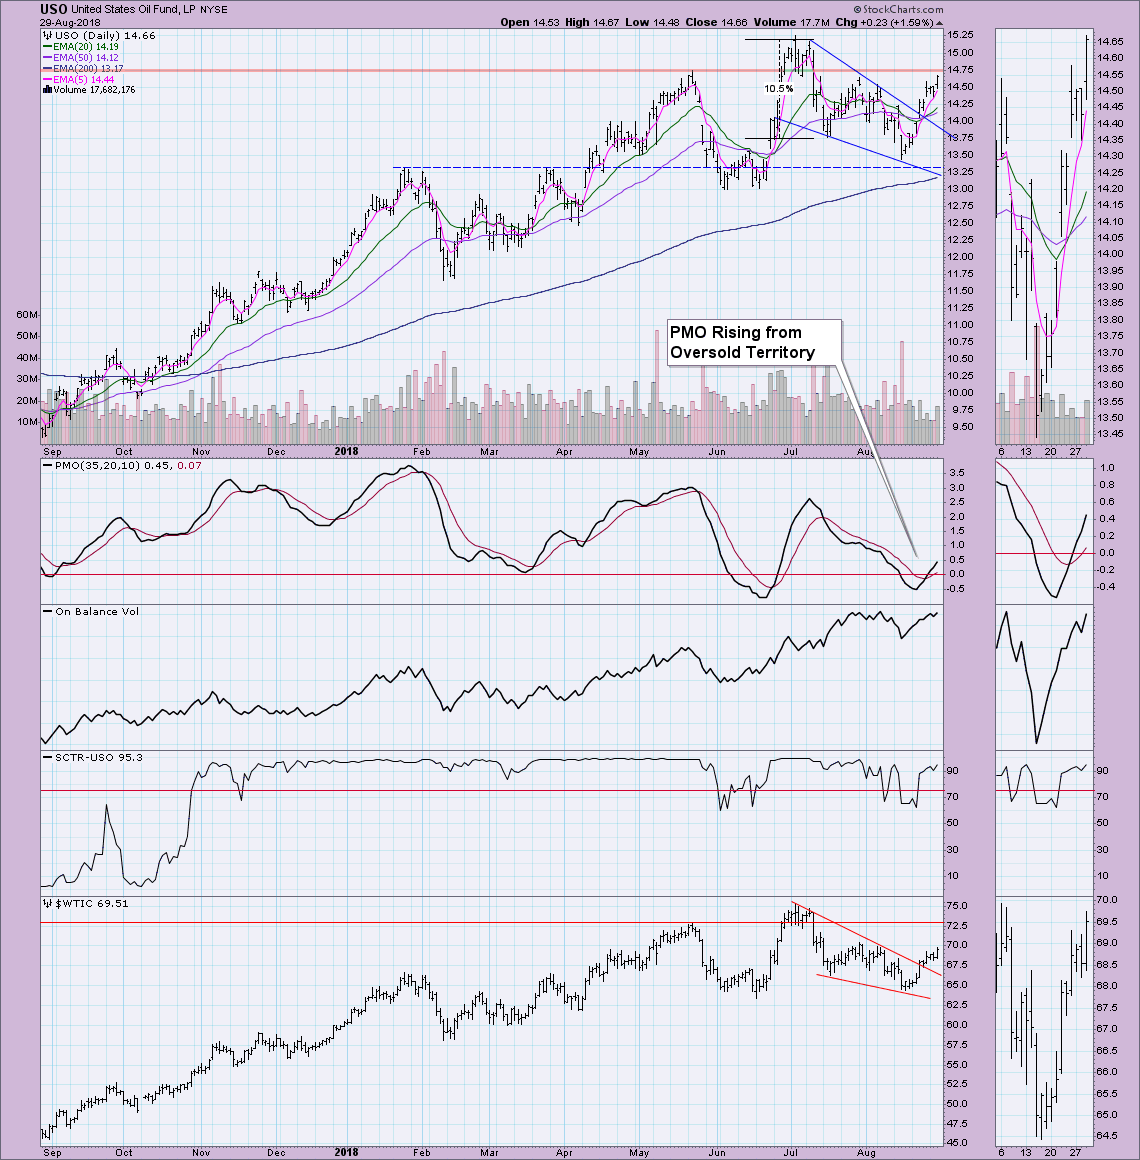
CRUDE OIL (USO)
IT Trend Model: Neutral as of 8/16/2018
LT Trend Model: BUY as of 11/2/2017
USO Daily Chart: I always love it when I write a bullish article and the stock I dissect does what I suggested it would. On Monday I wrote a blog on a continuation rally for Oil. I'm still very bullish on Oil. USO is about ready to test overhead resistance at $14.75, but I'm fairly confident we will see it breakout. The PMO is very positive, the falling wedge has executed and USO hasn't reached its upside target at $15.50.
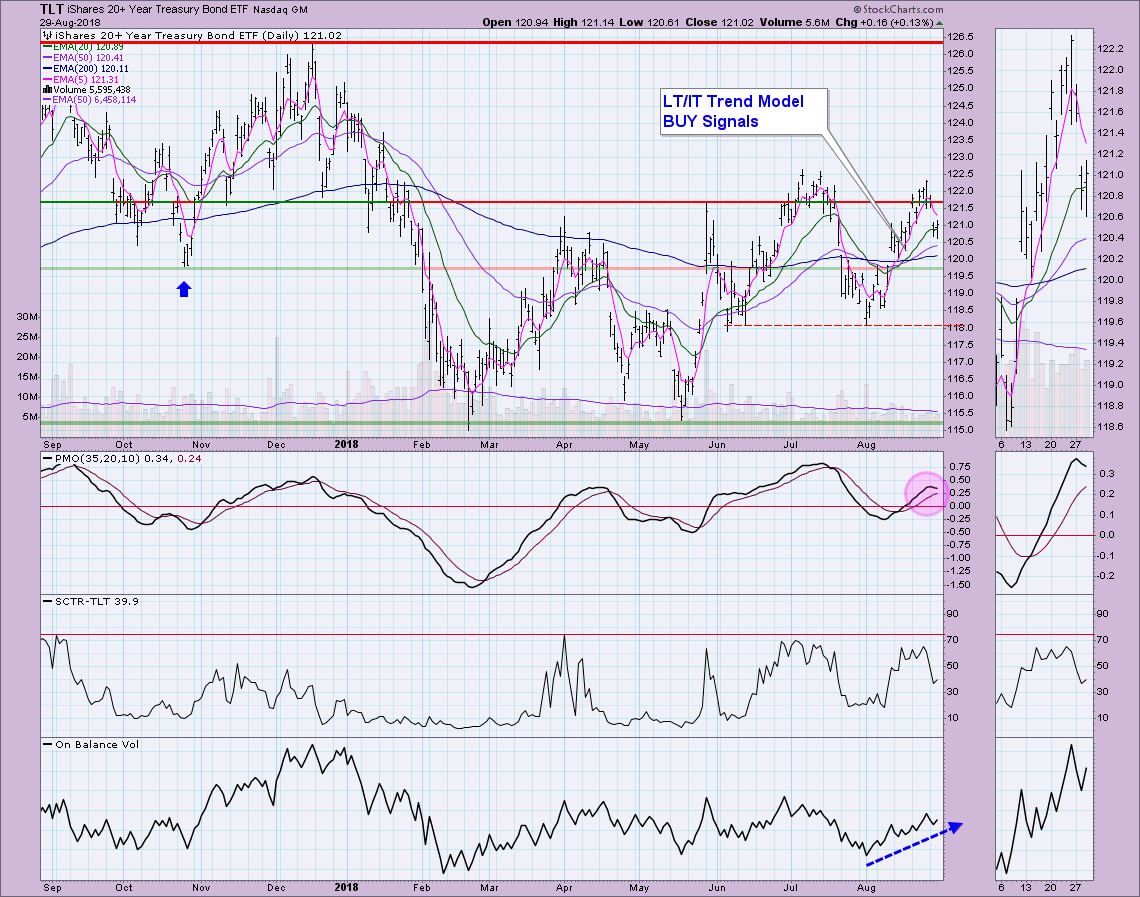
BONDS (TLT)
IT Trend Model: BUY as of 8/15/2018
LT Trend Model: BUY as of 8/20/2018
TLT Daily Chart: We could be looking at an island formation, but based on the PMO, I suspect it is a breakaway gap to the downside. The only conflicting information right now is the OBV which is staying in a rising trend. I'm banking on the PMO being the harbinger of a decline to support at around $119.50 (October 2017 low).
Technical Analysis is a windsock, not a crystal ball.
Happy Charting!
- Erin
**Don't miss any of the DecisionPoint commentaries! Go to the "Notify Me" box toward the end of this blog page to be notified as soon as they are published.**
NOTE: The signal status reported herein is based upon mechanical trading model signals, specifically, the DecisionPoint Trend Model. They define the implied bias of the price index based upon moving average relationships, but they do not necessarily call for a specific action. They are information flags that should prompt chart review. Further, they do not call for continuous buying or selling during the life of the signal. For example, a BUY signal will probably (but not necessarily) return the best results if action is taken soon after the signal is generated. Additional opportunities for buying may be found as price zigzags higher, but the trader must look for optimum entry points. Conversely, exit points to preserve gains (or minimize losses) may be evident before the model mechanically closes the signal.
Helpful DecisionPoint Links:
DecisionPoint Shared ChartList and DecisionPoint Chart Gallery
Price Momentum Oscillator (PMO)
Swenlin Trading Oscillators (STO-B and STO-V)
