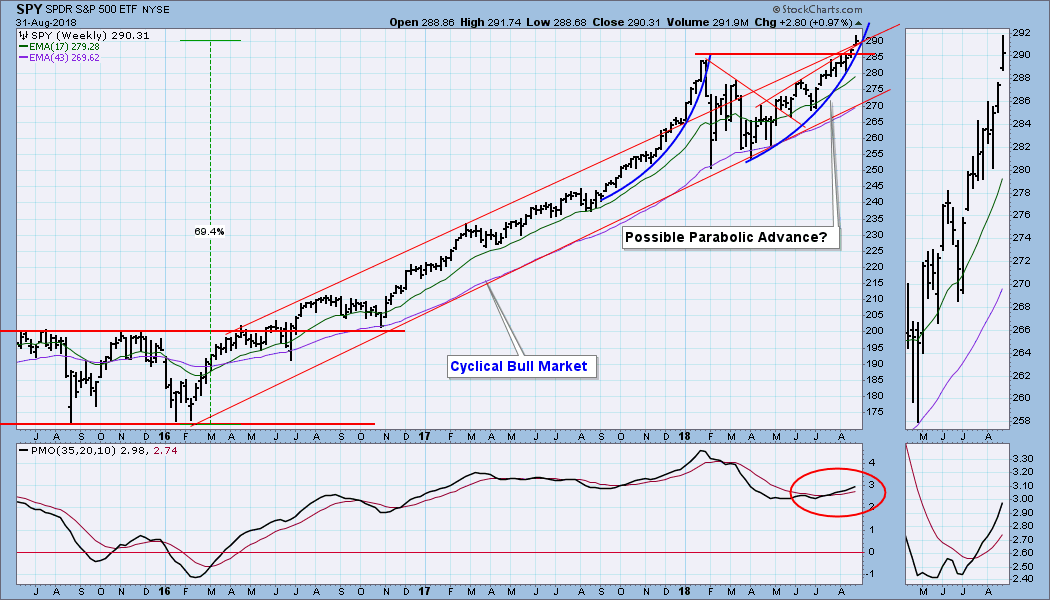
This week, as the market once again broke out of the cyclical bull market rising trend channel, it occurred to me that perhaps another parabolic advance was getting under way. On Wednesday I was a guest of Erin and Tom on MarketWatchers LIVE, and I gave a more detailed account of how my thinking developed on this matter. We don't have to search the data too deeply to give an example of what I mean -- the last parabolic began in late-2017 and ended early this year. Conveniently, we can compare the current upward curve with the last one, and we can see that the new curve is not very steep yet, but, as I said, the real action may be just beginning. More on this to follow.
The DecisionPoint Weekly Wrap presents an end-of-week assessment of the trend and condition of the stock market (S&P 500), the U.S. Dollar, Gold, Crude Oil, and Bonds.
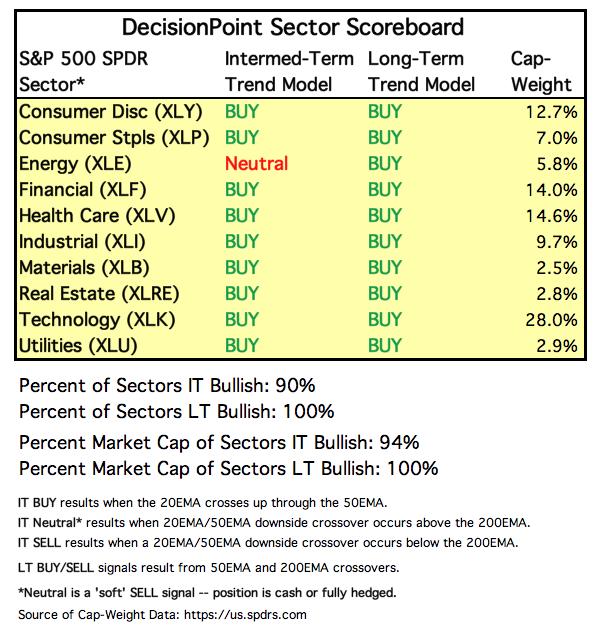
SECTORS
Each S&P 500 Index component stock is assigned to one, and only one, of 10 major sectors. This is a snapshot of the Intermediate-Term and Long-Term Trend Model signal status for those sectors.
STOCKS
IT Trend Model: BUY as of 5/11/2018
LT Trend Model: BUY as of 4/1/2016
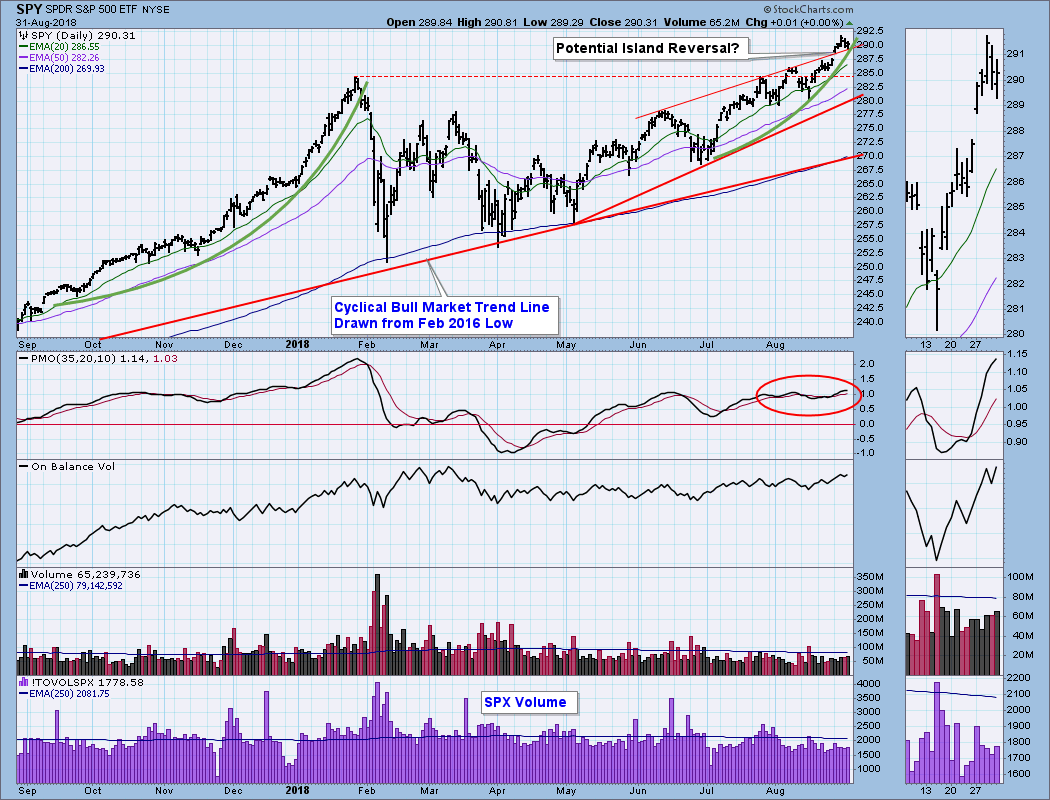
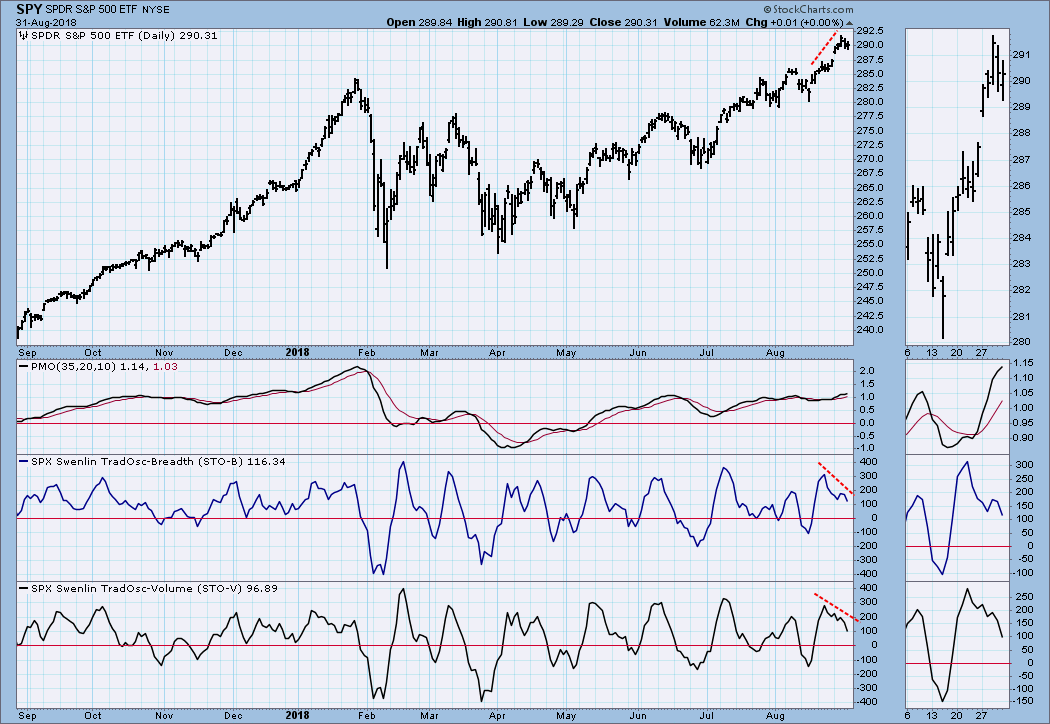
SPY Daily Chart: On the daily chart we get a better view of the details of the current advance compared to the one that ended in January. As I said, it may be just beginning, but it needs to get a lot steeper. There is another angle here, though. The gap up on Monday that got us thinking along these lines creates a problem because the rest of this week's price action created an island that just begs for a reversal. Whatever the answer to this conflict, I think we will surely have it next week.
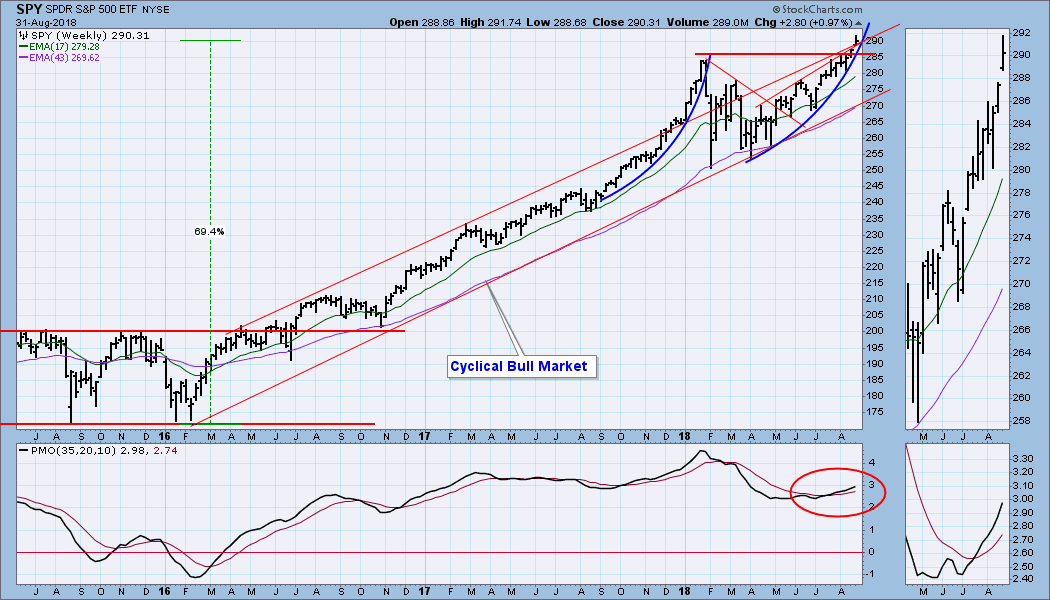
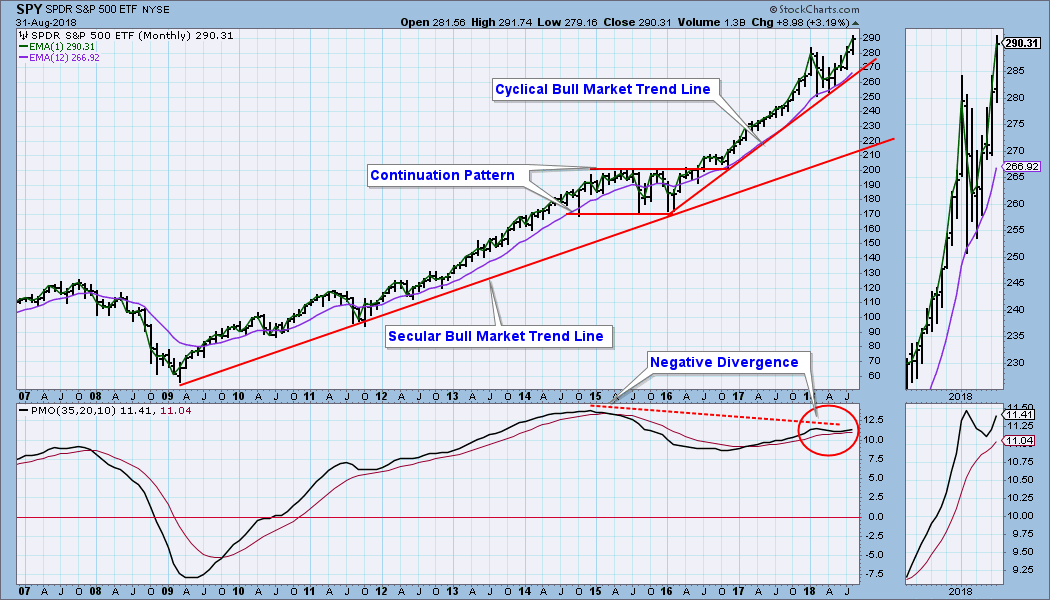
SPY Weekly Chart: I am repeating this article's lead chart here for the sake of continuity. Note that the weekly PMO is positive.
 SPY Monthly Chart: The monthly PMO negative divergence shown does not really concern me, because price is making new highs and the PMO is rising.
Short-Term Market Indicators: There are some sharp negative divergences here. Again, we seem to be set up for a short-term pullback.
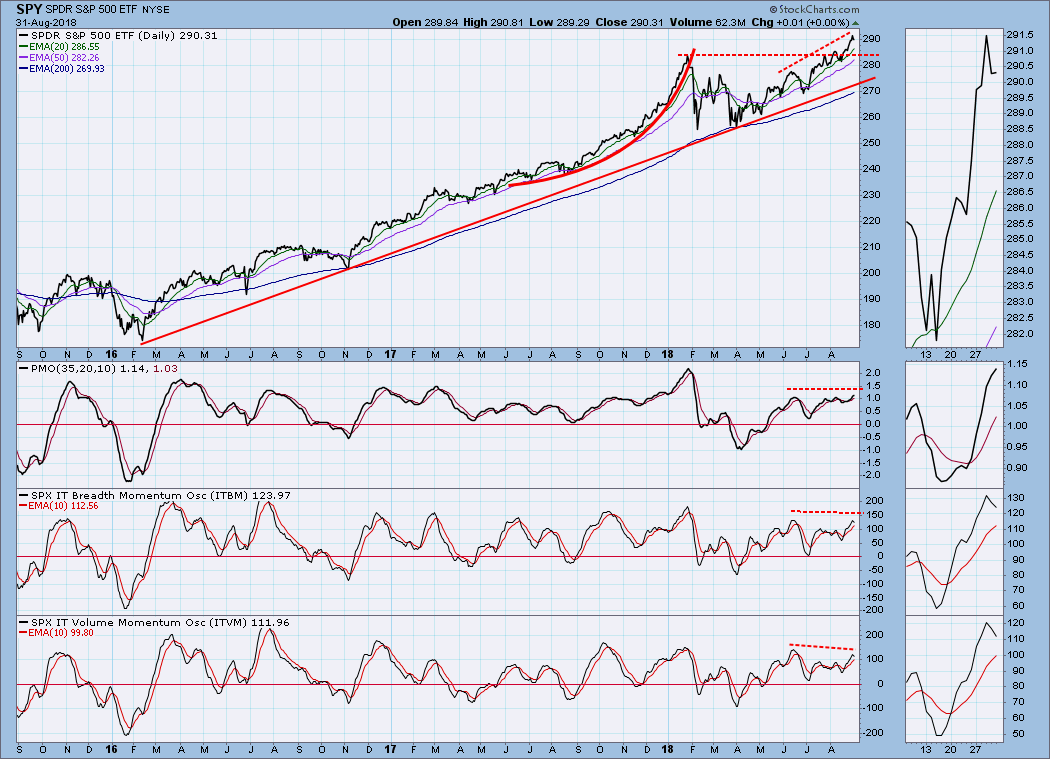
Intermediate-Term Market Indicators: Negative divergences persist in this time frame, although they are not as steep as they were last week.
Conclusion: Last week I thought we had a setup for a short-term correction, but that did not materialize. Instead on Monday price gapped up out of the rising trend channel, and this got me thinking in terms of a parabolic melt up. Of course, the gap and subsequent island also smacks of a reversal. Neither outcome would surprise me, and a reversal won't necessarily destroy the parabolic potential, because the market seems relentlessly positive and irrepressible. Let's hope next week's action clears things up.
DOLLAR (UUP)
IT Trend Model: BUY as of 4/24/2018
LT Trend Model: BUY as of 5/25/2018
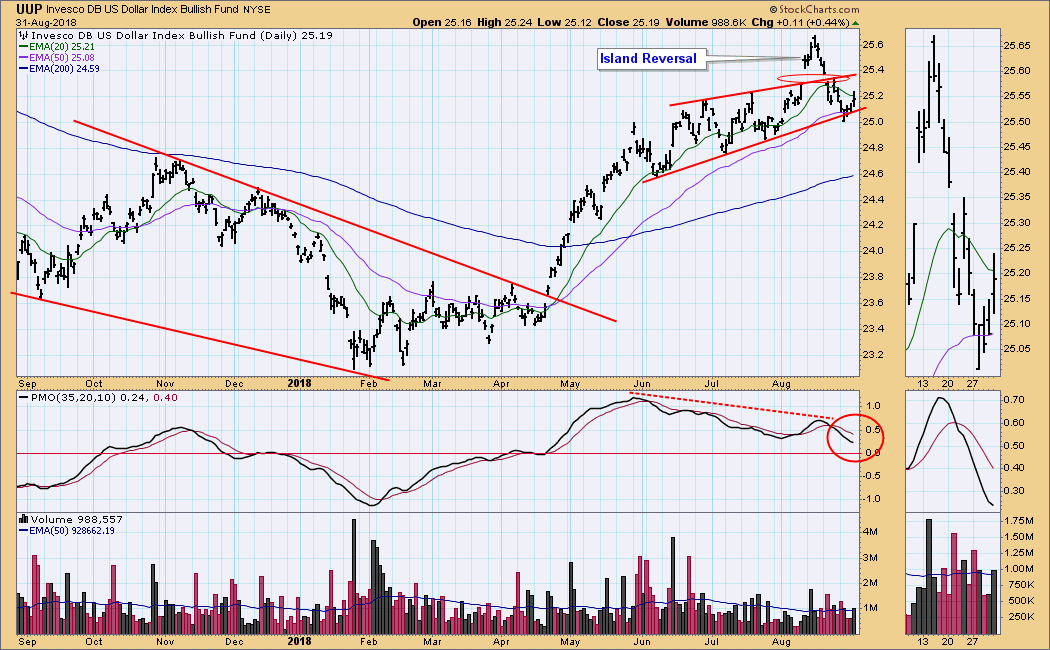
UUP Daily Chart: UUP gapped up out of a rising wedge (a bullish resolution), then performed an island reversal, ultimately finding support at the bottom of the wedge.
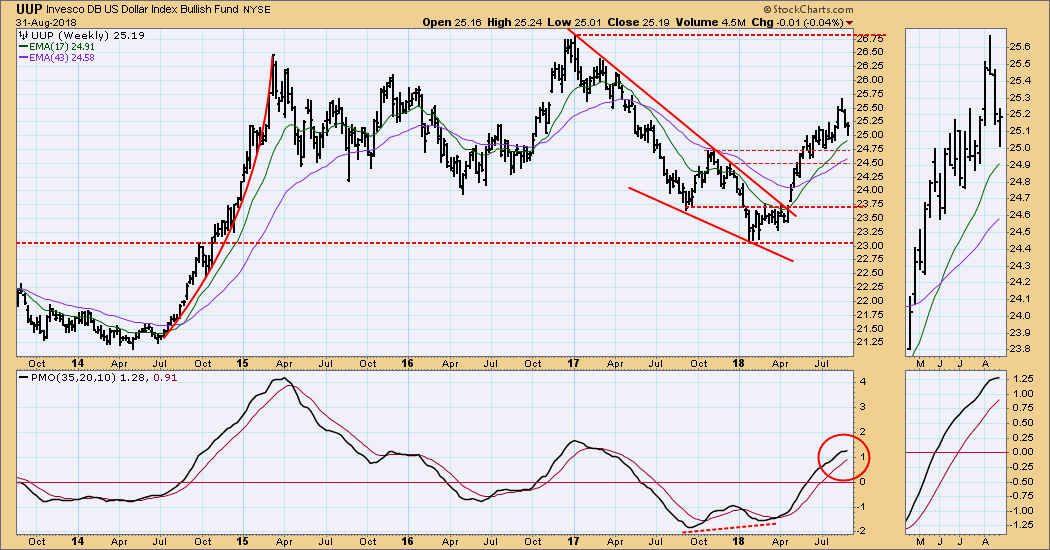
UUP Weekly Chart: Last week it looked like a pretty good bet that UUP had made an important top, and the weekly PMO was trying to roll over to confirm it. This week UUP closed near the top of the week's range, and the PMO bent upward a bit more.
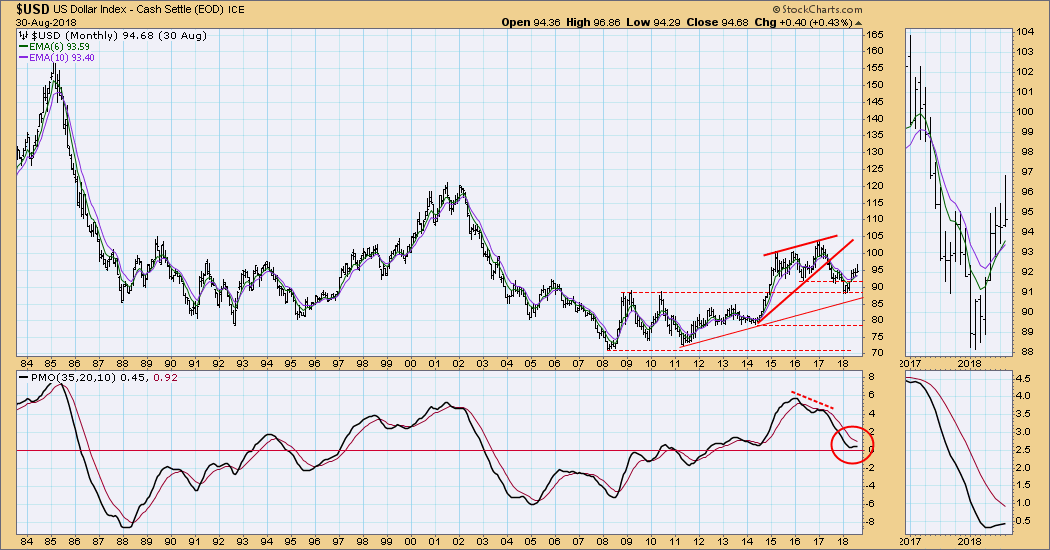
$USD Monthly Chart: I'm seeing a problem here. The monthly PMO is below the signal line and is trying to turn down. Stay tuned.
GOLD
IT Trend Model: NEUTRAL as of 5/2/2018
LT Trend Model: SELL as of 6/22/2018
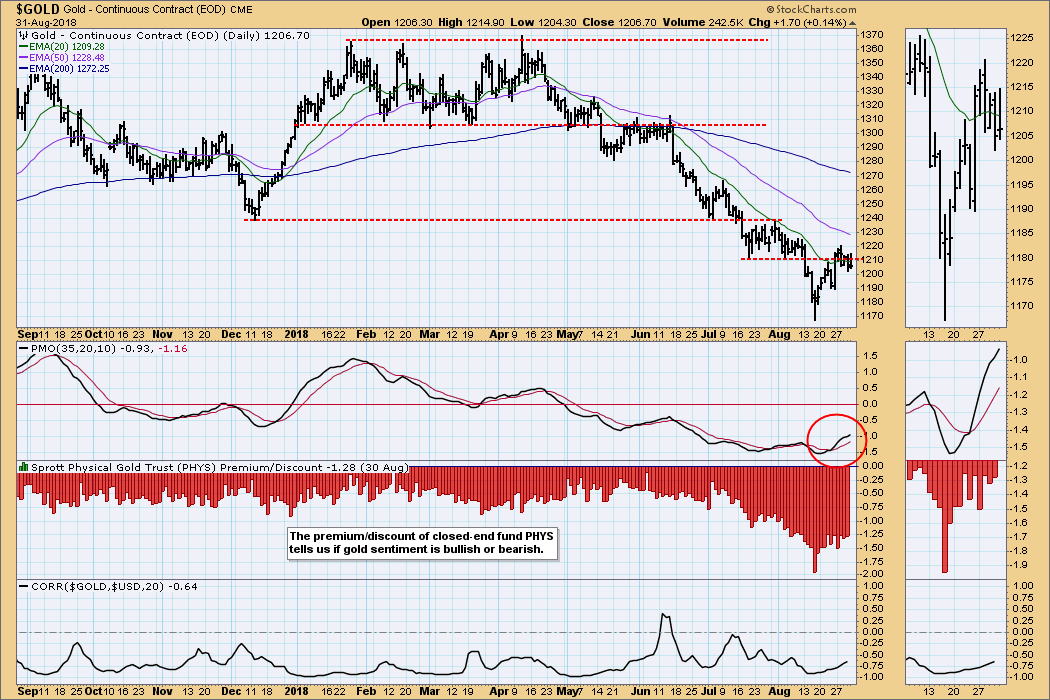
GOLD Daily Chart: I think there is a good chance that gold has finally bottomed. It certainly had a nice bounce off the 1170 level, and the daily PMO is above the signal line. Sentiment has been heavily bearish in the last four weeks, which has a bullish implication.
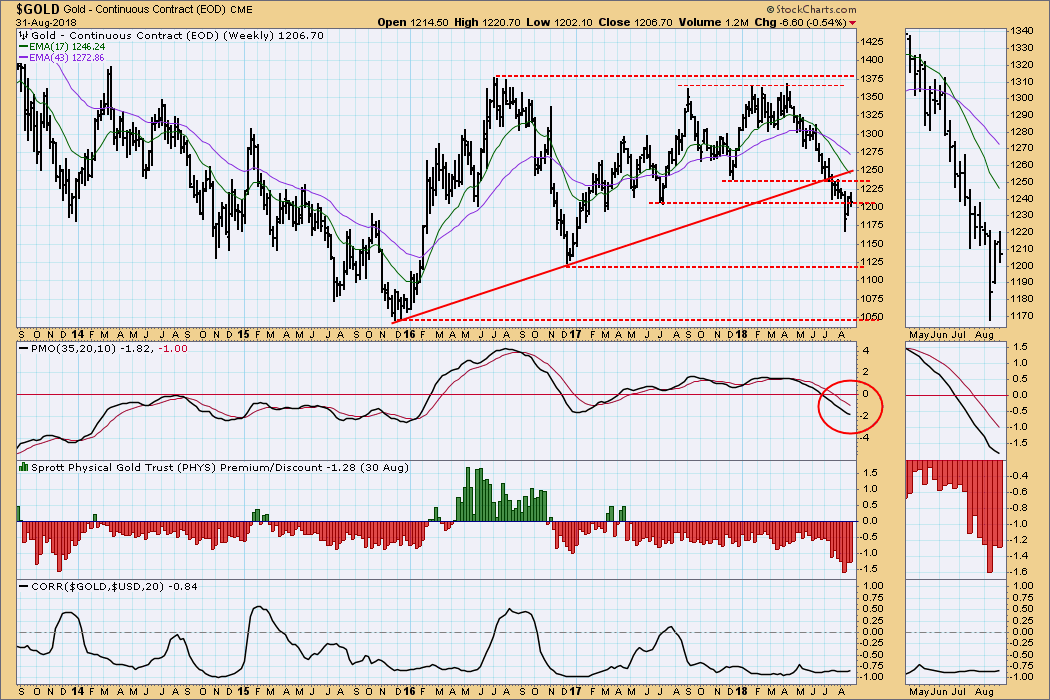
GOLD Weekly Chart: Gold is recovering from a selloff three weeks ago. Note that sentiment reached the same level as in 2013, at which time a nice rally was initiated.
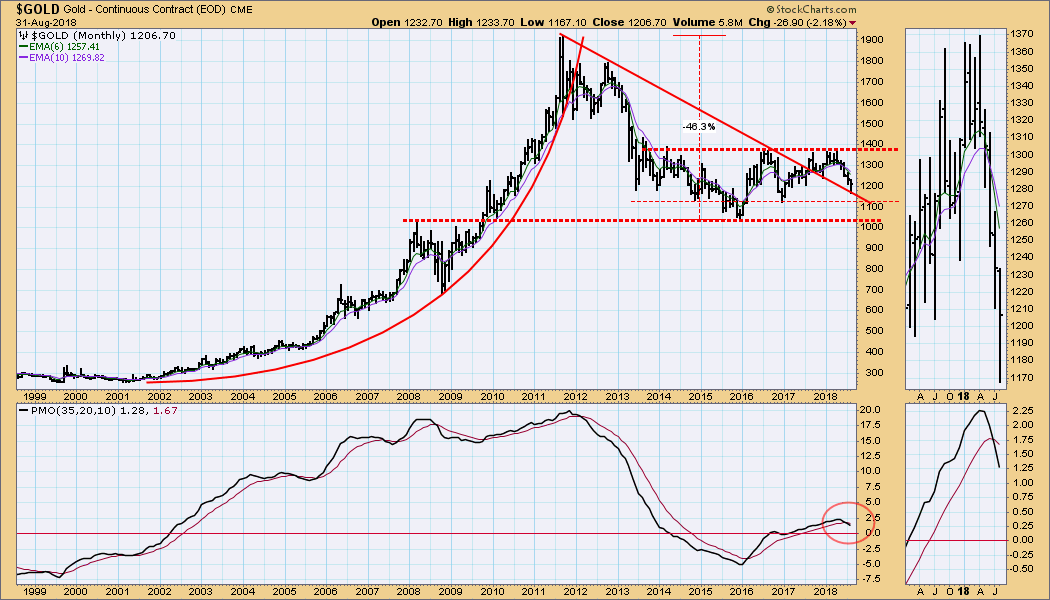
GOLD Monthly Chart: Last week I pointed out that gold had found support on the long-term declining tops line. That support is still holding, but the monthly PMO is below the signal line and falling.
CRUDE OIL (USO)
IT Trend Model: BUY as of 8/24/2018
LT Trend Model: BUY as of 11/2/2017
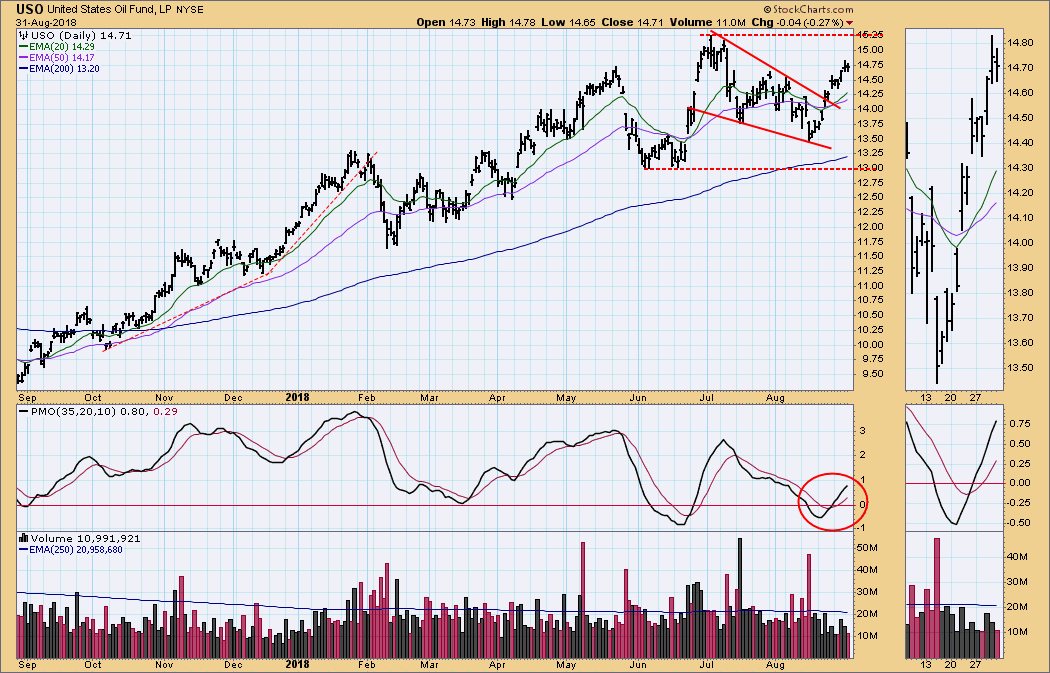
USO Daily Chart: USO broke out of a falling wedge, as expected, and seems on the way to challenge resistance at 15.25. The daily PMO bottom is robust, just the way I like them.
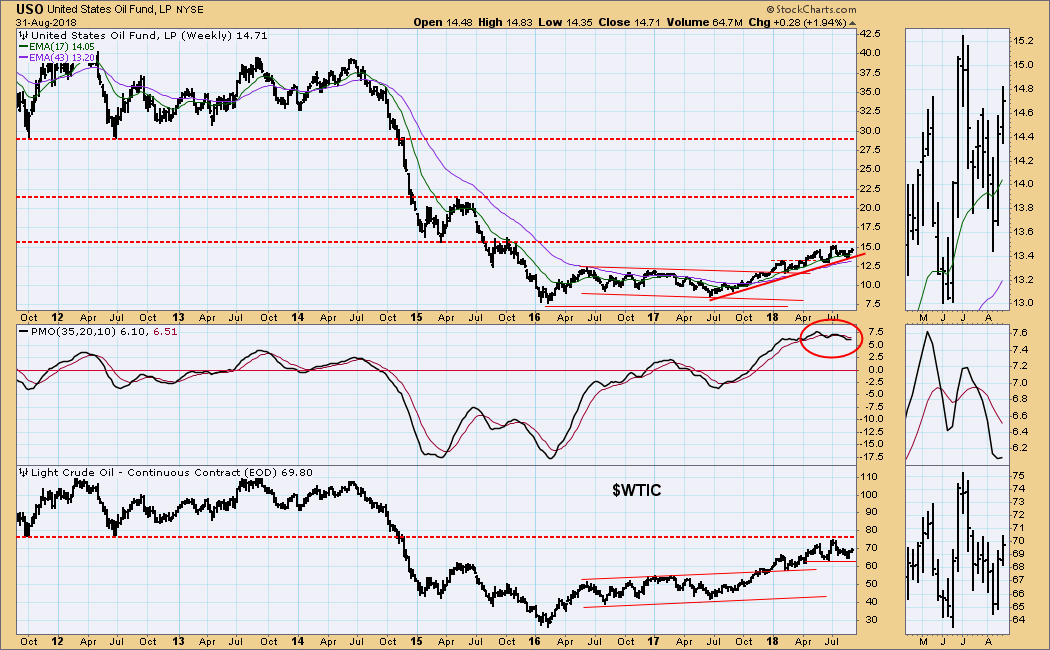
USO Weekly Chart: It would seem that USO and $WTIC are close to overhead resistance and may level out.
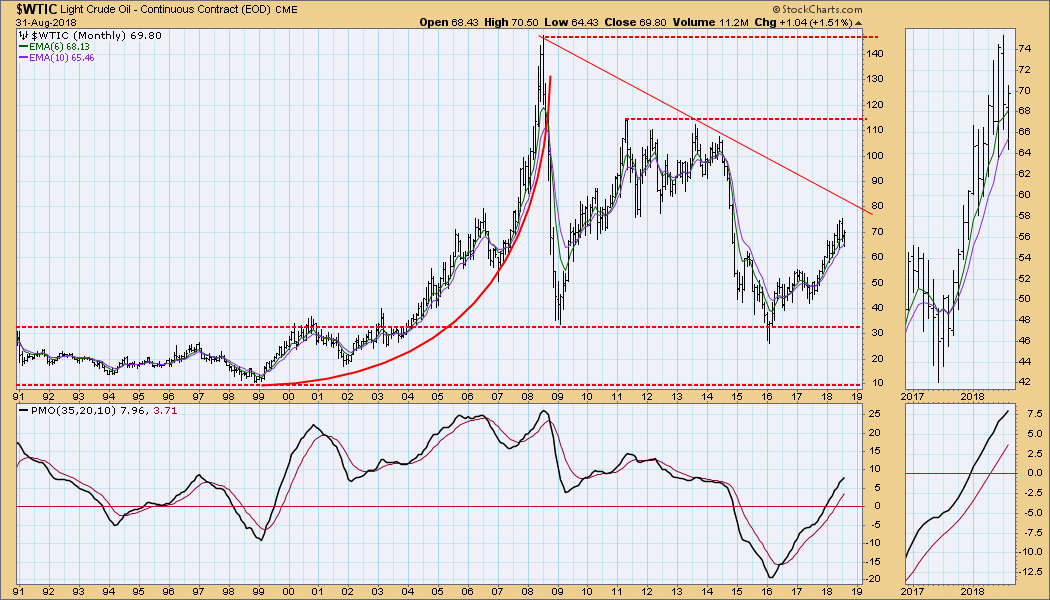
$WTIC Monthly Chart: In 2016 price bounced off a long-term support line and has rallied ever since. We can see resistance from a declining tops line at around $80, but we have to wonder where long-term horizontal resistance really is. Supply has become so plentiful that it seems unlikely crude will reach the resistance at $115, let alone $147.
BONDS (TLT)
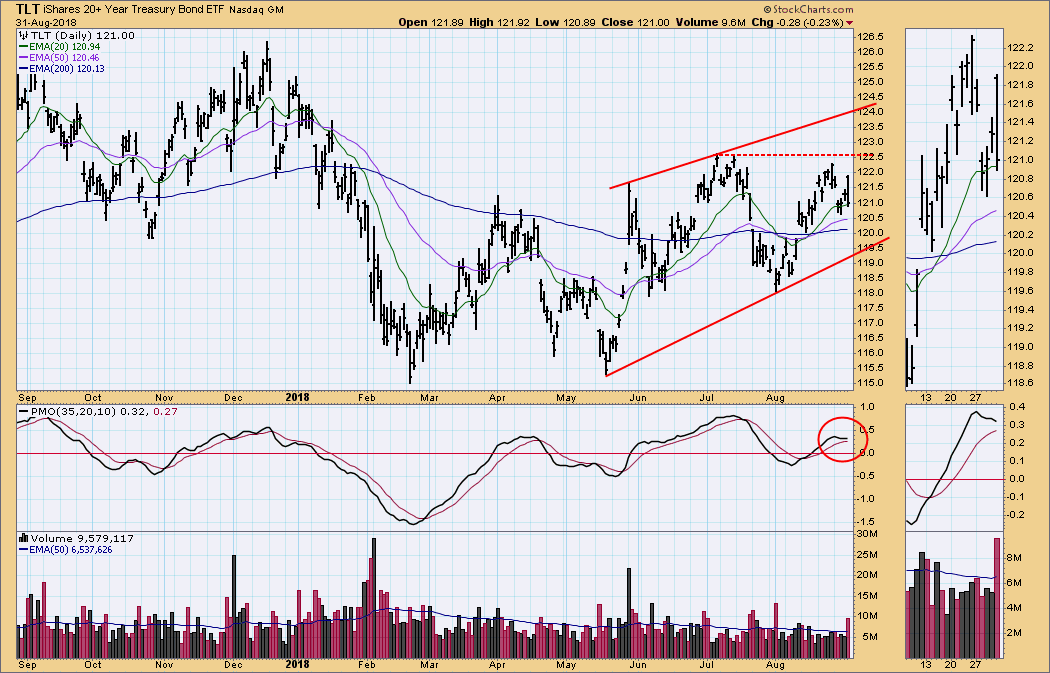
IT Trend Model: BUY as of 8/15/2018
LT Trend Model: BUY as of 8/20/2018
TLT Daily Chart: On Friday TLT tried to take another run at the overhead resistance posed by the July top; however, there was a reversal and it closed near its lows for the day. The Trend Model signals are positive, but that doesn't mean much with price moving sideways.
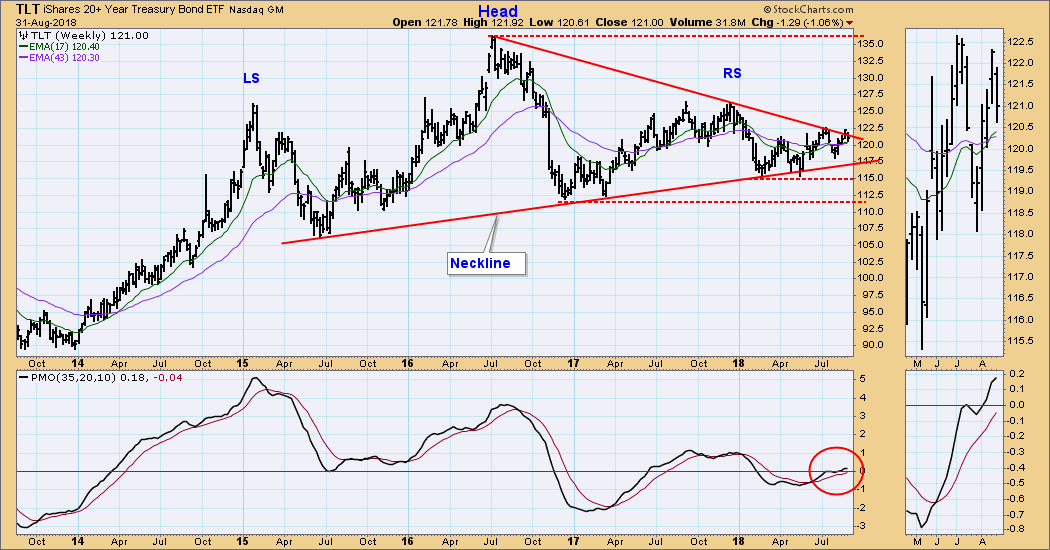
TLT Weekly Chart: Not much has changed since last week. TLT is still trying to break out of the head and shoulders pattern. The EMAs and the weekly PMO are positive.
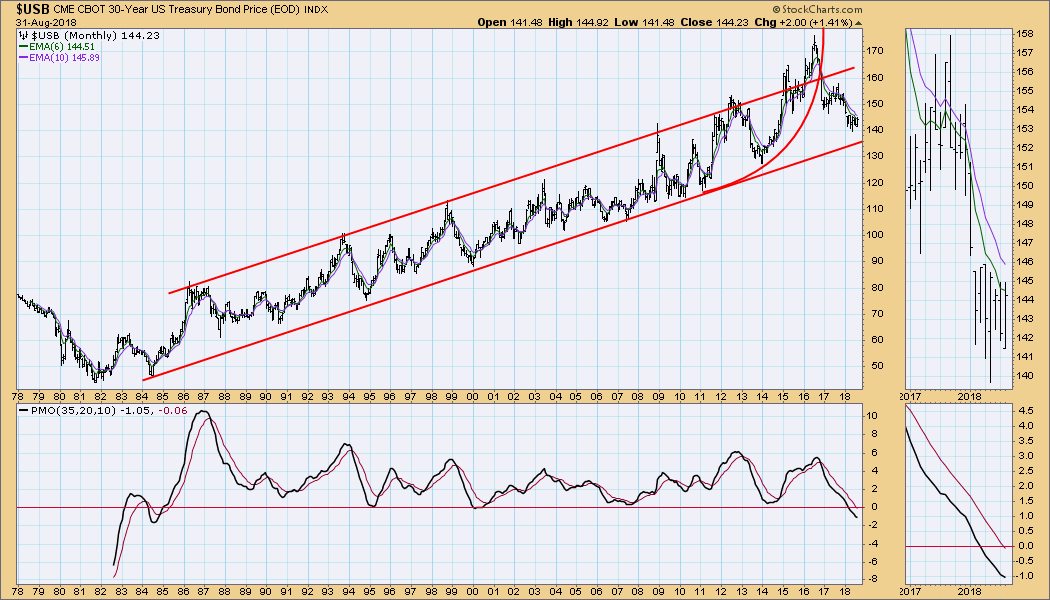
$USB Monthly Chart: After breaking out of a decades-long rising trend channel in a parabolic climax, $USB broke down from the parabolic arc and is headed toward the bottom of the channel. The monthly PMO is declining and is lower than any time since 1984. Even though shorter-term movement of TLT is somewhat positive, in my opinion long bonds have entered a long-term bear market. (Keep in mind that $USB and TLT are not the same thing. TLT is an ETF for 20+ Year T-Bonds, and $USB is the 30-Year T-Bond).
**Don't miss any of the DecisionPoint commentaries! Go to the "Notify Me" box toward the end of this blog page to be notified as soon as they are published.**
Technical Analysis is a windsock, not a crystal ball.
Happy Charting!
- Carl
NOTE: The signal status reported herein is based upon mechanical trading model signals, specifically, the DecisionPoint Trend Model. They define the implied bias of the price index based upon moving average relationships, but they do not necessarily call for a specific action. They are information flags that should prompt chart review. Further, they do not call for continuous buying or selling during the life of the signal. For example, a BUY signal will probably (but not necessarily) return the best results if action is taken soon after the signal is generated. Additional opportunities for buying may be found as price zigzags higher, but the trader must look for optimum entry points. Conversely, exit points to preserve gains (or minimize losses) may be evident before the model mechanically closes the signal.
Helpful DecisionPoint Links:
DecisionPoint Shared ChartList and DecisionPoint Chart Gallery
Price Momentum Oscillator (PMO)
Swenlin Trading Oscillators (STO-B and STO-V)
