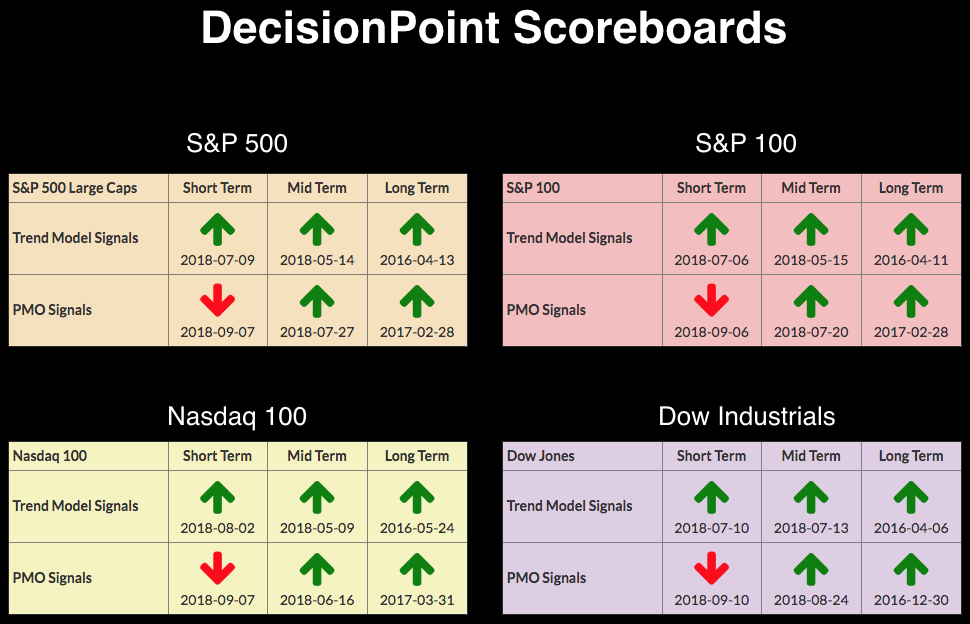
 No changes to the DecisionPoint Scoreboards since the past week's PMO SELL signals were added. We've seen a slight rebound in the market the past few days and consequently, our short-term indicators are beginning to turn up from somewhat oversold territory. Unfortunately, intermediate-term indicators are still declining and some of the breadth numbers are have bearish divergences.
The DecisionPoint Alert presents an mid-week assessment of the trend and condition of the stock market (S&P 500), the U.S. Dollar, Gold, Crude Oil, and Bonds.
SECTORS
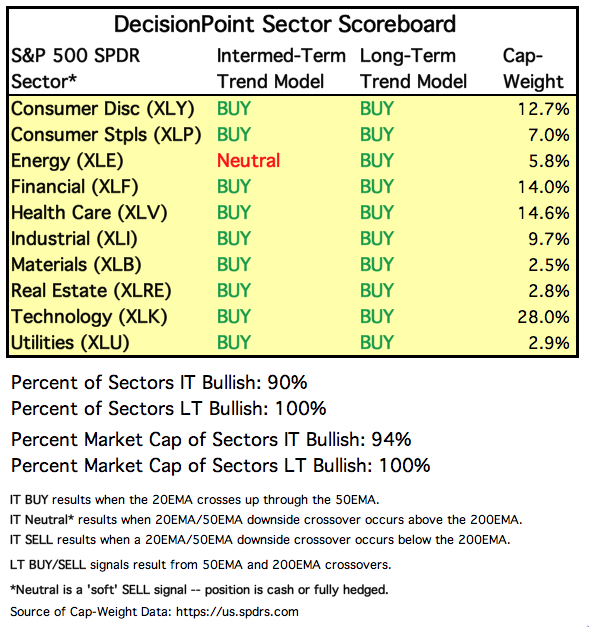
Each S&P 500 Index component stock is assigned to one, and only one, of 10 major sectors. This is a snapshot of the Intermediate-Term and Long-Term Trend Model signal status for those sectors.
STOCKS
IT Trend Model: BUY as of 5/11/2018
LT Trend Model: BUY as of 4/1/2016
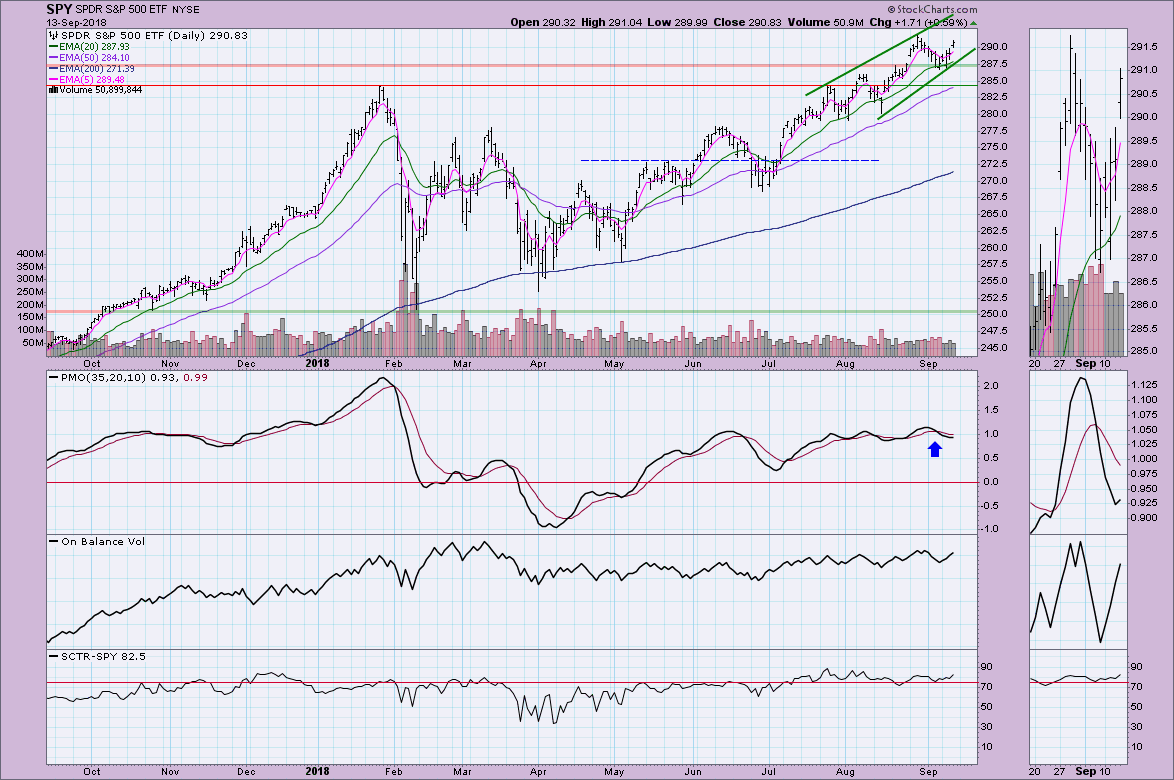
SPY Daily Chart: I've been watching a few rising trend channels, but I decided to clear the annotations and take a fresh look at price action. When I carefully drew in the trendlines, I began to see the beginning of a rising wedge which is a bearish chart pattern. Our expectation is a breakdown from the wedge. However, we do see that the PMO is turning up.
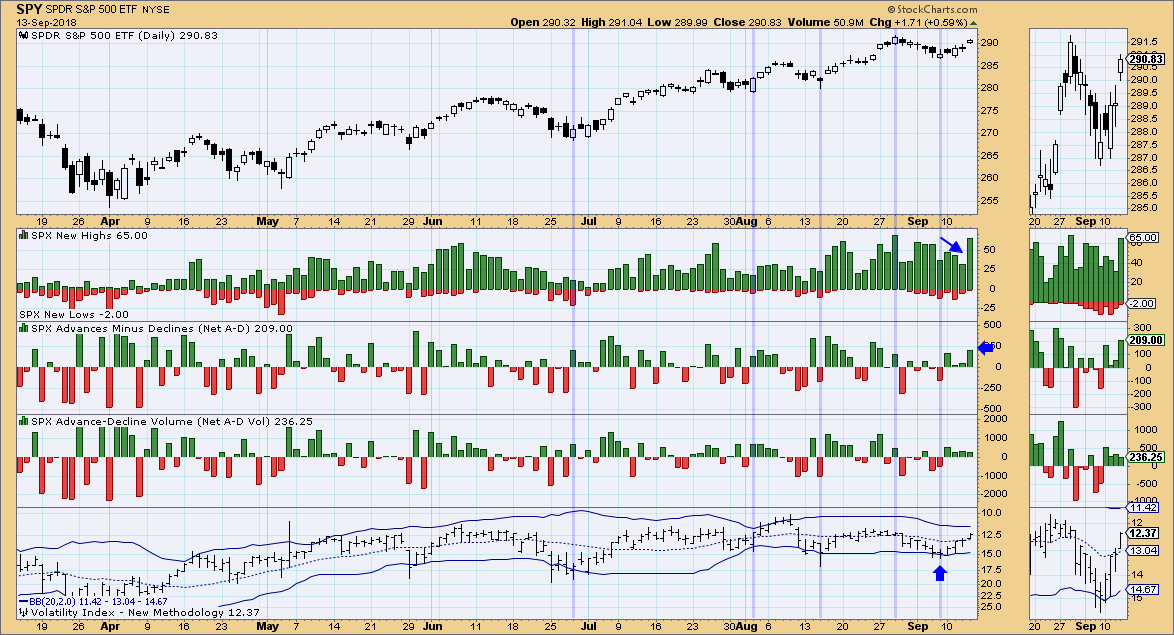
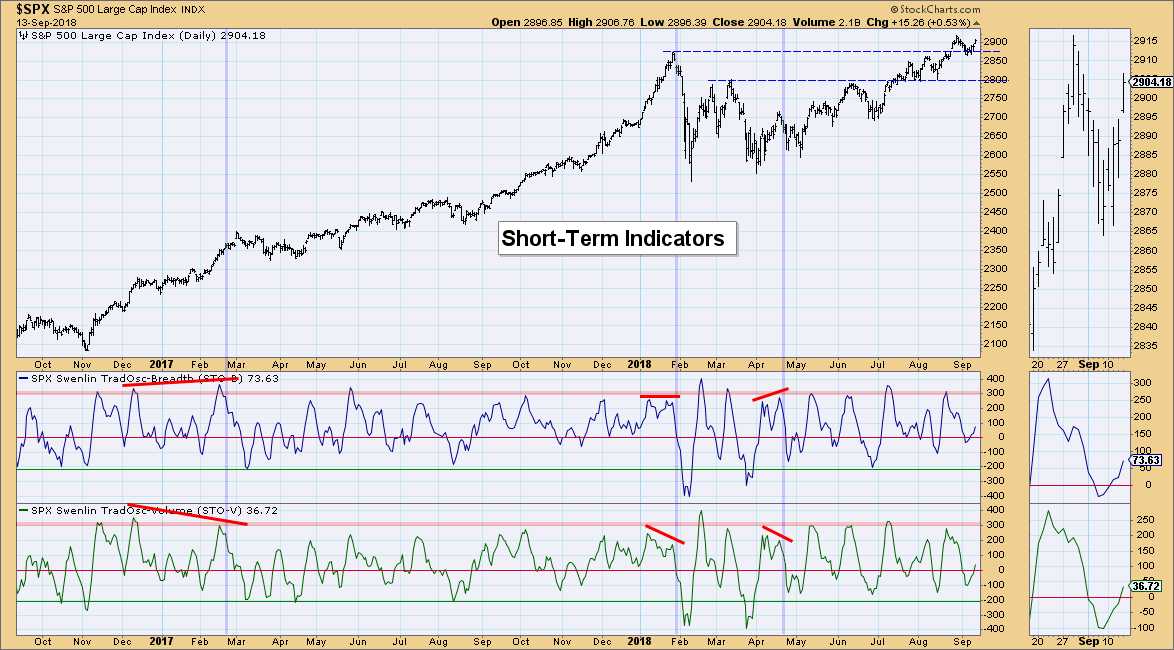
Climactic Market Indicators: There had been a consistent drop in New Highs during the very short-term rally before today that had bothered me, but participation definitely exploded today with the gap up. The VIX is on its way toward the upper Bollinger Band, but is sitting in the middle of the channel and unfortunately isn't helping much.
Short-Term Market Indicators: As noted in today's headline, we are finally seeing the Swenlin Trading Oscillators (STOs) turning back up. Both are in neutral territory and rising which is bullish short-term. This tells me we should look for a follow-on rally.
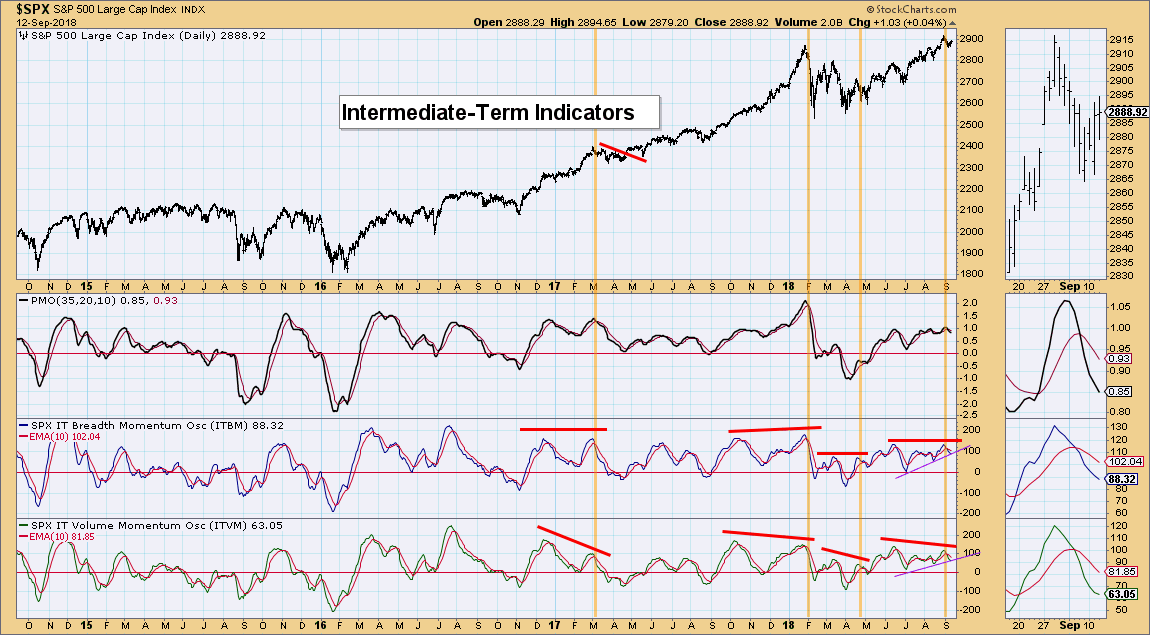
Intermediate-Term Market Indicators: These indicators are moving very slowly. I'd expected to see a broken rising trendline on both and yet they are hanging in there. The negative divergence between the ITVM and price may've played itself out with last week's decline.
Conclusion: A possible rising wedge and bearish intermediate-term indicators suggest a price decline. However, we just saw a nice bounce with rising short-term indicators. There could be a little more left in the tank to keep this rally going.
DOLLAR (UUP)
IT Trend Model: BUY as of 4/24/2018
LT Trend Model: BUY as of 5/25/2018
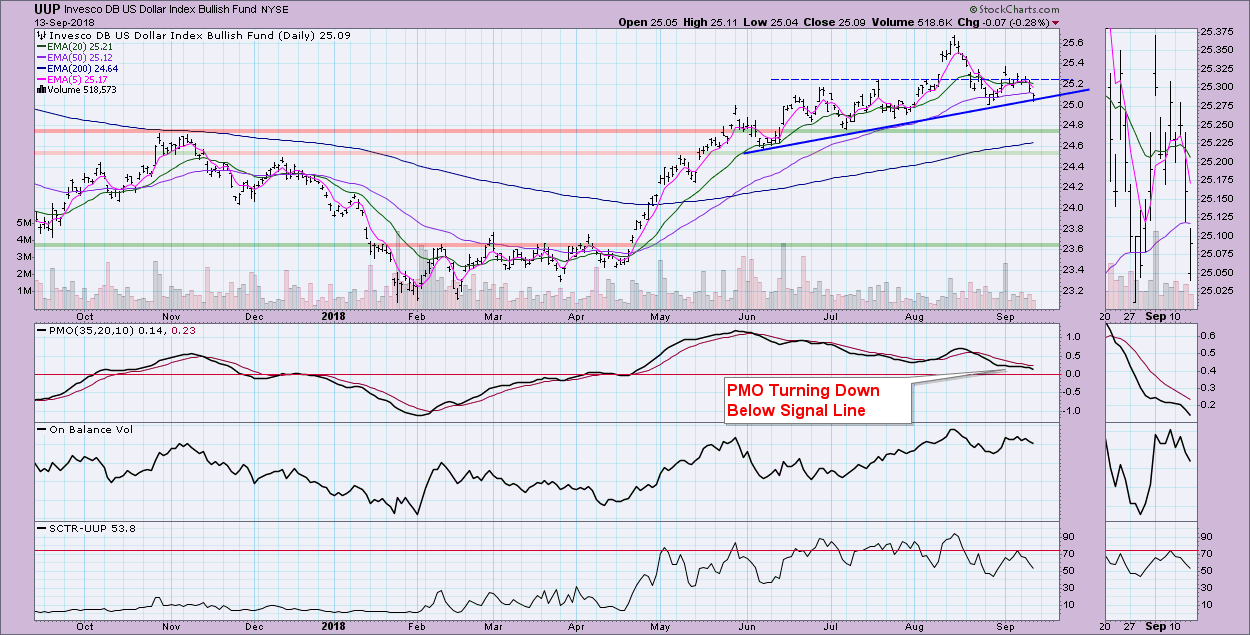
UUP Daily Chart: The Dollar is holding the rising bottom line, but I wouldn't look for it to last given the very negative acceleration of the PMO to the downside. Looking at the OBV, volume on UUP is petering off as well. I would look for a decline to test the $24.80 level.
GOLD
IT Trend Model: Neutral as of 5/2/2018
LT Trend Model: SELL as of 6/22/2018
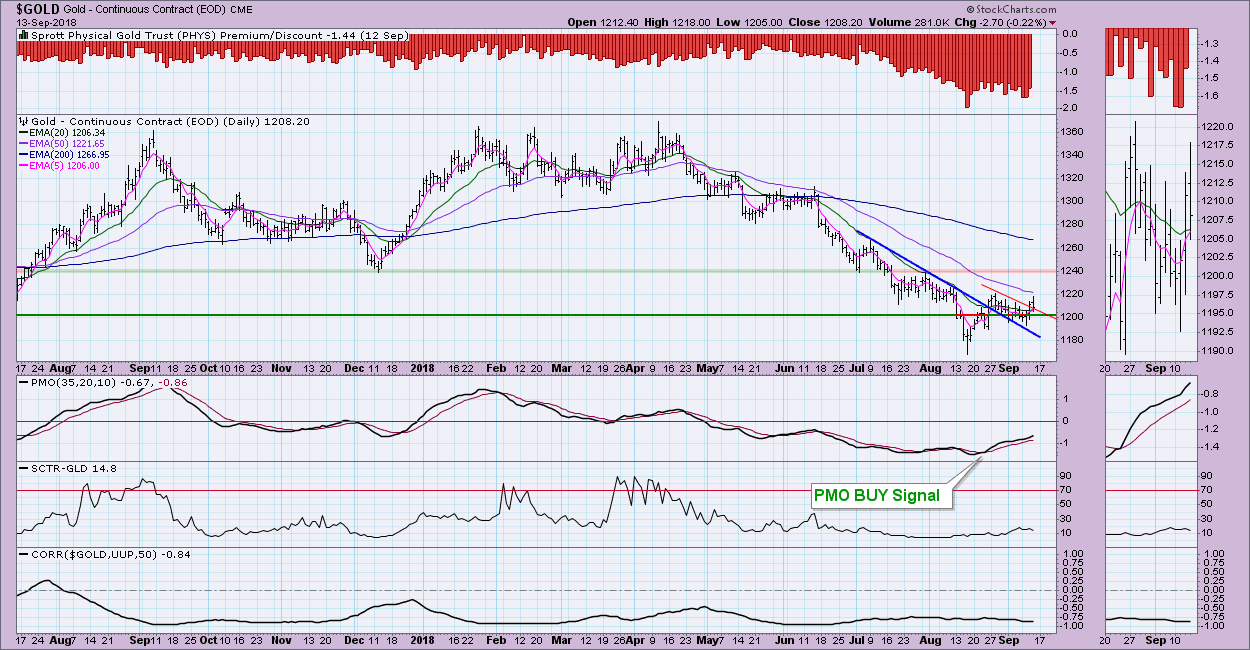
GOLD Daily Chart: The possible demise of the Dollar will help Gold; although today both Gold and the Dollar declined. This suggests more sellers. The PMO is looking very nice as it rises from the recent BUY signal. Today we saw a penetration of the declining tops trendline and price closed above the 20-EMA. Note that sentiment remains quite bearish on Gold based on the high discount rate. I've been hesitant to get too bullish on Gold, but the indicators and set-up on UUP above suggest Gold is ready to rally and test $1240.
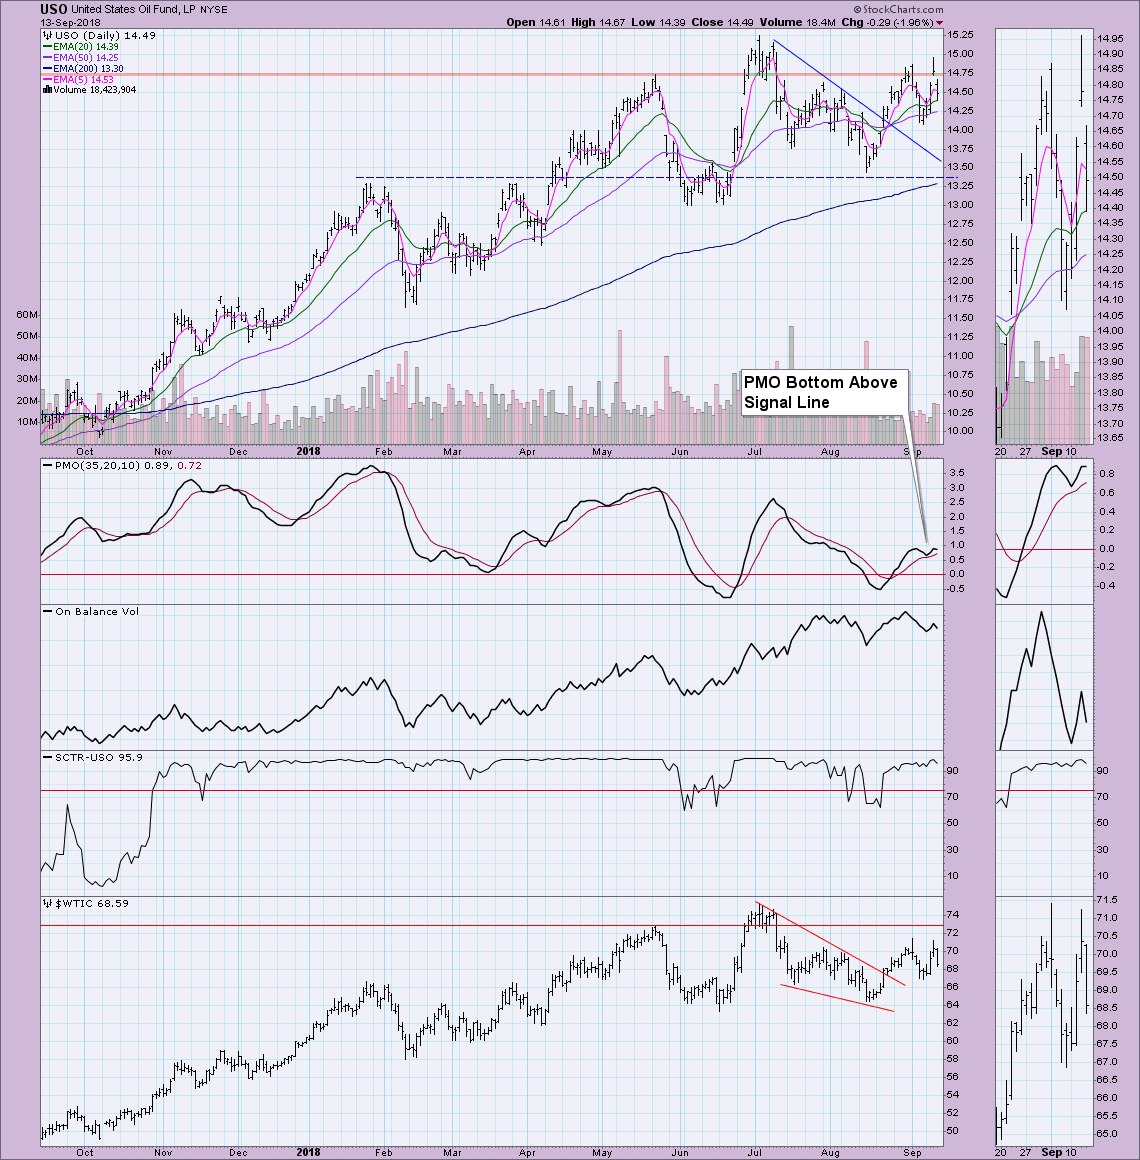
CRUDE OIL (USO)
IT Trend Model: Neutral as of 8/16/2018
LT Trend Model: BUY as of 11/2/2017
USO Daily Chart: USO gapped up on the open yesterday and managed to close just above resistance at the May high. Unfortunately it turned out to be an island reversal. The PMO had turned up above the signal line, but it's already decelerating.
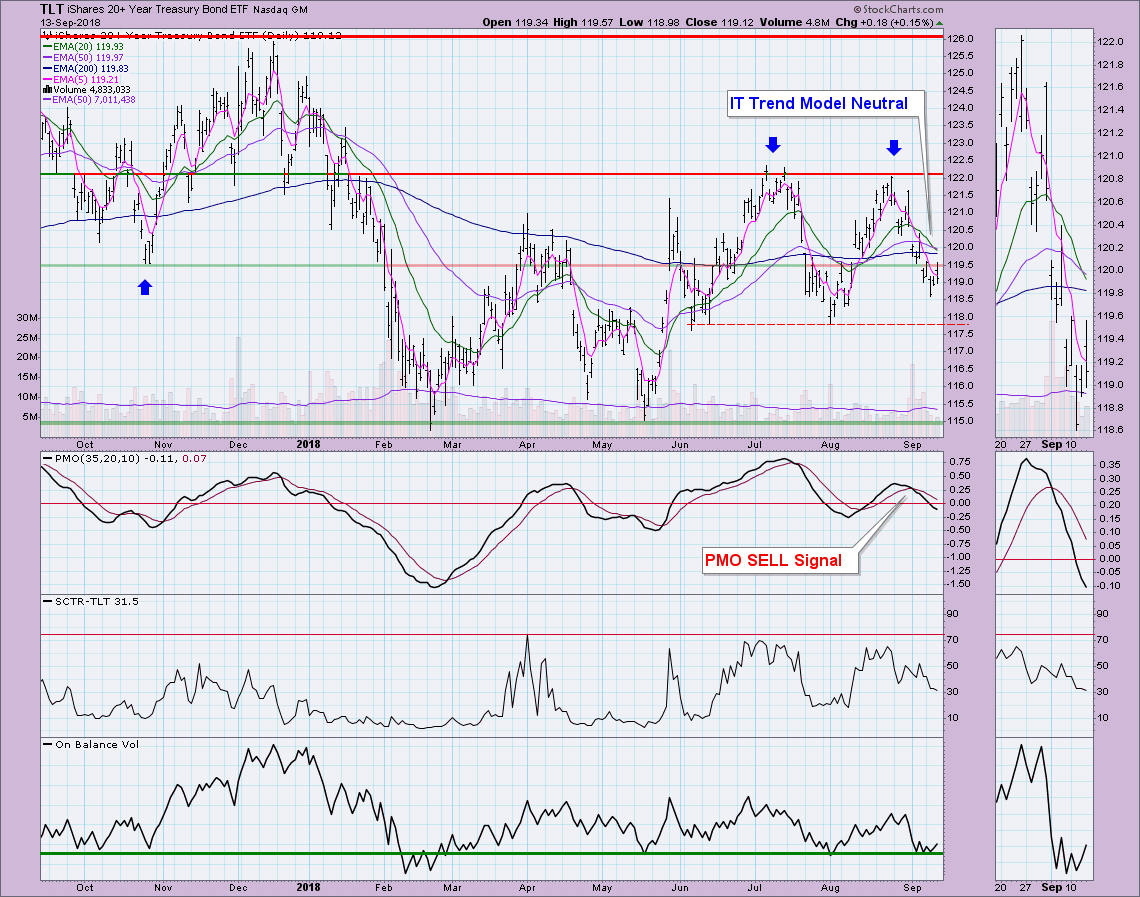
BONDS (TLT)
IT Trend Model: Neutral as of 9/13/2018
LT Trend Model: BUY as of 8/20/2018
TLT Daily Chart: A new Intermediate-Term Trend Model Neutral signal triggered today despite a slight price rise and nearly successful test of overhead resistance. A double-top has clearly formed. If it executes with a drop below $117.50, this year's lows will be tested and likely broken. The OBV is still managing to stay above its annual lows, but not for long. I'd stay away from this area of the market.
Technical Analysis is a windsock, not a crystal ball.
Happy Charting!
- Erin
**Don't miss any of the DecisionPoint commentaries! Go to the "Notify Me" box toward the end of this blog page to be notified as soon as they are published.**
NOTE: The signal status reported herein is based upon mechanical trading model signals, specifically, the DecisionPoint Trend Model. They define the implied bias of the price index based upon moving average relationships, but they do not necessarily call for a specific action. They are information flags that should prompt chart review. Further, they do not call for continuous buying or selling during the life of the signal. For example, a BUY signal will probably (but not necessarily) return the best results if action is taken soon after the signal is generated. Additional opportunities for buying may be found as price zigzags higher, but the trader must look for optimum entry points. Conversely, exit points to preserve gains (or minimize losses) may be evident before the model mechanically closes the signal.
Helpful DecisionPoint Links:
DecisionPoint Shared ChartList and DecisionPoint Chart Gallery
Price Momentum Oscillator (PMO)
Swenlin Trading Oscillators (STO-B and STO-V)
