I normally don't show an in-progress monthly chart because a monthly chart isn't final until the end of the month, but this week's market action was so severe, I thought that a 'big picture' view would be most helpful. The cyclical bull market rising trend line drawn from the 2016 low was decisively violated this week with a breakdown of over -5%. A 'decisive' break (-3% or greater) carries with it the assumption that lower prices will follow. This assumption is reinforced by the fact that the monthly PMO has topped and crossed down through the signal line (EOM pending).
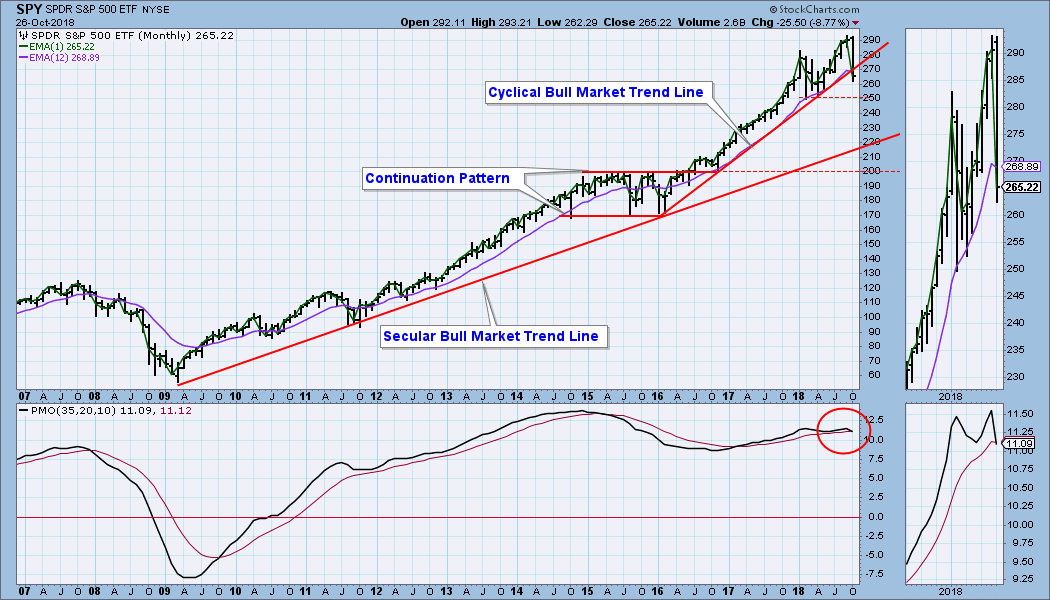
There is horizontal support at this year's lows, but the next major support is on the secular bull market rising trend line, drawn from the 2009 low. A decline of about -25% from the all-time highs would take price back to that line, giving us a pretty tidy cyclical bear market. I'm not predicting that, but it is certainly a possible outcome.
The DecisionPoint Weekly Wrap presents an end-of-week assessment of the trend and condition of the stock market (S&P 500), the U.S. Dollar, Gold, Crude Oil, and Bonds.
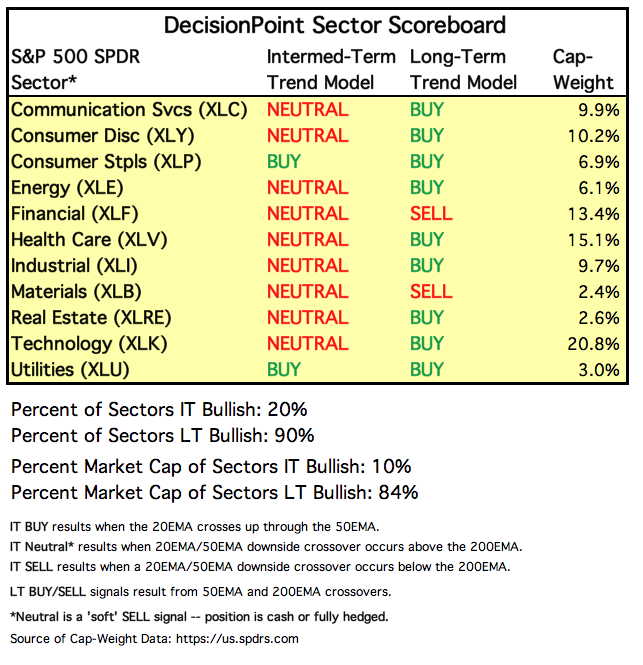
SECTORS
Each S&P 500 Index component stock is assigned to one, and only one, of 11 major sectors. This is a snapshot of the Intermediate-Term and Long-Term Trend Model signal status for those sectors.
STOCKS
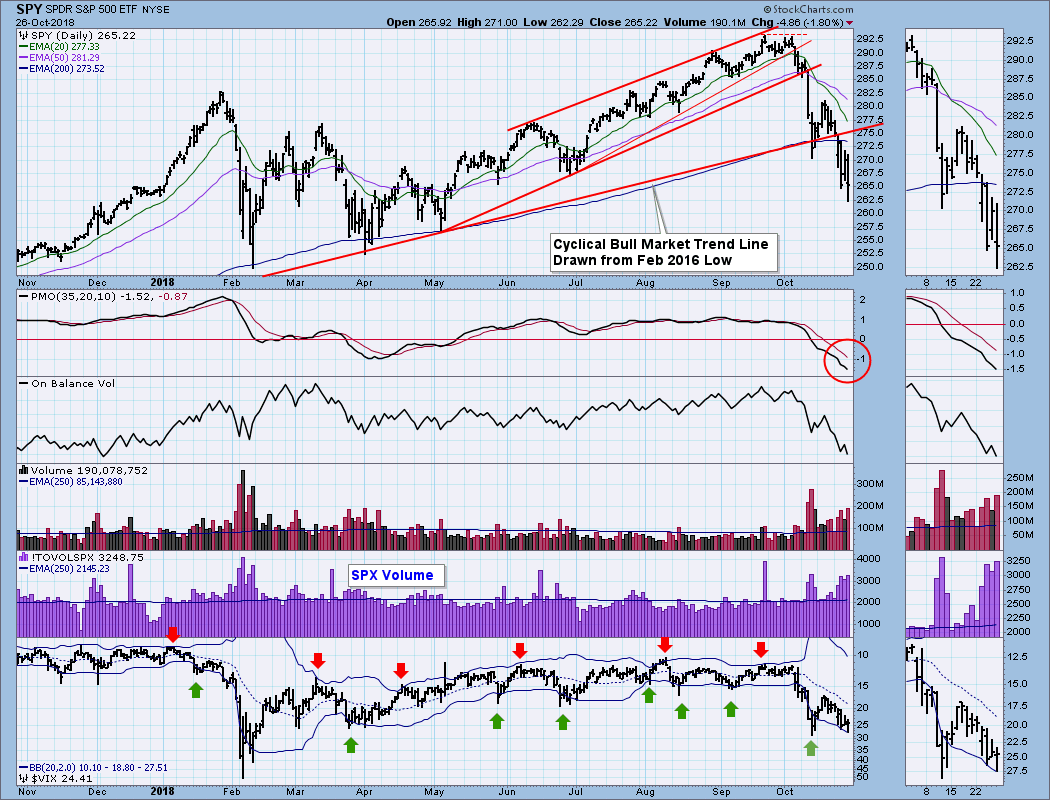
IT Trend Model: NEUTRAL as of 10/15/2018
LT Trend Model: BUY as of 4/1/2016
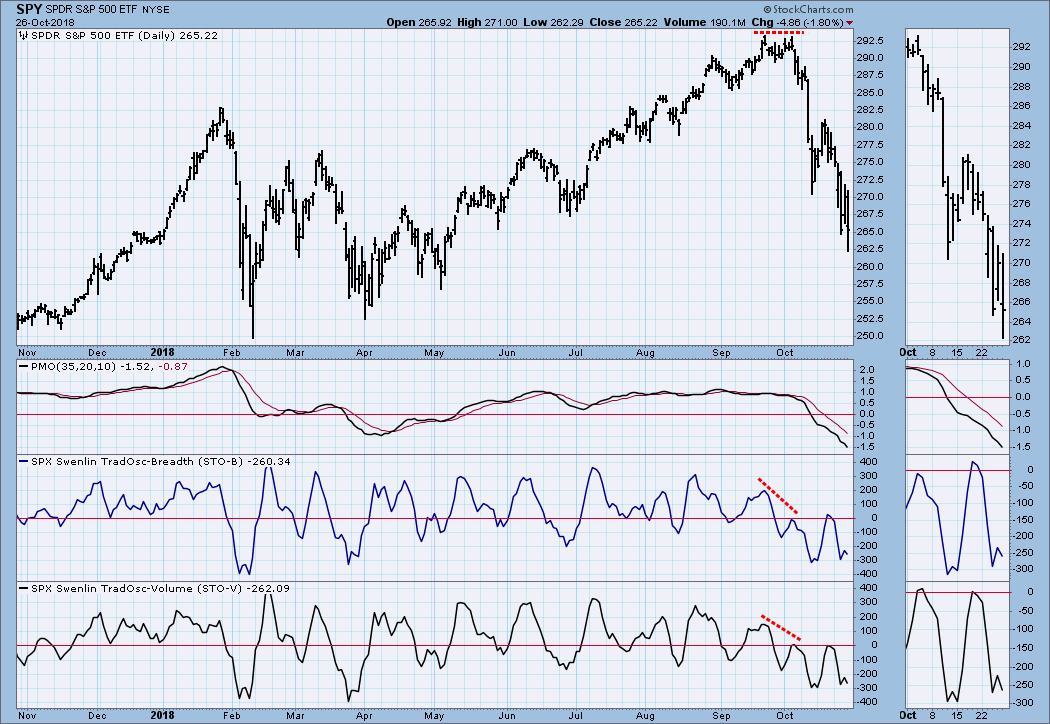
SPY Daily Chart: At the end of last week we were looking for a retest of the October 11 lows, and and this week it looked as if there was a successful retest on Tuesday. Forget that. We got three more days of wild swings with a large net change to the downside. Note that the VIX has still not gotten to the extremes we saw in February.
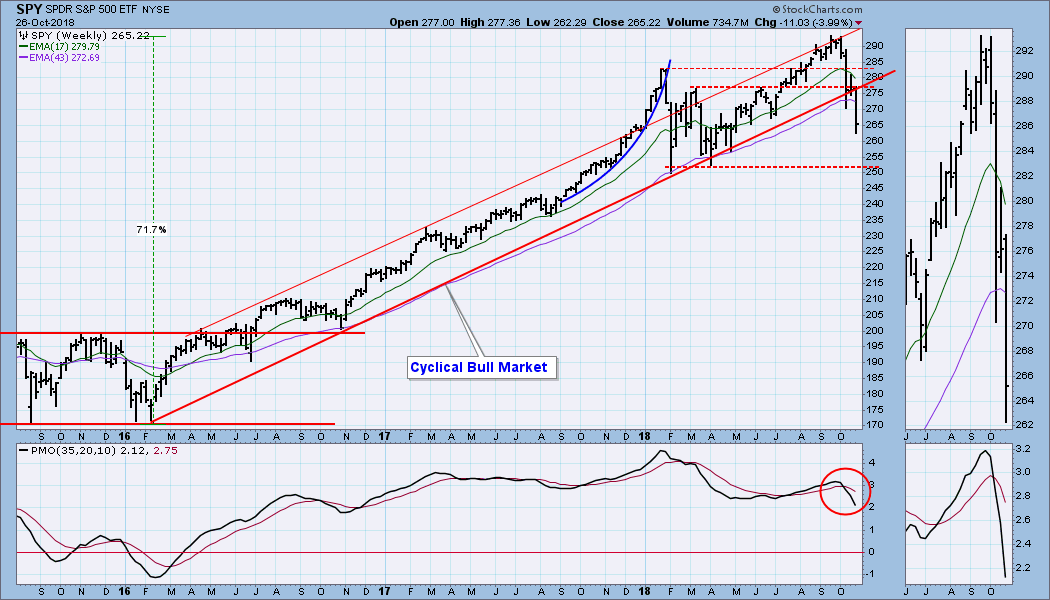
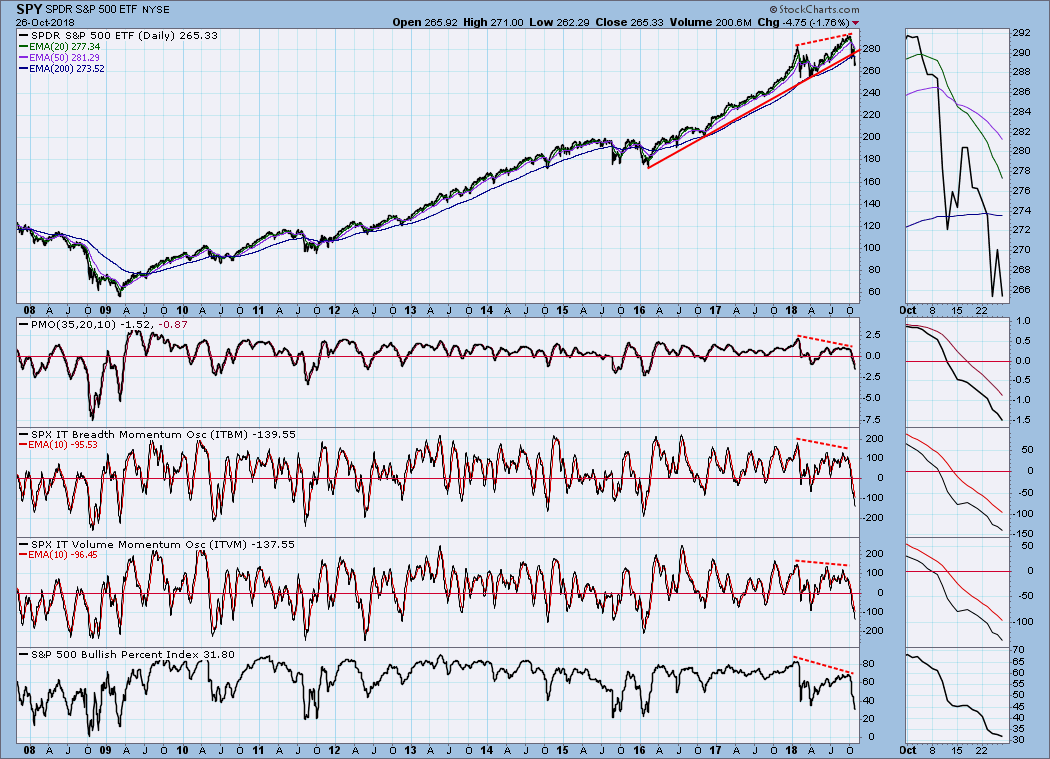
SPY Weekly Chart: This chart certainly emphasizes the strong break below the rising trend line, and the condition of the weekly PMO is very bearish.
Short-Term Market Indicators: Oversold in this time frame.
Intermediate-Term Market Indicators: These indicators are oversold, but I put up an 11-year chart to show just how oversold they can get. The BPI is not yet as oversold as it was in 2016. By comparison, only 21% of S&P 500 stocks are on IT Trend Model BUY signals.
CONCLUSION: Last week I said it isn't officially a bear market until the 50EMA crosses down through the 200EMA; however, unofficially, I think that the bear market has definitely arrived. The cyclical bull market rising trend line break is a huge piece of negative evidence, and the bearish weekly and monthly PMOs are a resounding confirmation. I also said recently that a PMO bottom is a good first sign that a price bottom is in the making -- it is not a sure thing for catching a rally, but waiting for it provides a good excuse for not acting prematurely. A good example of what I mean was demonstrated on Thursday. At one point the market was up almost +3% from Wednesday's low, but the PMO never turned up.
There are many indicators becoming oversold, but in a bear market, oversold is more likely to be an indication of subsidence than it is of compression that will fuel a rally.
DOLLAR (UUP)
IT Trend Model: BUY as of 4/24/2018
LT Trend Model: BUY as of 5/25/2018
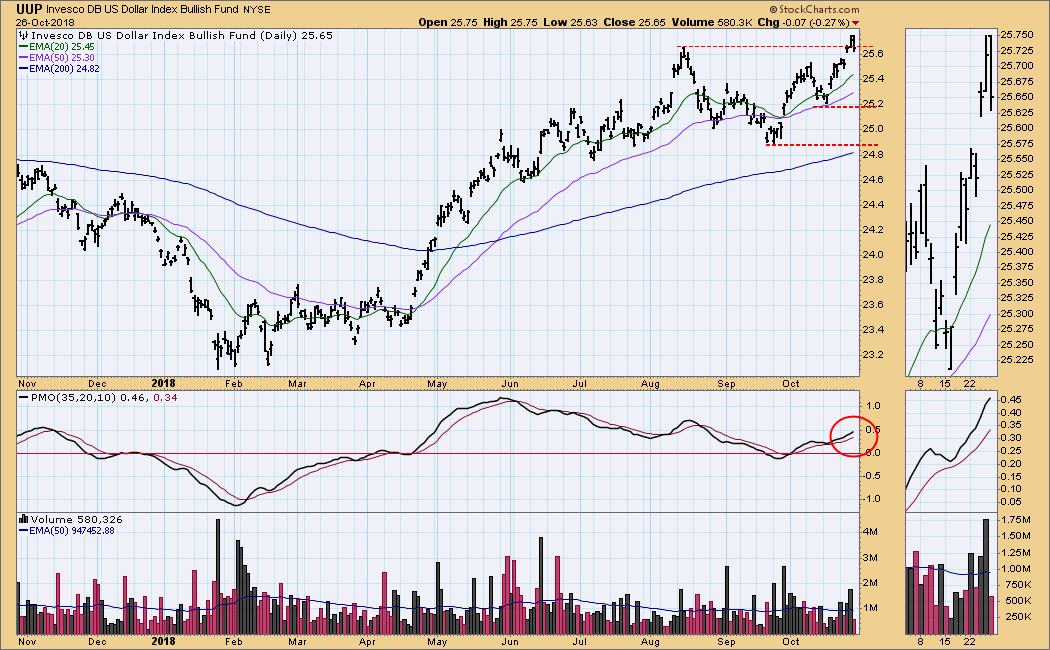
UUP Daily Chart: Price movement and the daily PMO are positive for UUP, which moved to new 52-week highs this week.
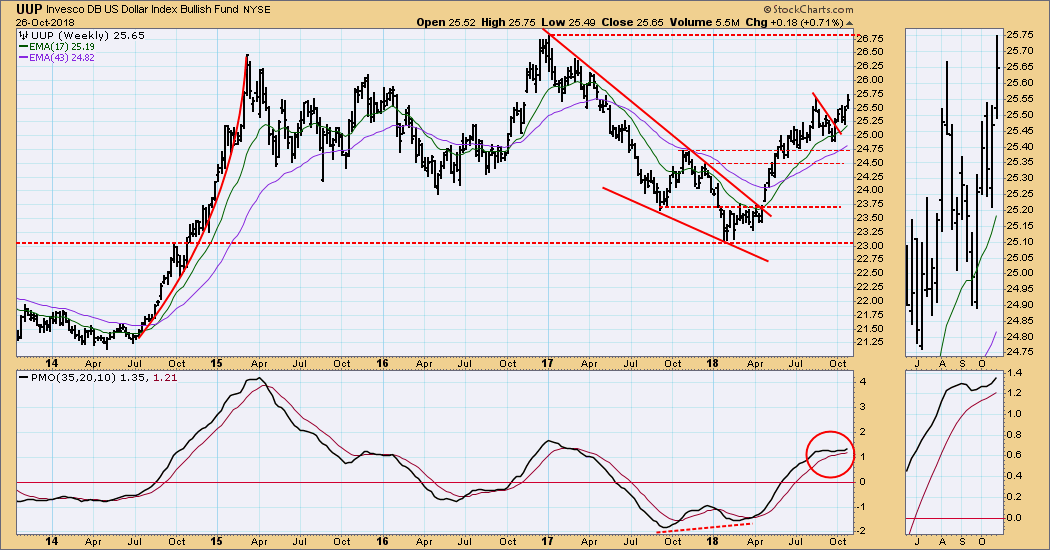
UUP Weekly Chart: In this time frame we can see the potential upside at the line of resistance drawn across the 2017 top. Please note that since the 2015 top UUP has basically been consolidating, implying that UUP could go much higher if it breaks out of the long-term trading range.
GOLD
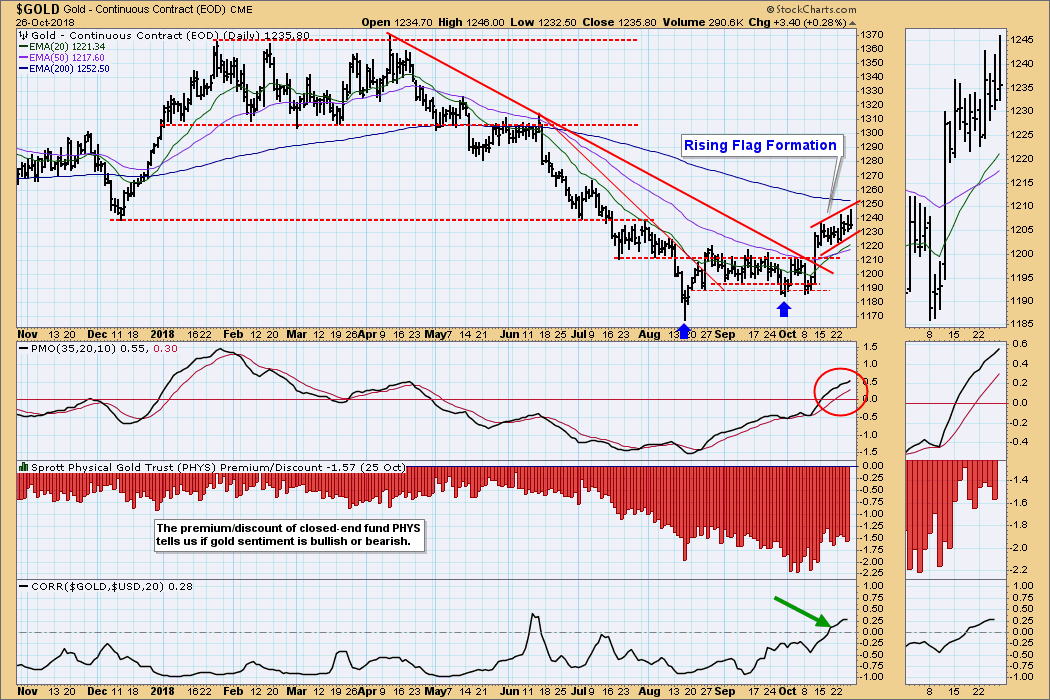
IT Trend Model: BUY as of 10/19/2018
LT Trend Model: SELL as of 6/22/2018
GOLD Daily Chart: It is unusual, but there is currently a positive correlation between gold and the dollar, meaning that gold has been rallying in spite of the dollar's strength. Also, after a breakout earlier this month, gold has moved into a rising flag formation. In my opinion, a rising flag is not as positive as a flag that forms on a pullback, which shows compression building. But it will have to do. Sentiment remains negative, but look for it to turn positive if the rally persists.
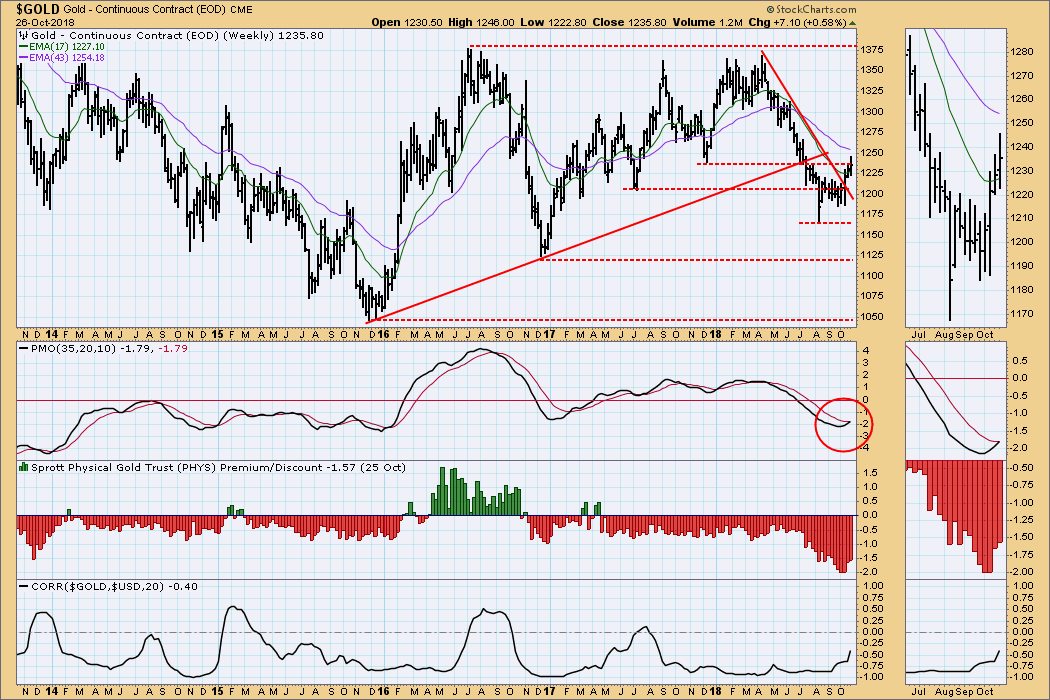
GOLD Weekly Chart: The weekly PMO has bottomed and it is about to cross up through the signal line. This chart looks bullish.
CRUDE OIL (USO)
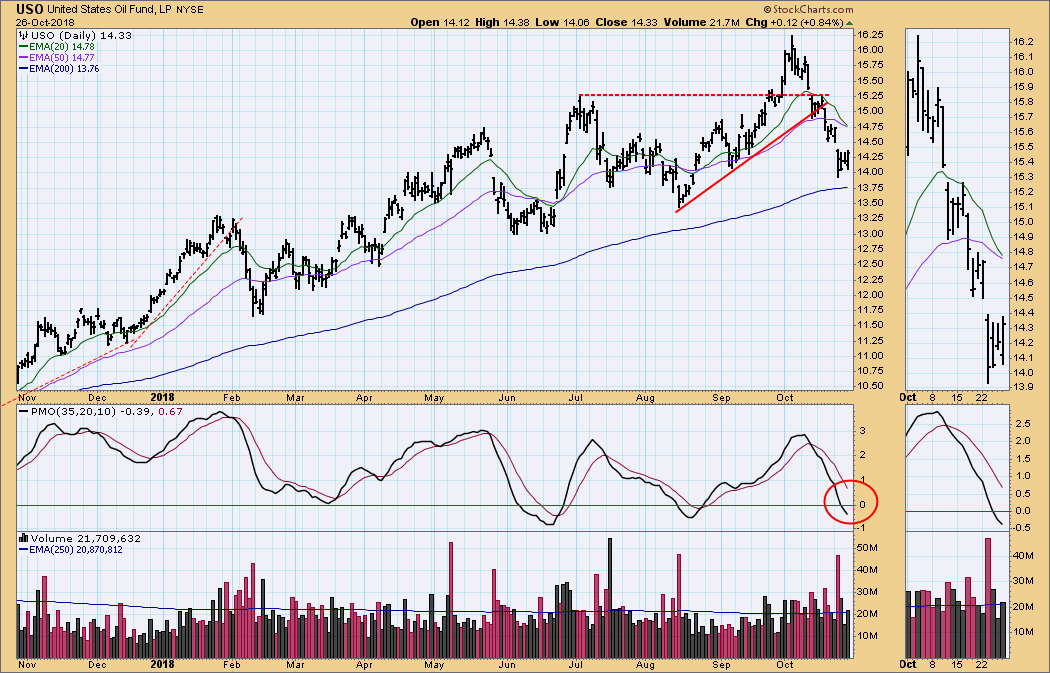
IT Trend Model: BUY as of 8/24/2018
LT Trend Model: BUY as of 11/2/2017
USO Daily Chart: Unless USO rallies substantially on Monday (above the 20EMA and 50EMA), there will be a downside EMA crossover, which will change the IT Trend Model from BUY to NEUTRAL. Note that 20/50EMA downside crossovers in June and August actually marked the end of short-term declines, and the same could happen this time.
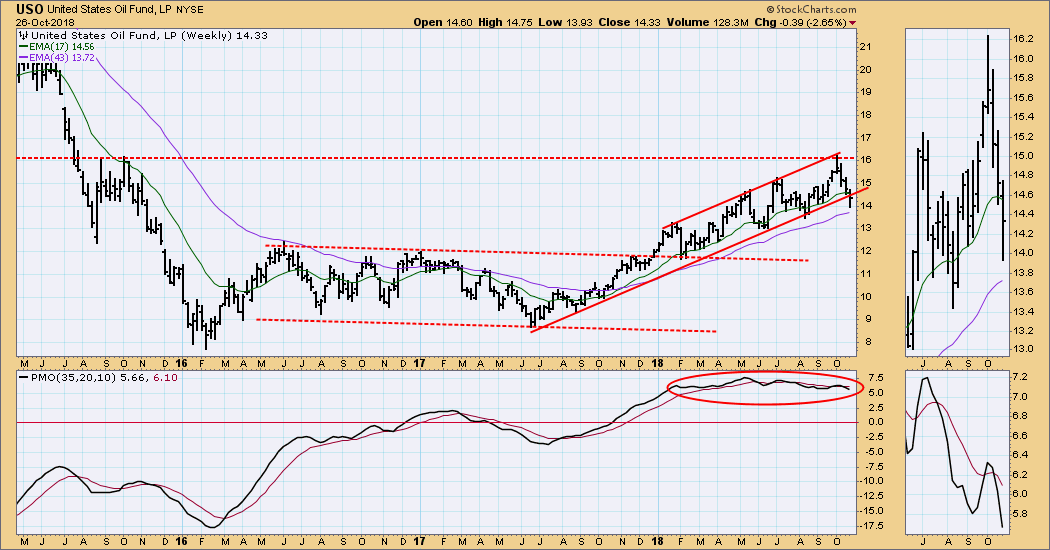
USO Weekly Chart: In this time frame we can see that the upward progress of USO was stopped by long-term overhead resistance. It is a guess on my part, but I don't think that there is a fundamental basis for crude to go substantially higher, and I am looking for USO to start moving sideways.
BONDS (TLT)
IT Trend Model: NEUTRAL as of 9/13/2018
LT Trend Model: SELL as of 9/18/2018
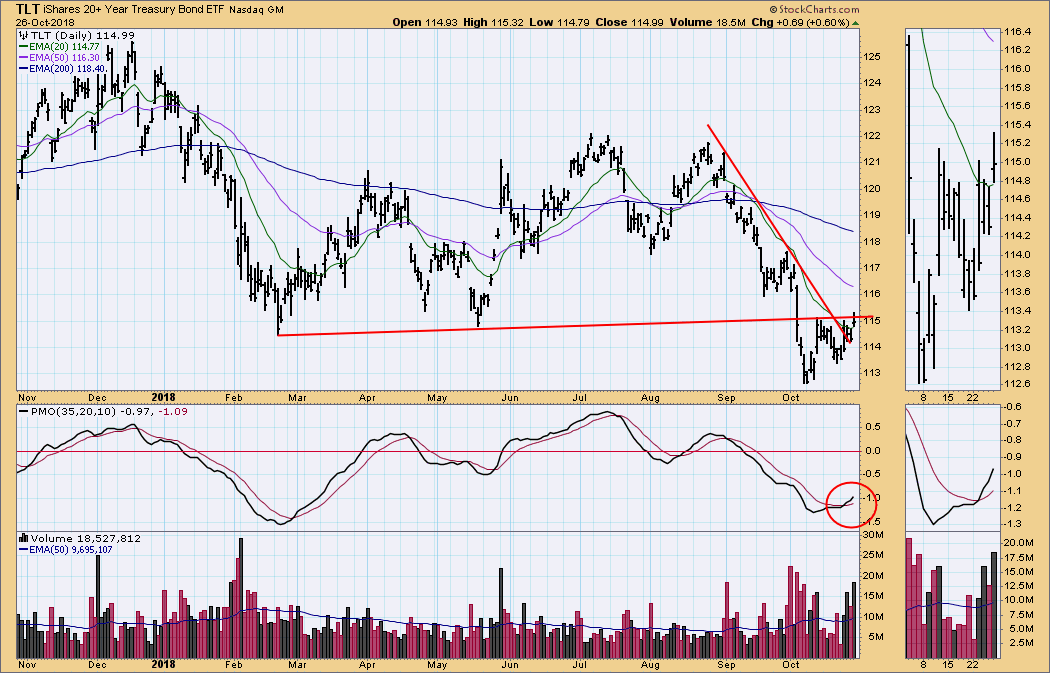
TLT Daily Chart: The October low for the daily PMO was oversold, and the configuration has turned bullish since that low. On Friday TLT made a third attempt to penetrate overhead resistance, and I think a rally is possible.
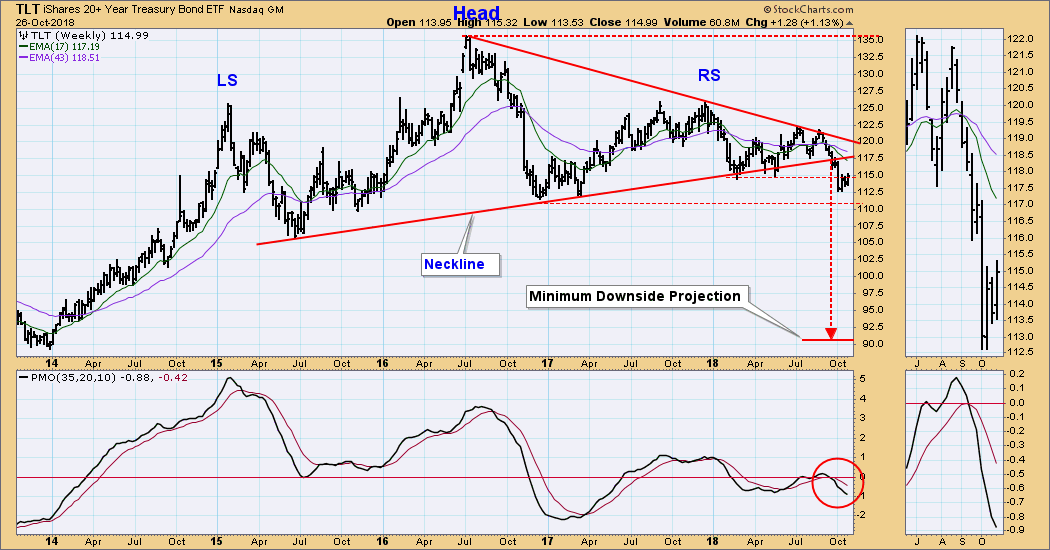
TLT Weekly Chart: The weekly chart allows for a possible rally to the head and shoulders neckline (117.5), but the ultimate outcome is probably a decline toward the minimum downside projection.
**Don't miss any of the DecisionPoint commentaries! Go to the "Notify Me" box toward the end of this blog page to be notified as soon as they are published.**
Technical Analysis is a windsock, not a crystal ball.
Happy Charting!
- Carl
NOTE: The signal status reported herein is based upon mechanical trading model signals, specifically, the DecisionPoint Trend Model. They define the implied bias of the price index based upon moving average relationships, but they do not necessarily call for a specific action. They are information flags that should prompt chart review. Further, they do not call for continuous buying or selling during the life of the signal. For example, a BUY signal will probably (but not necessarily) return the best results if action is taken soon after the signal is generated. Additional opportunities for buying may be found as price zigzags higher, but the trader must look for optimum entry points. Conversely, exit points to preserve gains (or minimize losses) may be evident before the model mechanically closes the signal.
Helpful DecisionPoint Links:
DecisionPoint Shared ChartList and DecisionPoint Chart Gallery
Price Momentum Oscillator (PMO)
Swenlin Trading Oscillators (STO-B and STO-V)
