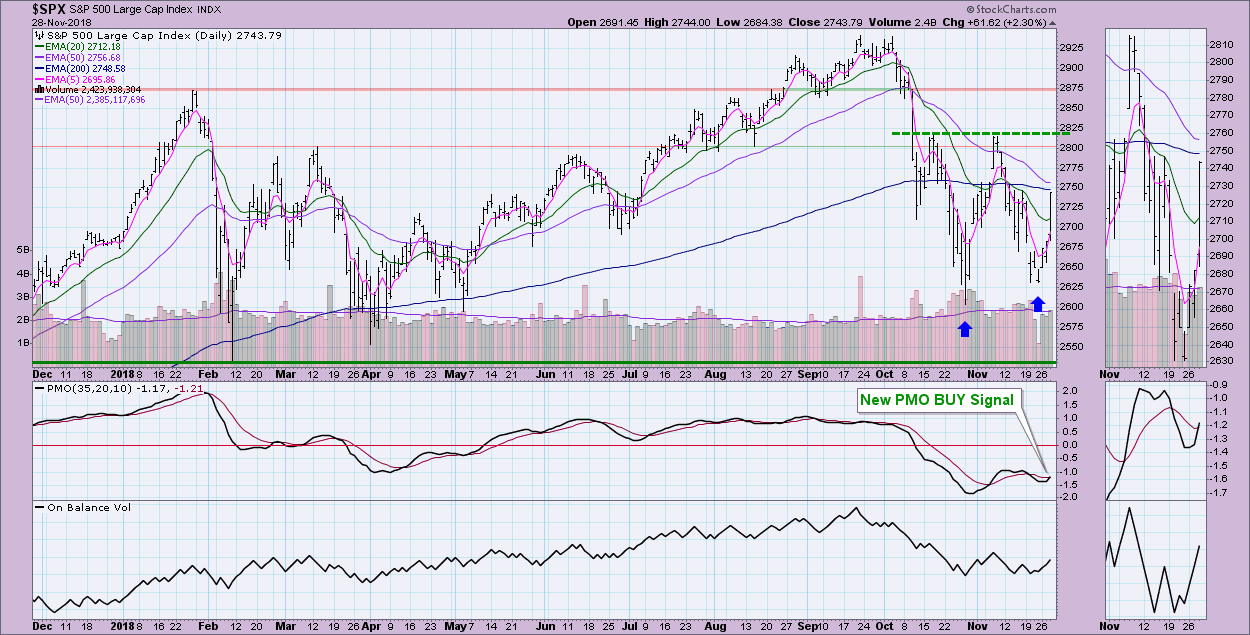
 In the midst of recording this morning's MarketWatchers LIVE show, the Fed Chairman Powell's remarks were released. They were dovish and the market rallied in relief. The rally was strong enough to pull the ST Price Momentum Oscillator (PMO) upward and trigger a new BUY signal.
The DecisionPoint Alert presents a mid-week assessment of the trend and condition of the stock market (S&P 500), the U.S. Dollar, Gold, Crude Oil and Bonds.
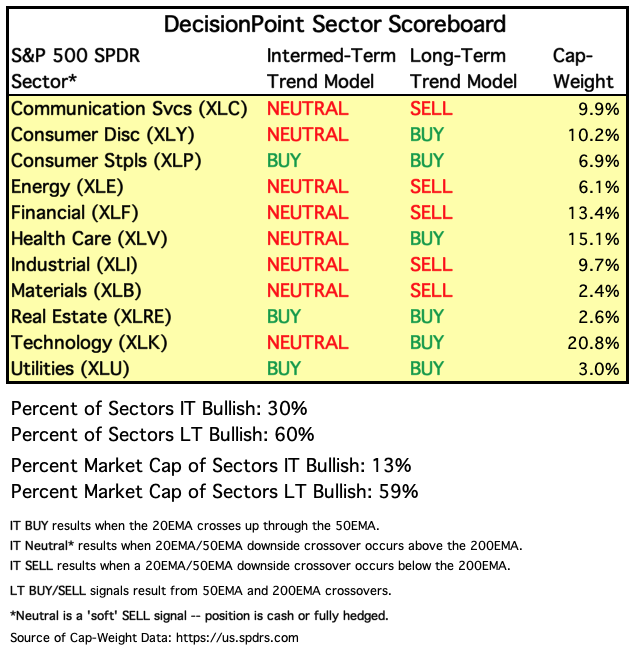
SECTORS
Each S&P 500 Index component stock is assigned to one, and only one, of 11 major sectors. This is a snapshot of the Intermediate-Term and Long-Term Trend Model signal status for those sectors.
STOCKS
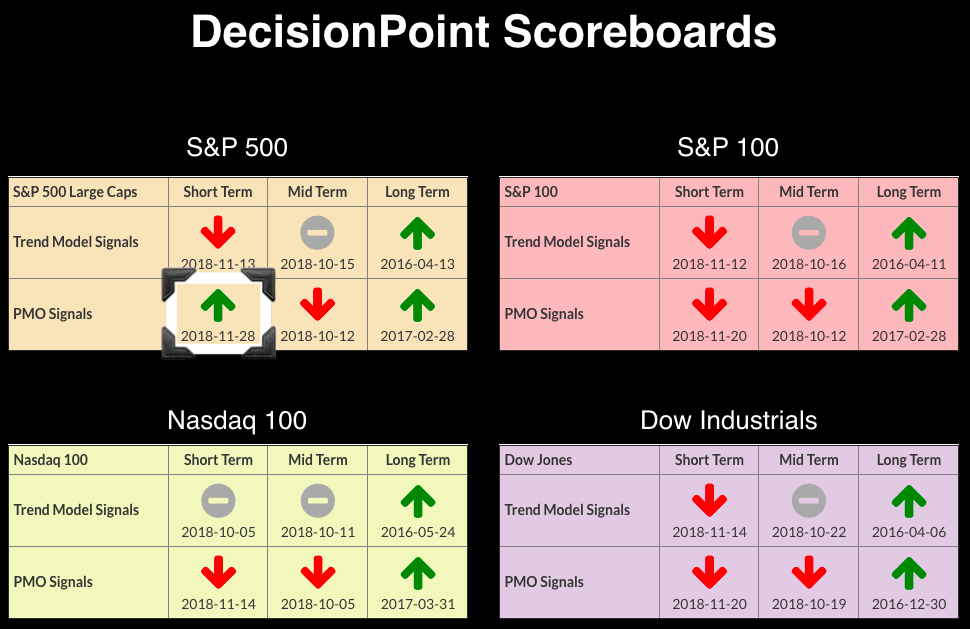
IT Trend Model: Neutral as of 10/15/2018
LT Trend Model: BUY as of 4/1/2016
SPY Daily Chart: Looking at the PMO bottoms and the corresponding price lows, there is a bullish confirmation as both are rising. Marc Chaikin, our guest today on MWL, discussed what he sees as a bullish double-bottom forming to prevent a bear market. I've been on the bear market side and, while today's rally was impressive, there are plenty of other worries that investors will likely rediscover (i.e. G20 meeting, Brexit, WTO, on and on). If this is a double-bottom pattern, price will need break out above the confirmation line at the November top. I'll get on board with bulls if we can avoid a 50/200-EMA negative crossover.
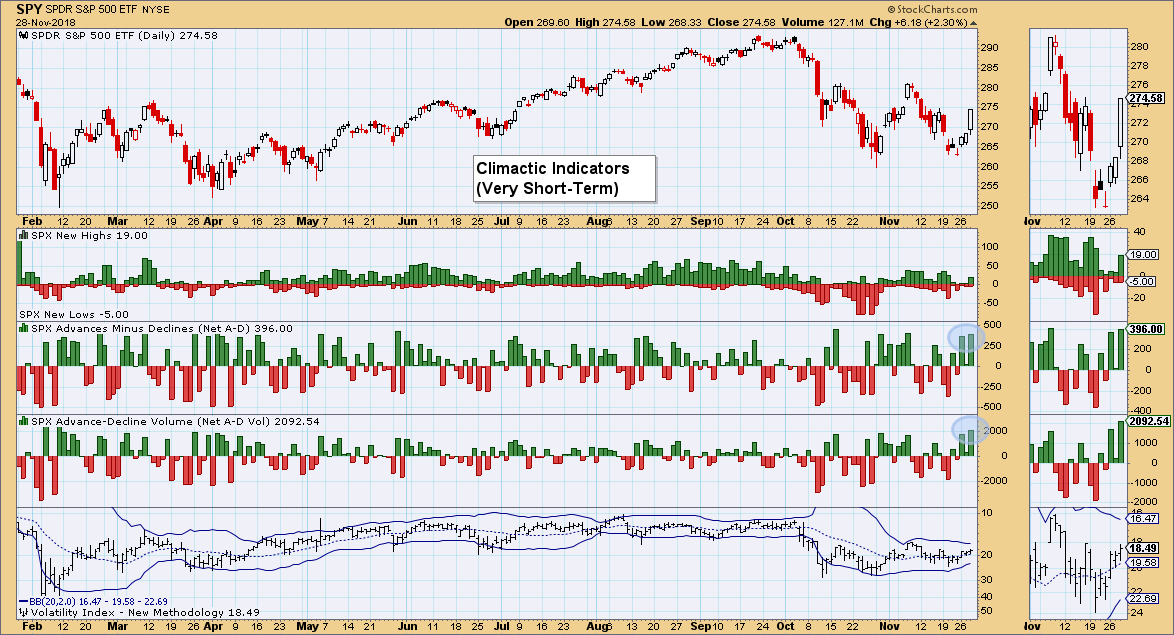
Climactic Market Indicators: These readings on Net A-D have the earmarks of a buying exhaustion. The VIX hasn't quite reached the top of the upper Bollinger Band, so we could eke out another day or so of rally.
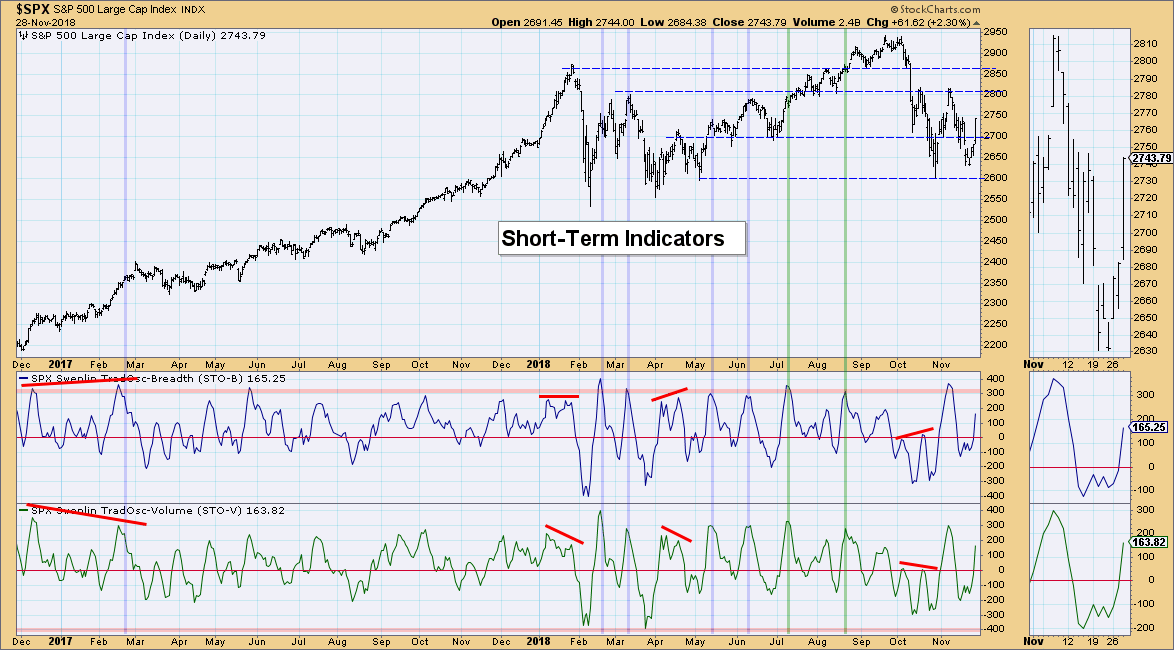
Short-Term Market Indicators: These indicators suggest the rally will continue. However, note that they are already soaring close to overbought levels.
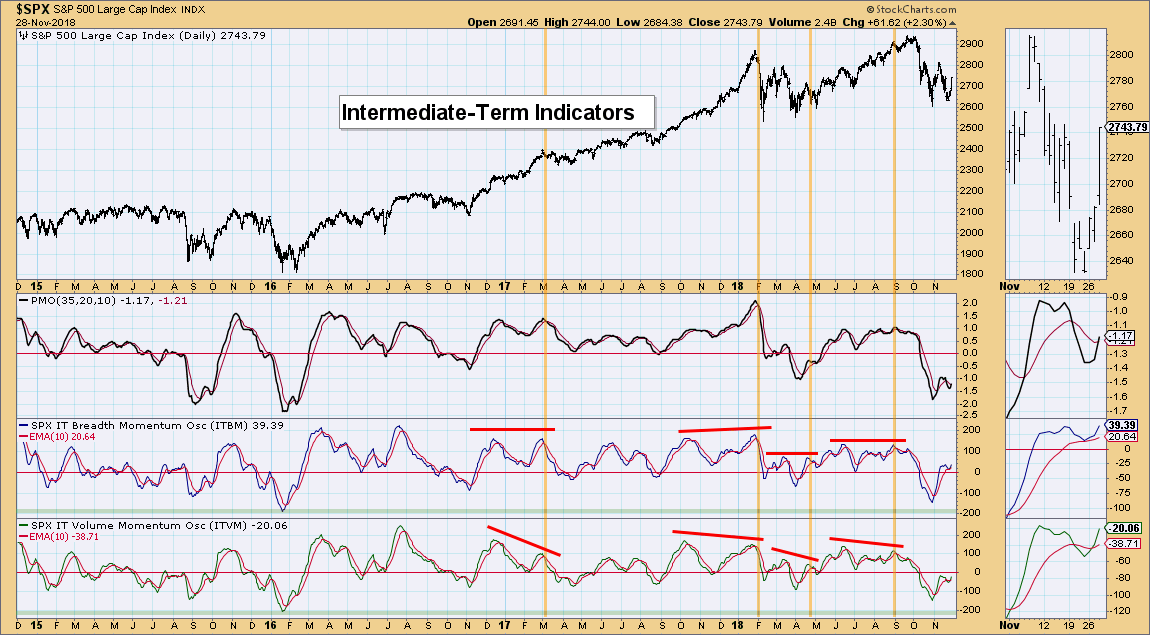
Intermediate-Term Market Indicators: These look encouraging. Both ITBM and ITVM are rising. The ITVM whipsawed back above its signal line, but I would like to see it hit positive territory before it decelerates again.
Conclusion: If you watched MWL today, you probably noticed that Marc Chaikin was bullish, even before the relief rally hit during the show. He believes this is a correction and double-bottom out. The only thing preventing me from being a bear outright is the 50-EMA staying above the 200-EMA. I thought for sure we would see a negative crossover this time around to confirm a bear market, but it looks like the "crash prevention team" stepped in just in time to nix a Long-Term Trend Model SELL signal of a negative 50/200-EMA crossover.
DOLLAR (UUP)
IT Trend Model: BUY as of 4/24/2018
LT Trend Model: BUY as of 5/25/2018
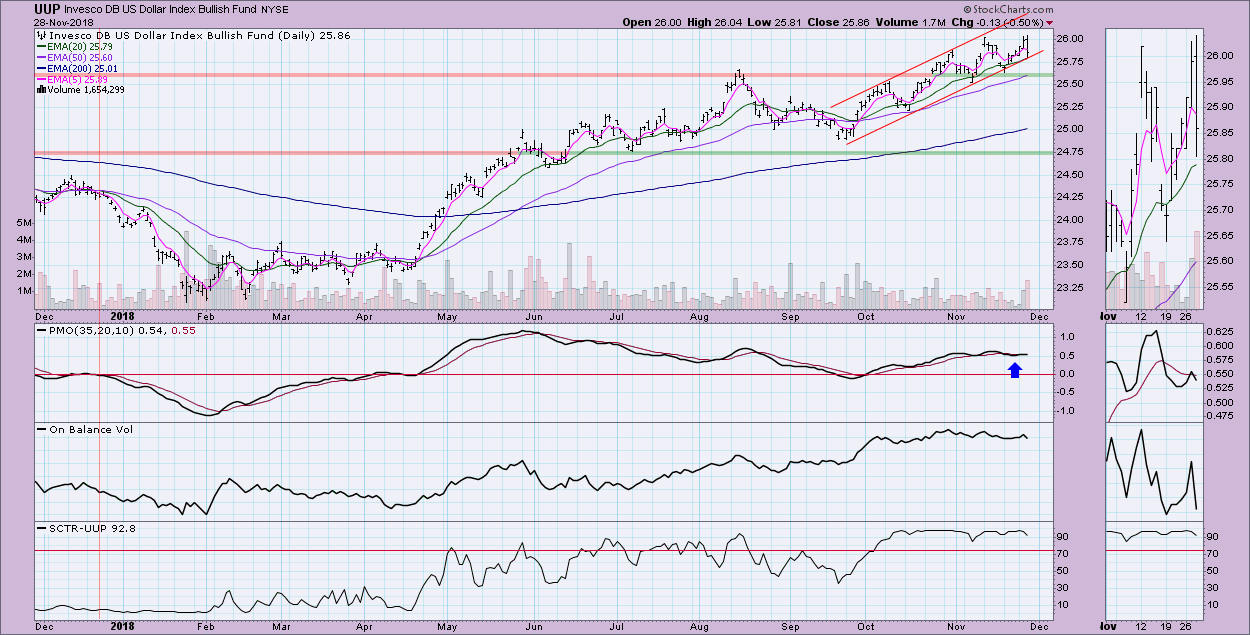
UUP Daily Chart: After writing a bullish article on the Dollar yesterday, it was not a surprise to see it tank today. I'm not overly worried. The rising trend channel remains intact. Granted, we did get a whipsaw PMO SELL signal, but a nice rally tomorrow would be enough to make it disappear.
GOLD
IT Trend Model: BUY as of 10/19/2018
LT Trend Model: SELL as of 6/22/2018
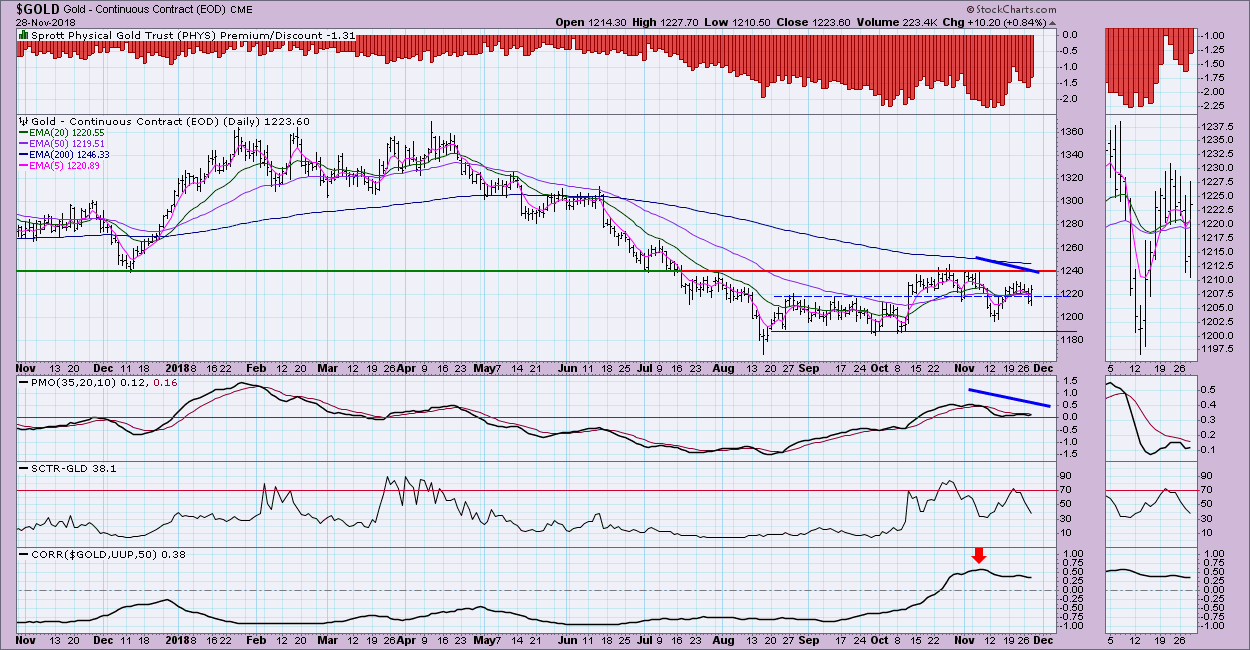
GOLD Daily Chart: Gold enjoyed a nice rally on the back of the weak Dollar. We still didn't see any exciting breakouts, even from the declining trend. Notice the bearish confirmation of PMO tops and price tops moving lower. Discount rates have pulled way back, implying less bearishness from buyers. Sentiment being contrarian, we want participants to be very bearish.
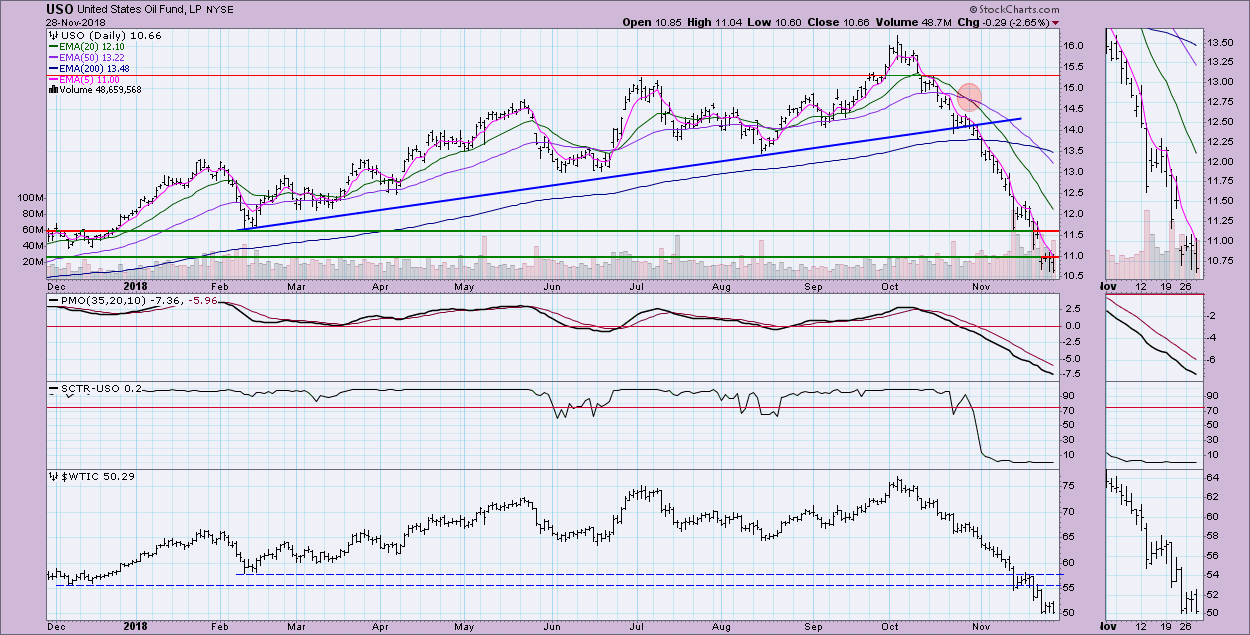
CRUDE OIL (USO)
IT Trend Model: Neutral as of 10/29/2018
LT Trend Model: SELL as of 11/23/2018
USO Daily Chart: Nothing good to report. Given the flat line SCTR and the steadily declining PMO, I don't see oil prices rising anytime soon.
BONDS (TLT)
IT Trend Model: Neutral as of 9/13/2018
LT Trend Model: SELL as of 9/18/2018
TLT Daily Chart: After hitting resistance at the September lows, price turned down and broke below the October tops. The PMO is decelerating below the zero line and the SCTR and OBV are declining. I'm looking for price to move down and test the $112 level.

Technical Analysis is a windsock, not a crystal ball.
Happy Charting!
- Erin
**Don't miss any of the DecisionPoint commentaries! Go to the "Notify Me" box toward the end of this blog page to be notified as soon as they are published.**
NOTE: The signal status reported herein is based upon mechanical trading model signals, specifically, the DecisionPoint Trend Model. They define the implied bias of the price index based upon moving average relationships, but they do not necessarily call for a specific action. They are information flags that should prompt chart review. Further, they do not call for continuous buying or selling during the life of the signal. For example, a BUY signal will probably (but not necessarily) return the best results if action is taken soon after the signal is generated. Additional opportunities for buying may be found as price zigzags higher, but the trader must look for optimum entry points. Conversely, exit points to preserve gains (or minimize losses) may be evident before the model mechanically closes the signal.
Helpful DecisionPoint Links:
DecisionPoint Shared ChartList and DecisionPoint Chart Gallery
Price Momentum Oscillator (PMO)
Swenlin Trading Oscillators (STO-B and STO-V)
