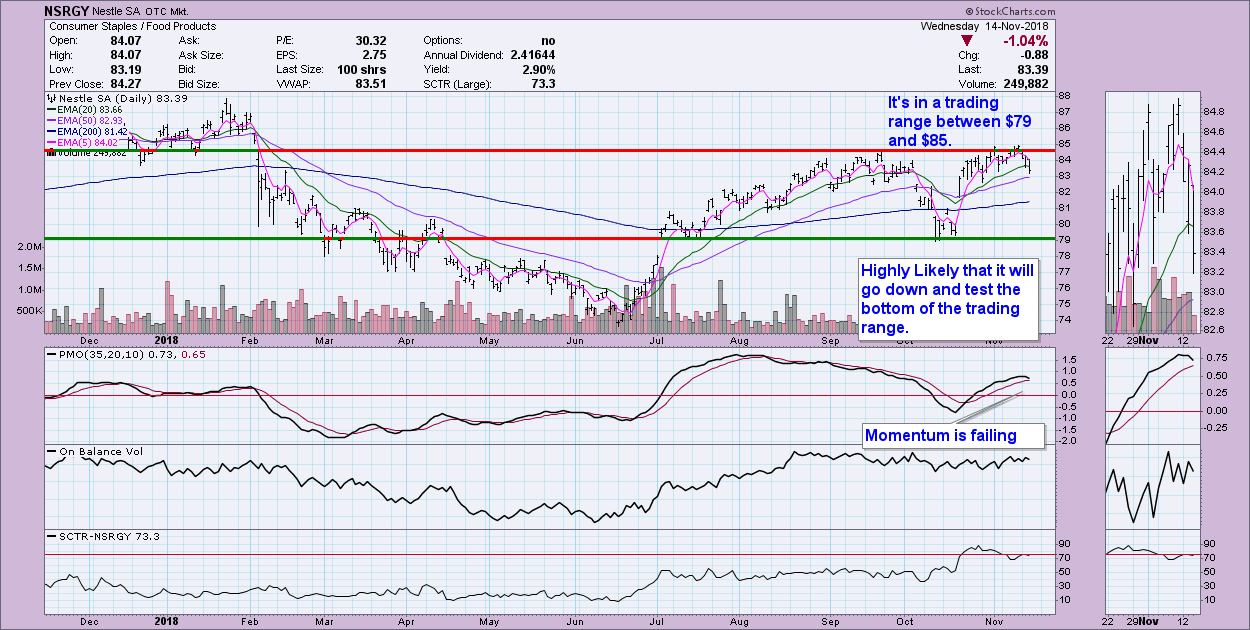
 Before I get into the nitty gritty here, I want to relate a story of what literally (yes, literally) just happened to me about 10 minutes ago. I got a text from my 10-year old nephew, "Is there anyway I can check what is happening to the Nestle stock in the future?" Mind you, this has never happened, even remotely. Let's just say that my Dad and I are the only family members who talk about the market. My brother said that he was likely interested because he found out that Nestle owns a lot of other companies and brands (and he likes chocolate). So, being the good Aunt that I am, I sent him an annotated chart of Nestle. You'll find it at the bottom of this article if you're interested.
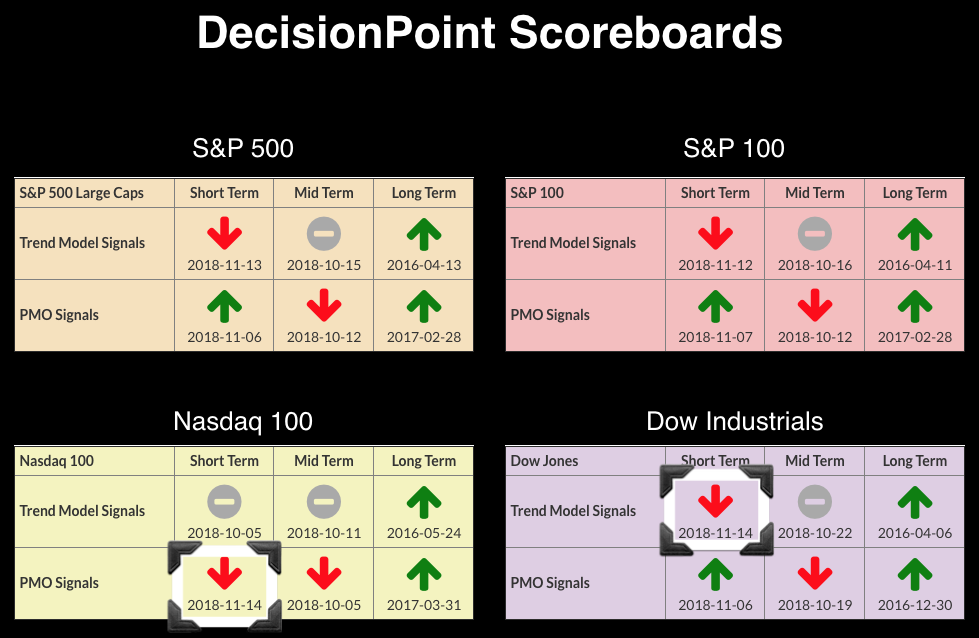
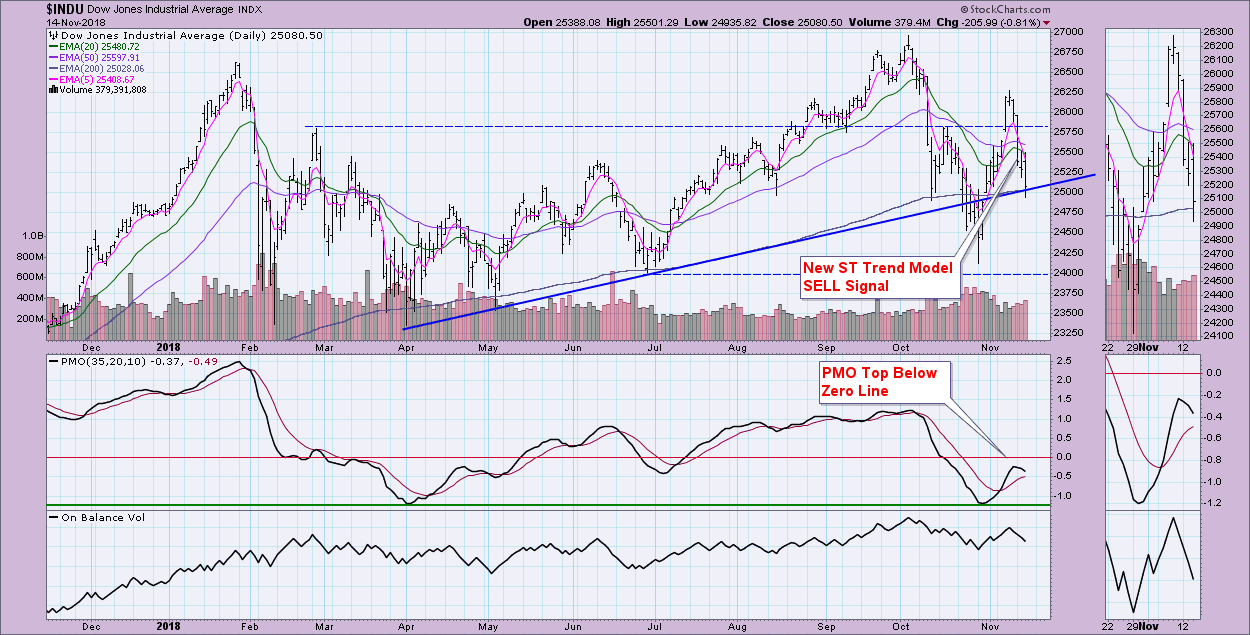
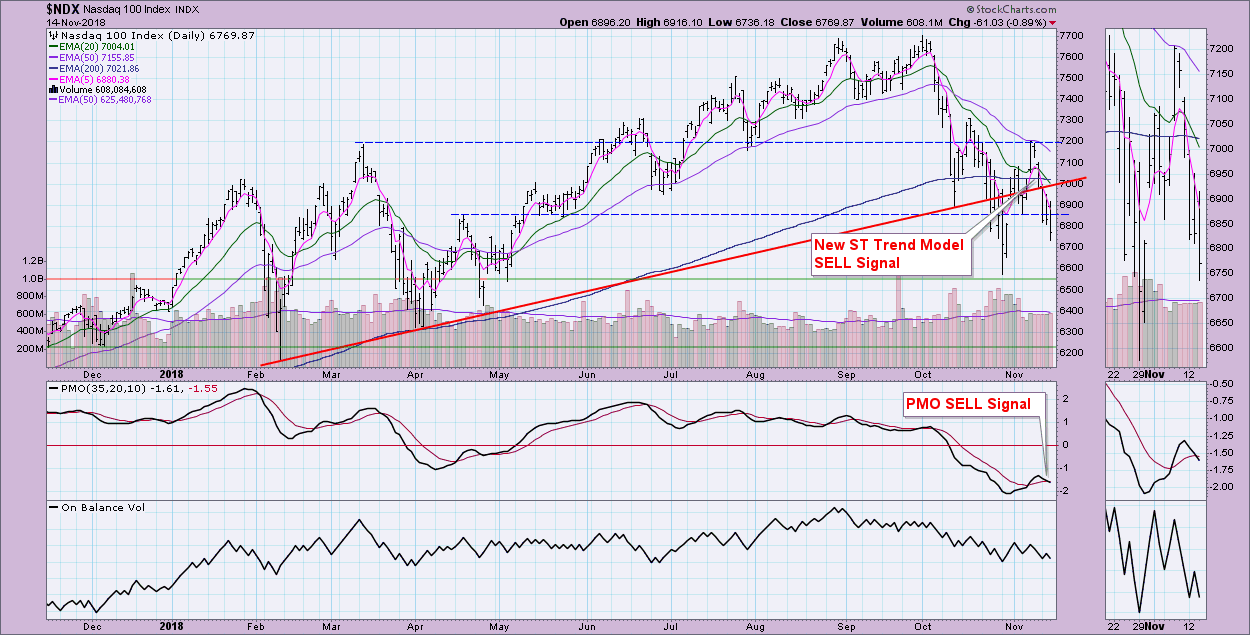
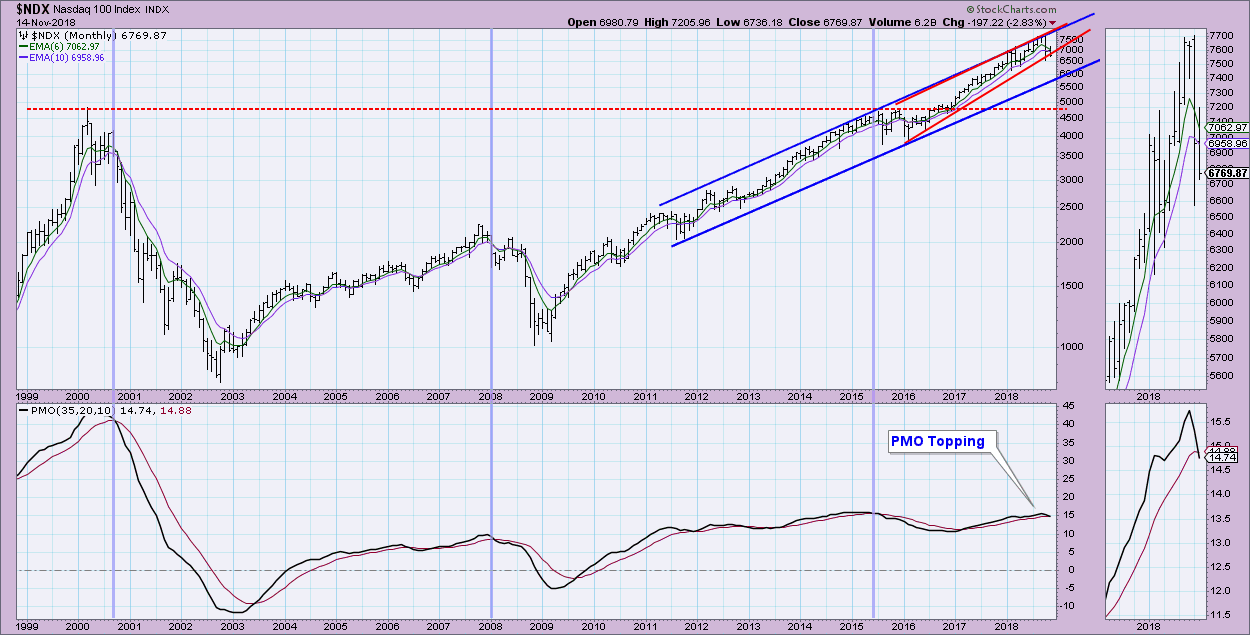
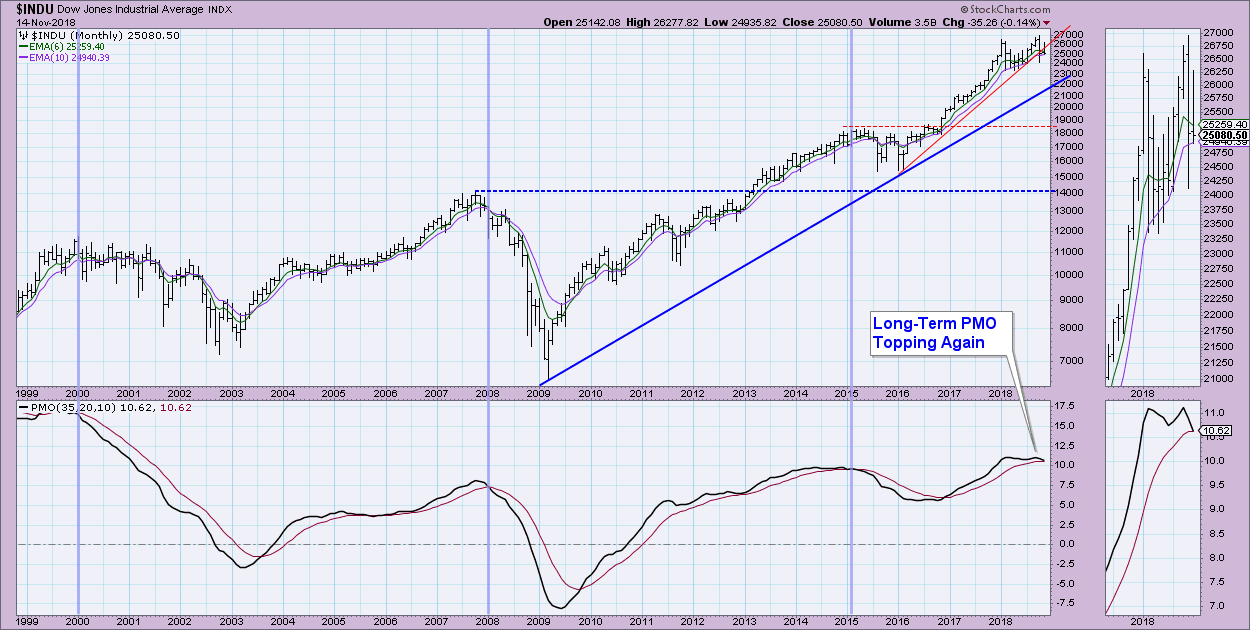
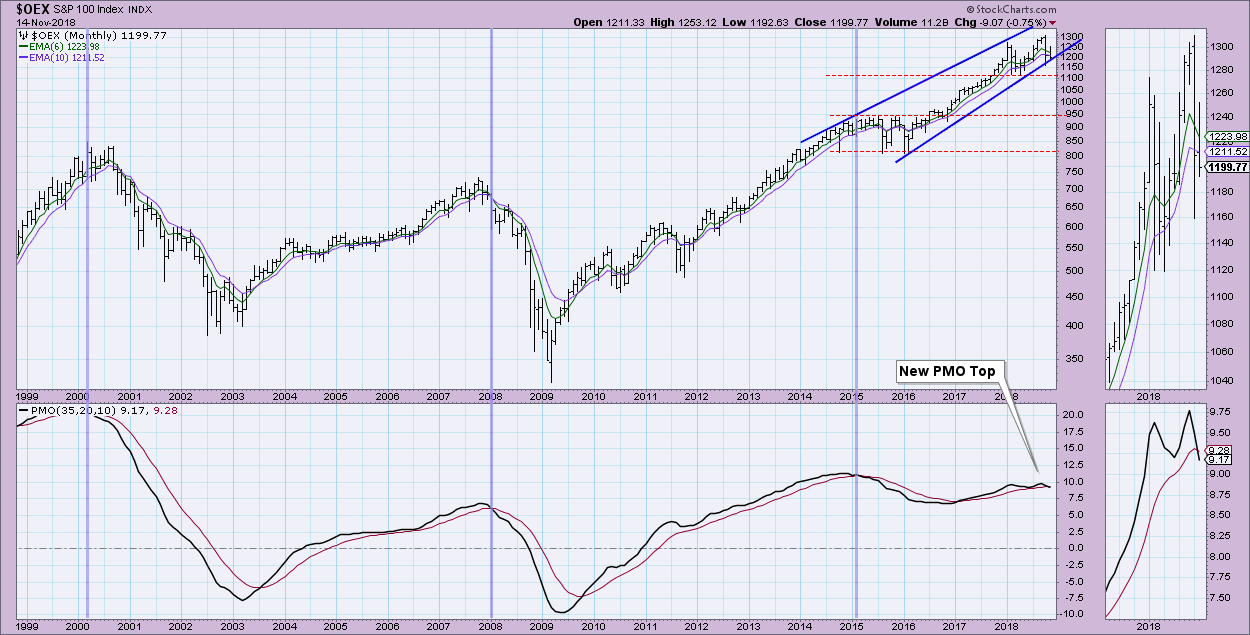
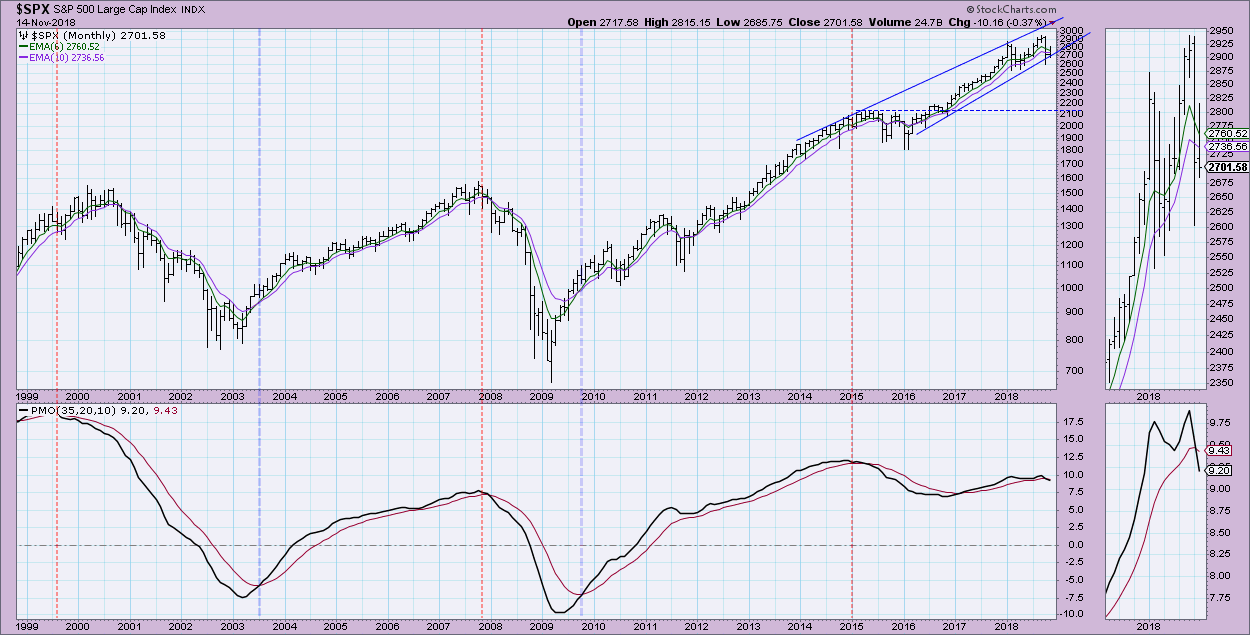
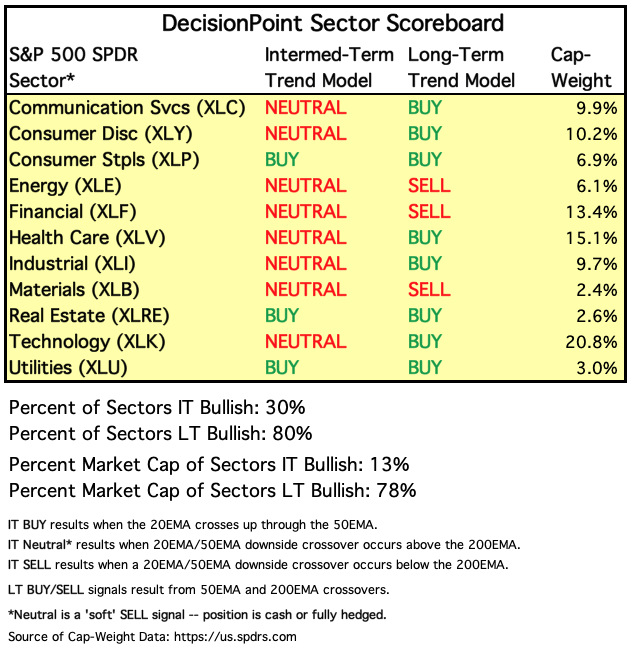
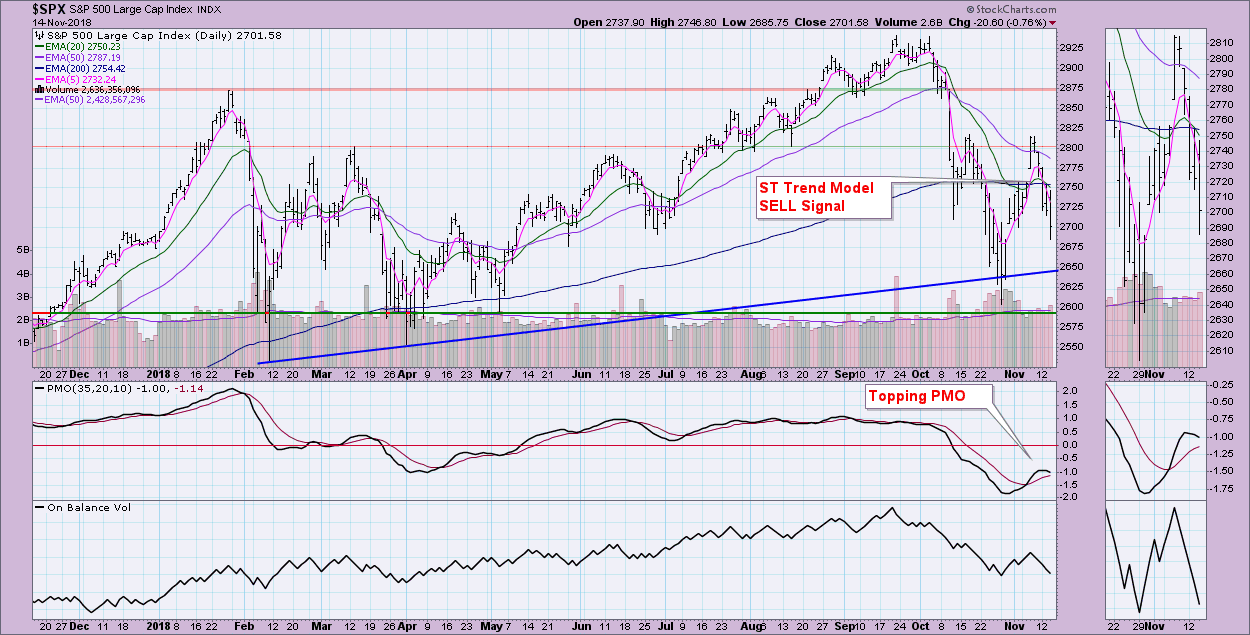
Okay, let's talk indexes! The DP Scoreboards have now added two more bearish signal changes. I've included the annotated charts below the Scoreboard. Additionally, note on the monthly charts that PMO SELL signals are in place right now, but won't go "final" until the end of the month. The last time we had Scoreboards that were all red or bearish signals was last May. The good news is that when they were that bearish in May, the result was a market bottom and the resumption of the bull market.
The DecisionPoint Alert presents an mid-week assessment of the trend and condition of the stock market (S&P 500), the U.S. Dollar, Gold, Crude Oil, and Bonds.
SECTORS
Each S&P 500 Index component stock is assigned to one, and only one, of 11 major sectors. This is a snapshot of the Intermediate-Term and Long-Term Trend Model signal status for those sectors.
STOCKS
IT Trend Model: Neutral as of 10/15/2018
LT Trend Model: BUY as of 4/1/2016
SPY Daily Chart: The daily chart actually looks okay. Rising bottoms trendline could be a stopping point, but it is more likely we will see the 2600 level tested. The PMO is topping below the zero line which is especially bearish. Today's trading took out the mid-October low with no problem. I say it looks "okay" in that it hasn't seen the rising bottoms trendline compromised yet.
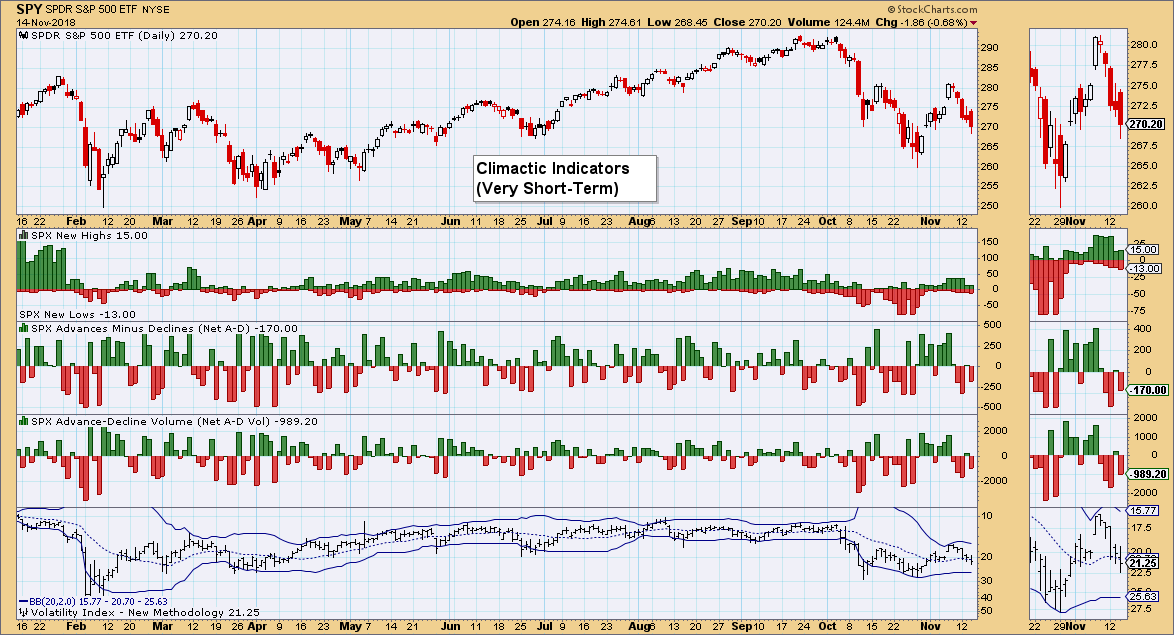
Climactic Market Indicators: Not much to see on our very short-term indicator chart. Breadth yesterday was actually a tiny bit positive and while it was down today, it didn't spike very low. The VIX is in the middle of the Bollinger Bands so short-term sentiment can be read as neutral. When VIX readings get high enough to puncture the band on the downside, then we will look for higher prices in the near term.
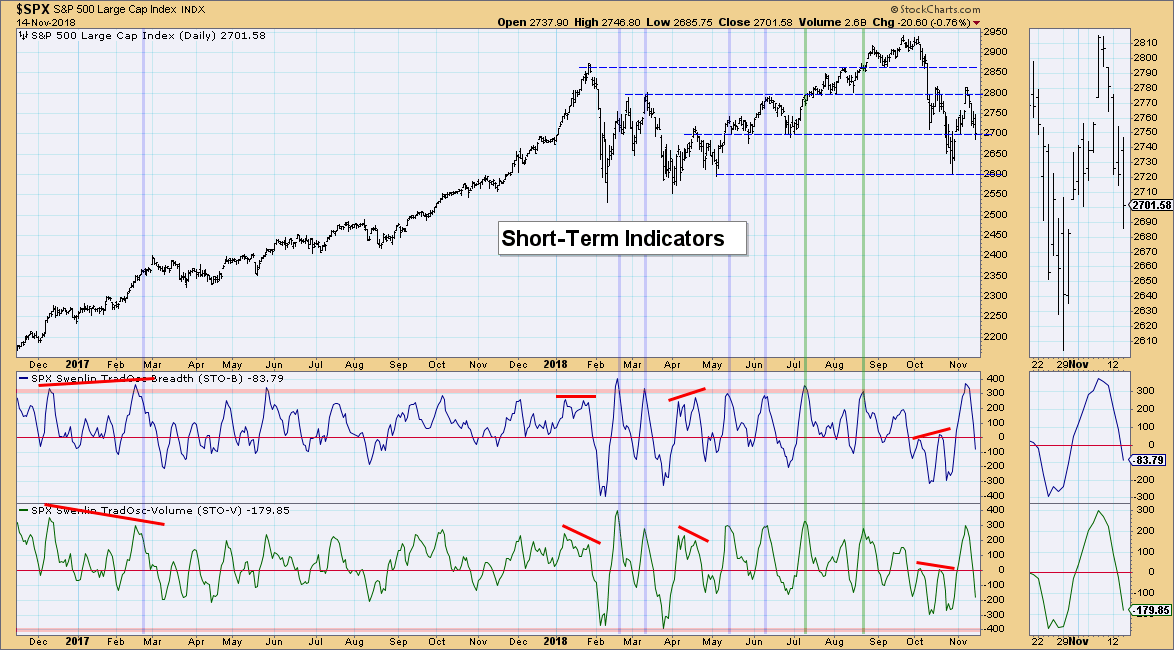
Short-Term Market Indicators: These indicators are falling fast toward oversold territory, but they aren't there yet. They can accommodate more downside with little problem.
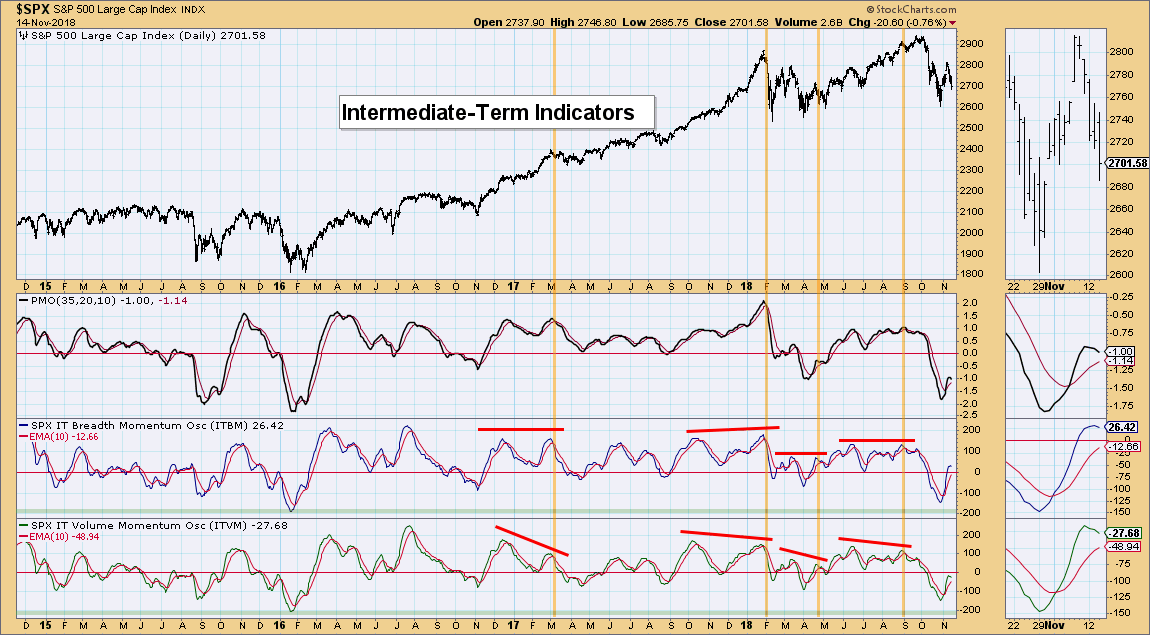
Intermediate-Term Market Indicators: These indicators have me concerned. The volume indicator has topped below the zero line which suggests to me more bearish activity to come. We don't need to panic, they haven't had negative crossovers yet.
Conclusion: The DecisionPoint Sector Scoreboard shows on defensive sectors on Intermediate-Term Trend Model BUY signals. Strength needs to start building elsewhere or this very well could be a bear market brewing. John Murphy wrote today that he sees the market testing the October lows soon. I am in total agreement. The indicators certainly support more downside. Monthly SELL signals are very concerning. Unless the market can turn it around in the next two and half weeks, those monthly PMO SELL signals will be logged.
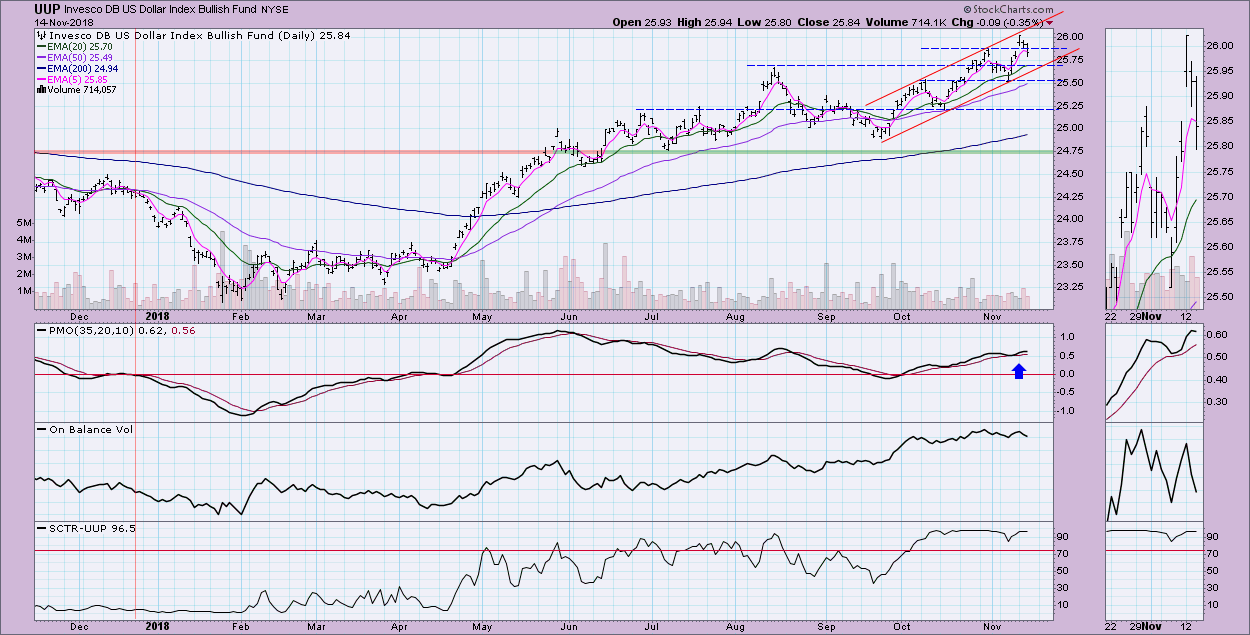
DOLLAR (UUP)
IT Trend Model: BUY as of 4/24/2018
LT Trend Model: BUY as of 5/25/2018
UUP Daily Chart: The Dollar has been pulling back the past few days but it is likely only moving down to the bottom of the rising trend channel. Support will be there simultaneously at the August top. I suspect we will see a bit of weakness followed by higher prices within the trend channel.
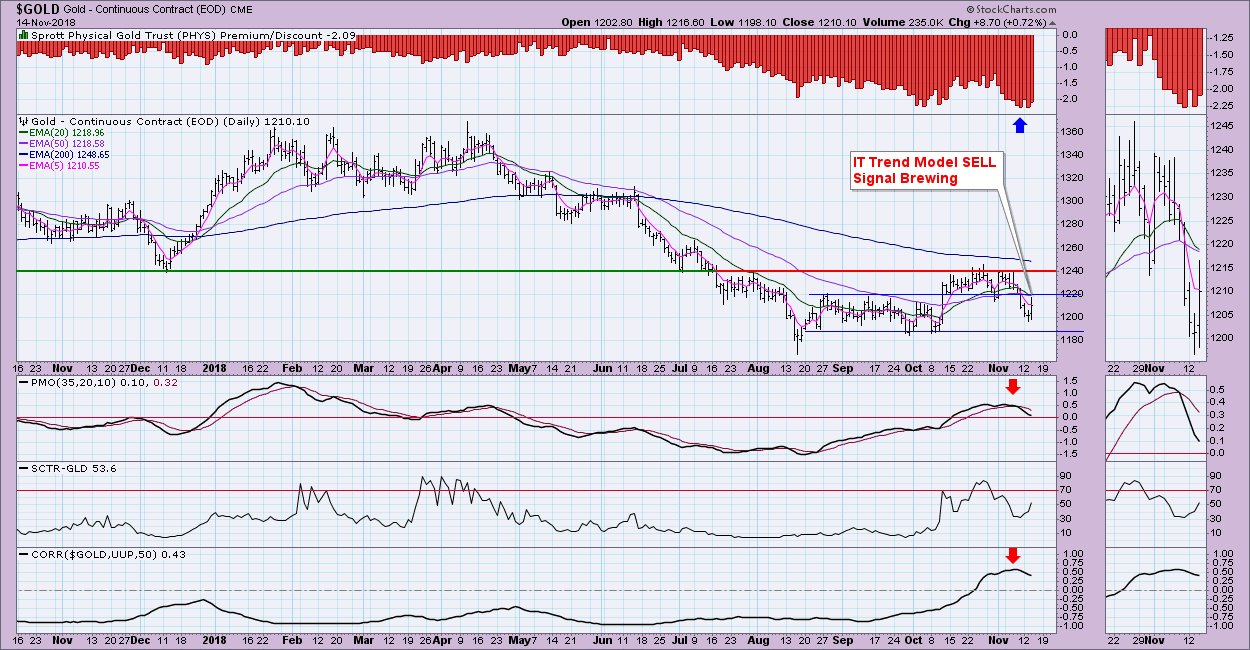
GOLD
IT Trend Model: BUY as of 10/19/2018
LT Trend Model: SELL as of 6/22/2018
GOLD Daily Chart: Gold is losing its edge on the Dollar as it begins to decouple again and resume its reverse correlation. I've been bullish on the Dollar and due to the positive correlation that recently occurred, I felt that Gold could rise with the Dollar. It did, but not spectacularly. The sentiment was (is) extraordinarily bearish (which is bullish for Gold) and it had broken out of the trading channel in October. Everything was lined up for Gold to do well...and it didn't. Best case right now is a test of 1240, but given the PMO SELL signal, I doubt it will get past it. Today's move was encouraging, but I suspect it is another fake out.
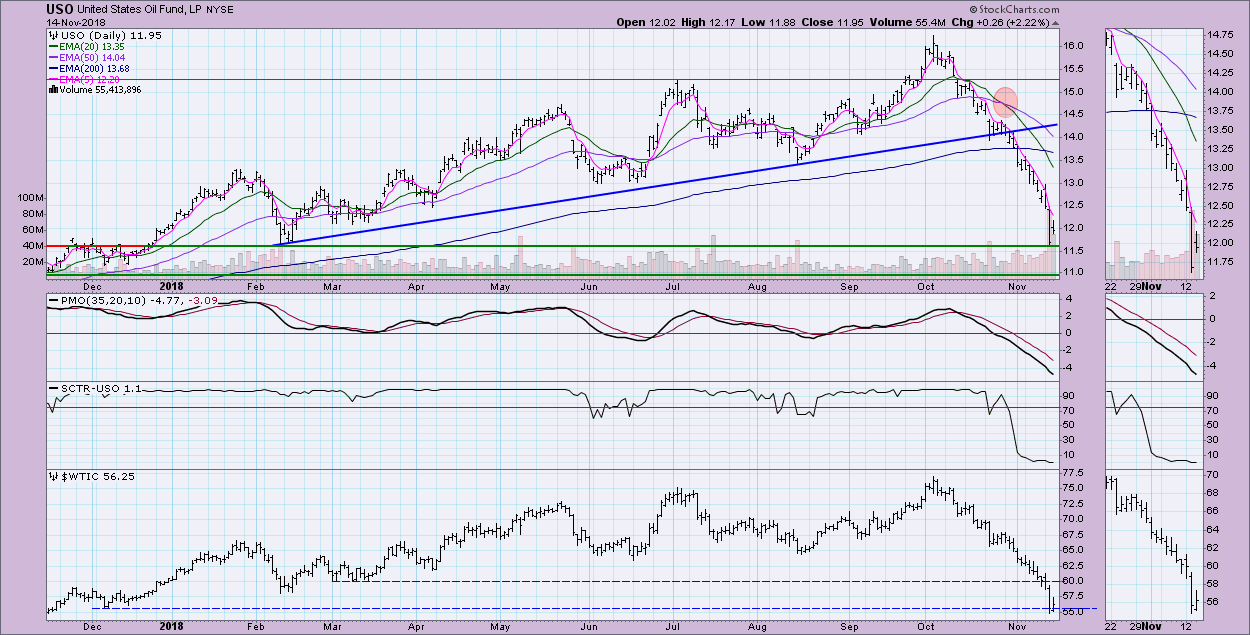
CRUDE OIL (USO)
IT Trend Model: Neutral as of 10/29/2018
LT Trend Model: BUY as of 11/2/2017
USO Daily Chart: Oil has been in a tailspin since the beginning of October and it doesn't look like it is quite out of the woods yet. I thought it was positive that it appears to be bouncing off support at the February low today, but we need to see the PMO at least slow down its descent.
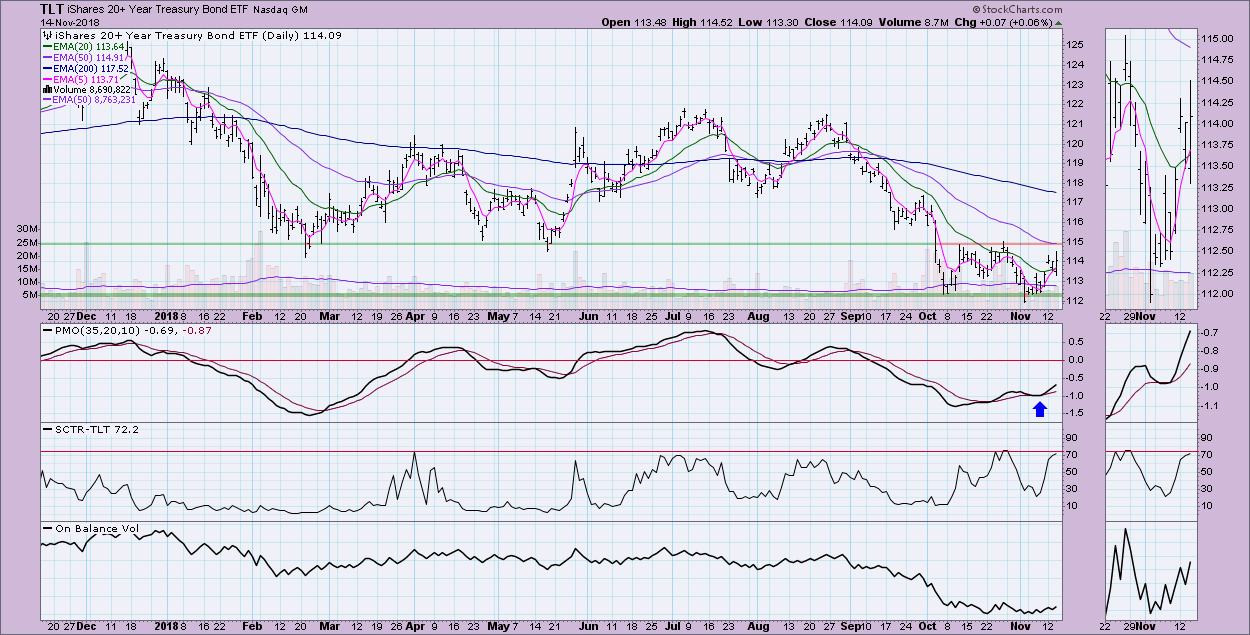
BONDS (TLT)
IT Trend Model: Neutral as of 9/13/2018
LT Trend Model: SELL as of 9/18/2018
TLT Daily Chart: We're about ready to see if Bonds will continue consolidating or will it use market weakness to breakout. The PMO looks promising and today we saw a Short-Term Trend Model BUY signal come in when the 5-EMA crossed above the 20-EMA. The SCTR is improving. This is a great opportunity for Bonds to make a real turnaround with a breakout above strong resistance at $115. Indicators are lined up to support this.
By my nephew's request, here is my analysis of Nestle:
Technical Analysis is a windsock, not a crystal ball.
Happy Charting!
- Erin
**Don't miss any of the DecisionPoint commentaries! Go to the "Notify Me" box toward the end of this blog page to be notified as soon as they are published.**
NOTE: The signal status reported herein is based upon mechanical trading model signals, specifically, the DecisionPoint Trend Model. They define the implied bias of the price index based upon moving average relationships, but they do not necessarily call for a specific action. They are information flags that should prompt chart review. Further, they do not call for continuous buying or selling during the life of the signal. For example, a BUY signal will probably (but not necessarily) return the best results if action is taken soon after the signal is generated. Additional opportunities for buying may be found as price zigzags higher, but the trader must look for optimum entry points. Conversely, exit points to preserve gains (or minimize losses) may be evident before the model mechanically closes the signal.
Helpful DecisionPoint Links:
DecisionPoint Shared ChartList and DecisionPoint Chart Gallery
Price Momentum Oscillator (PMO)
Swenlin Trading Oscillators (STO-B and STO-V)
