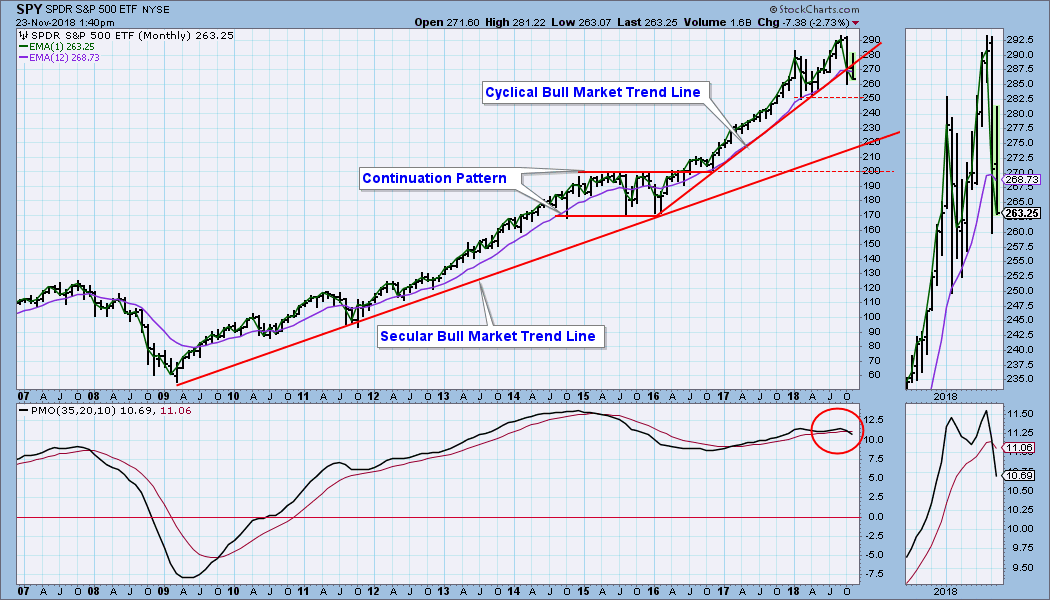
This monthly chart doesn't become final until the end of this month (next Friday), but there is strong evidence here that we are in a bear market. The cyclical bull market rising trend line has been decisively broken, and the monthly PMO is below the signal line and falling. This is not an infallible indication of a bear market, but it is a fairly reliable one. In the time frame shown on this chart we can see two prior instances where the monthly PMO was similarly configured -- the 2007-2009 bear market, and the one-year correction in 2015. A rally back above the trend line is possible, but for now, I will assume the worst.
The DecisionPoint Weekly Wrap presents an end-of-week assessment of the trend and condition of the stock market (S&P 500), the U.S. Dollar, Gold, Crude Oil, and Bonds.
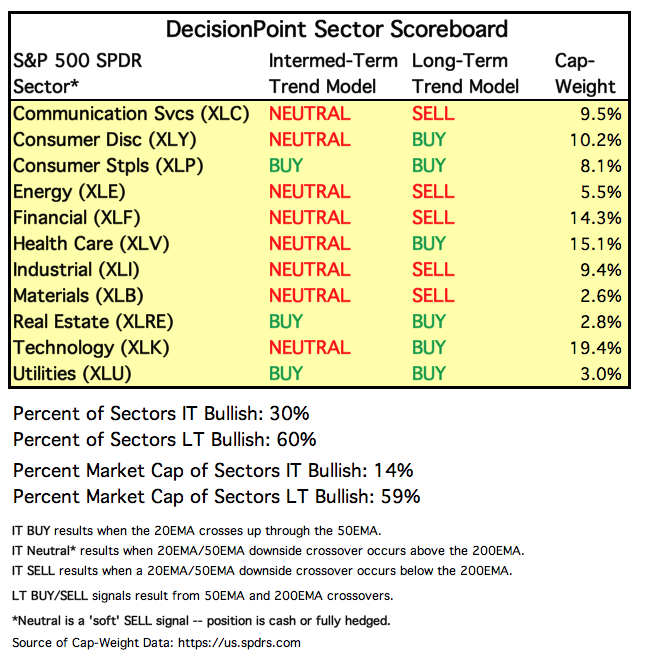
SECTORS
Each S&P 500 Index component stock is assigned to one, and only one, of 11 major sectors. This is a snapshot of the Intermediate-Term and Long-Term Trend Model signal status for those sectors.
STOCKS
IT Trend Model: NEUTRAL as of 10/15/2018
LT Trend Model: BUY as of 4/1/2016
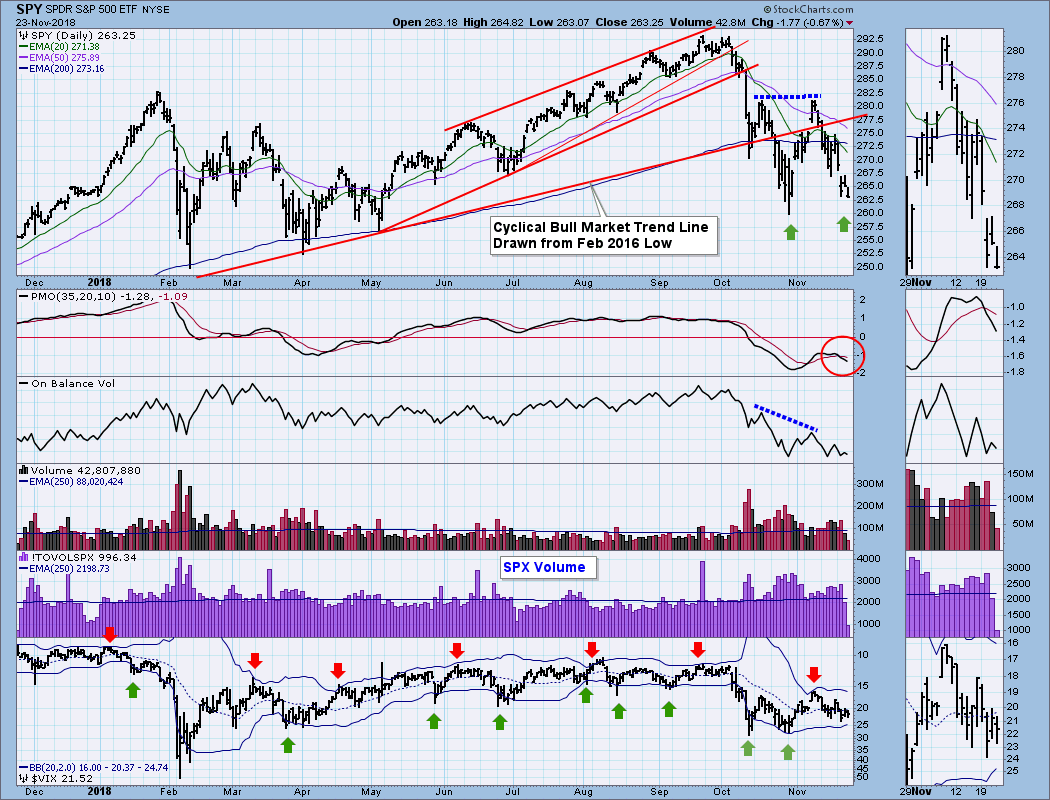
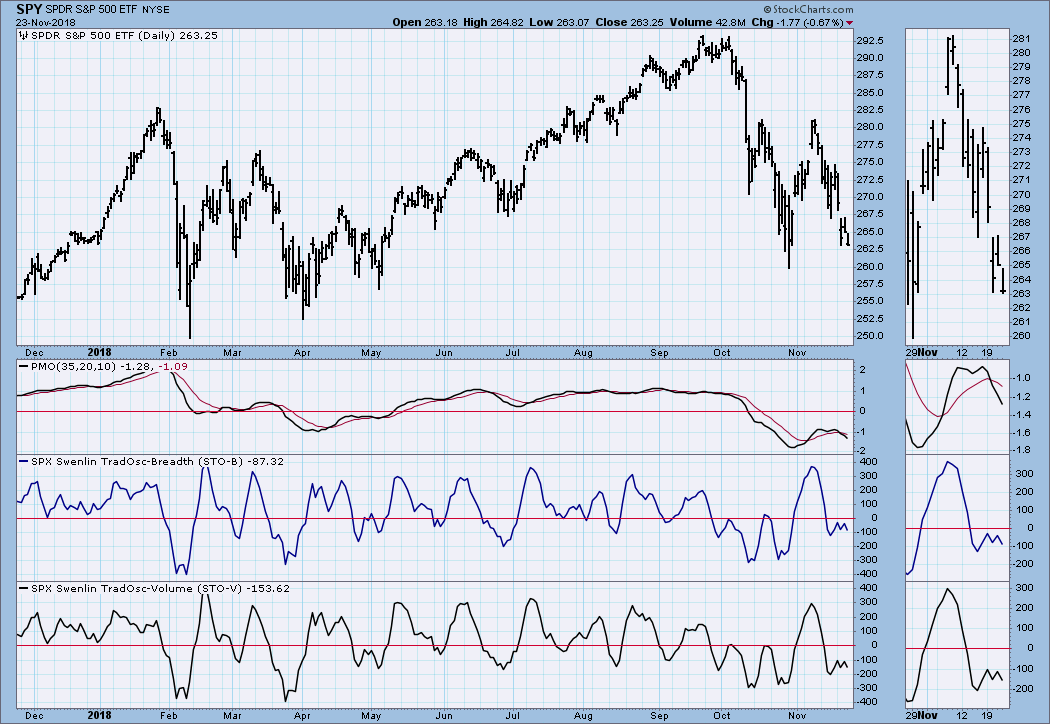
SPY Daily Chart: Last week we were looking at a potential reverse head and shoulders, but this week's decline wiped that out. Now we are looking at a potential double bottom, but price closed on its lows for the week, so that second bottom has yet to materialize. Note the OBV negative divergence (blue dotted lines) -- the lower OBV top undermines the higher price top.
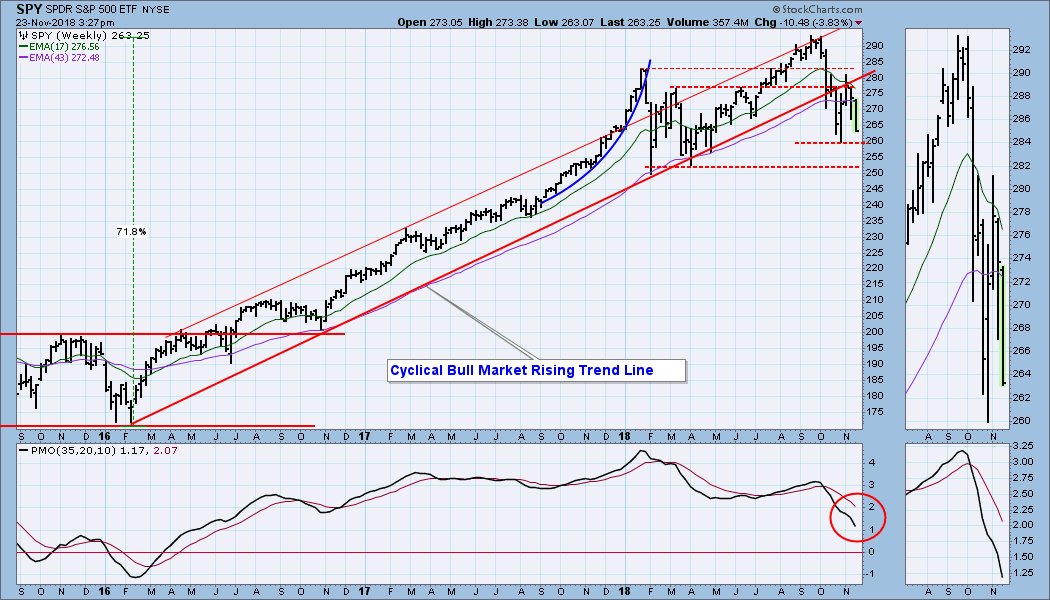
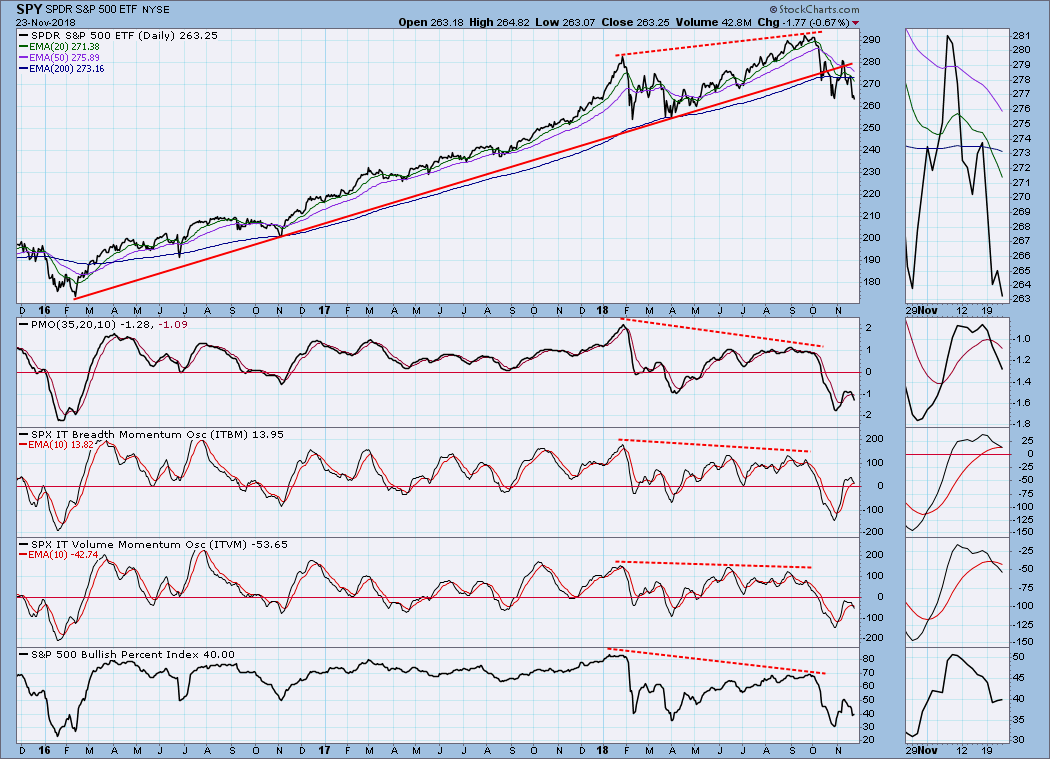
SPY Weekly Chart: This chart gives pretty good clarity regarding the rising trend line break and the support levels below. The weekly PMO is below the signal line and falling.
Short-Term Market Indicators: The STO-B and STO-V have topped below the zero line, which is negative.
Intermediate-Term Market Indicators: Of the ITBM, ITVM, and PMO the ITBM is the only one that is above the zero line and above its signal line. The picture is very negative.
CONCLUSION: If we assume that we are in a bear market, we must assume that bullish setups are less likely to have a positive resolution than they would in a bull market. It is more likely that they will break down. A perfect example is the reverse head and shoulders last week -- lots of promise, but it disintegrated. Now, maybe there is a double bottom, and then again maybe not. The point is that we need to adjust our bias in favor of our perception of the market trend, and don't make bets against the trend.
DOLLAR (UUP)
IT Trend Model: BUY as of 4/24/2018
LT Trend Model: BUY as of 5/25/2018
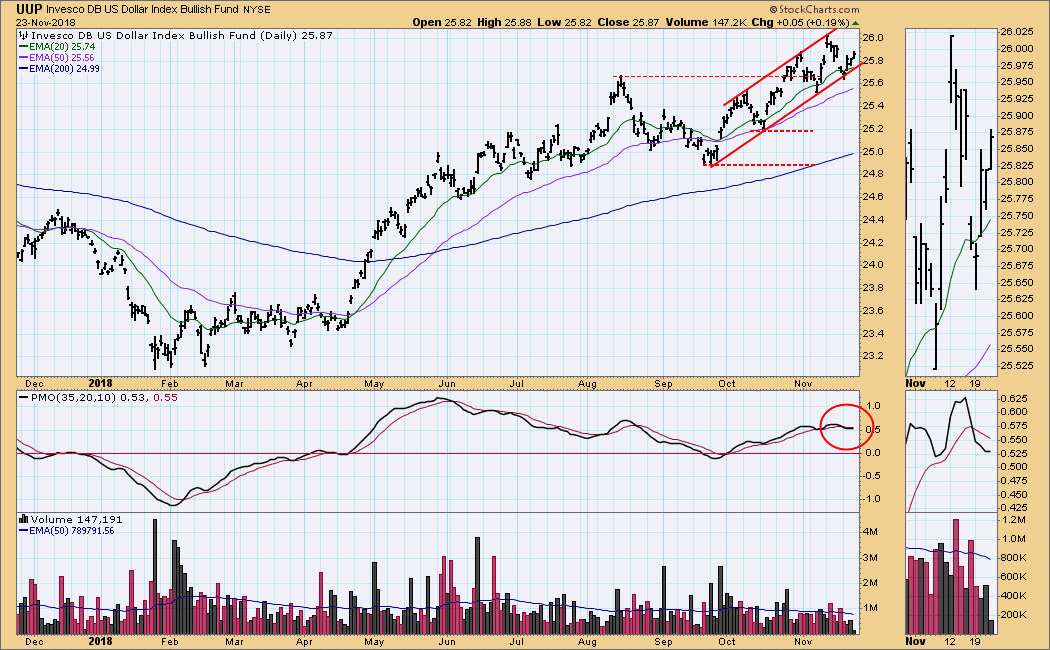
UUP Daily Chart: Price bounced off the bottom of the rising trend channel and is rising again. The daily PMO almost turned up on Friday.
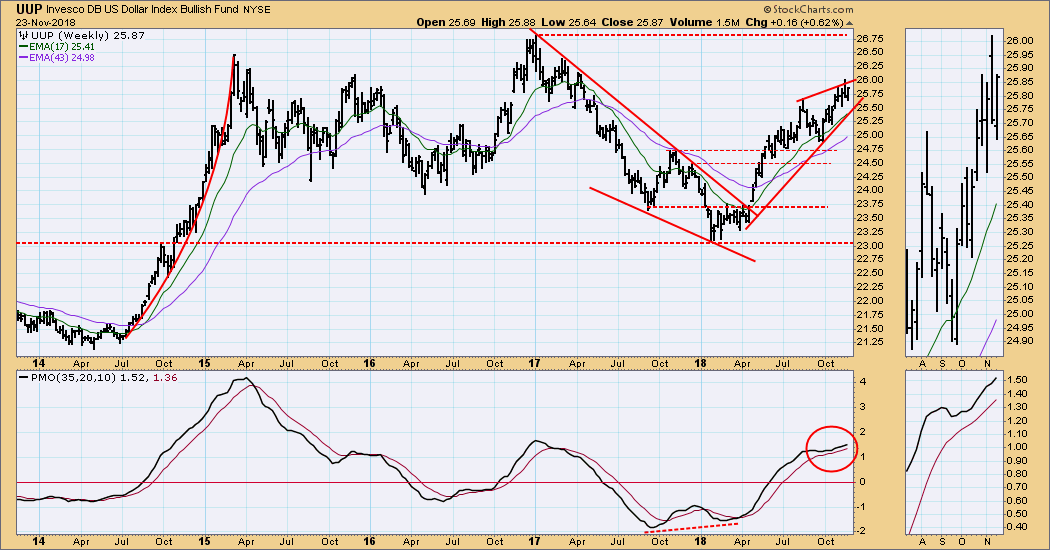
UUP Weekly Chart: The bearish rising wedge pattern dominates the chart, and the weekly PMO looks weak. My expectation is that the wedge will resolve downward.
GOLD
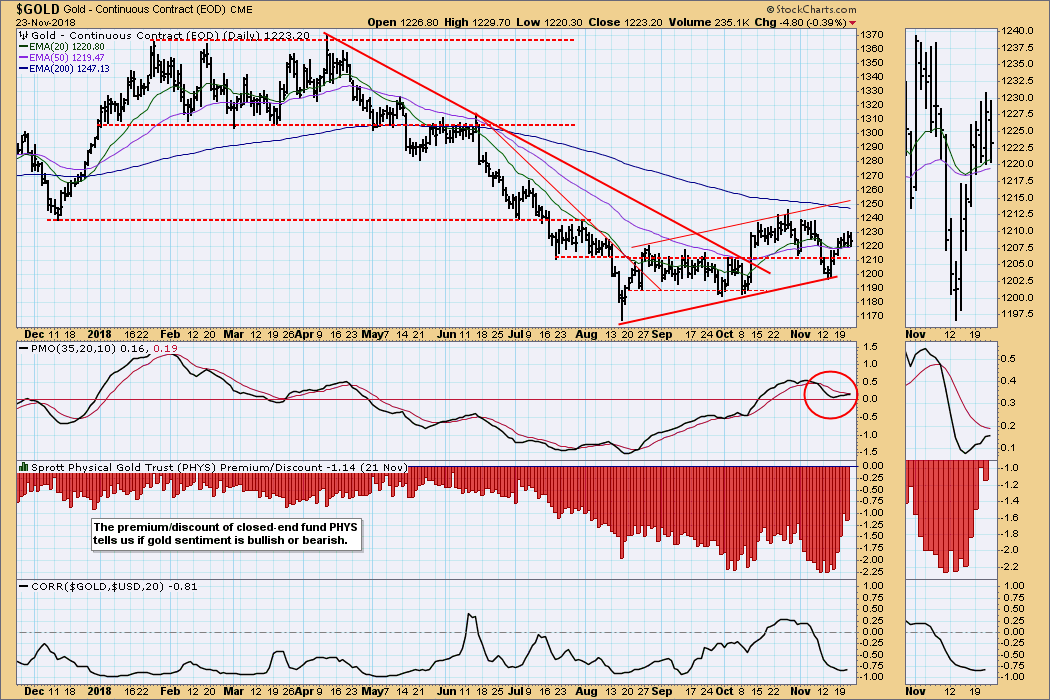
IT Trend Model: BUY as of 10/19/2018
LT Trend Model: SELL as of 6/22/2018
GOLD Daily Chart: Gold is still positive, but 'robust' is not a modifier one would use to describe the trend. It is in the middle of a rising trend channel, and the daily PMO is rising albeit barely. Sentiment is still bearish.
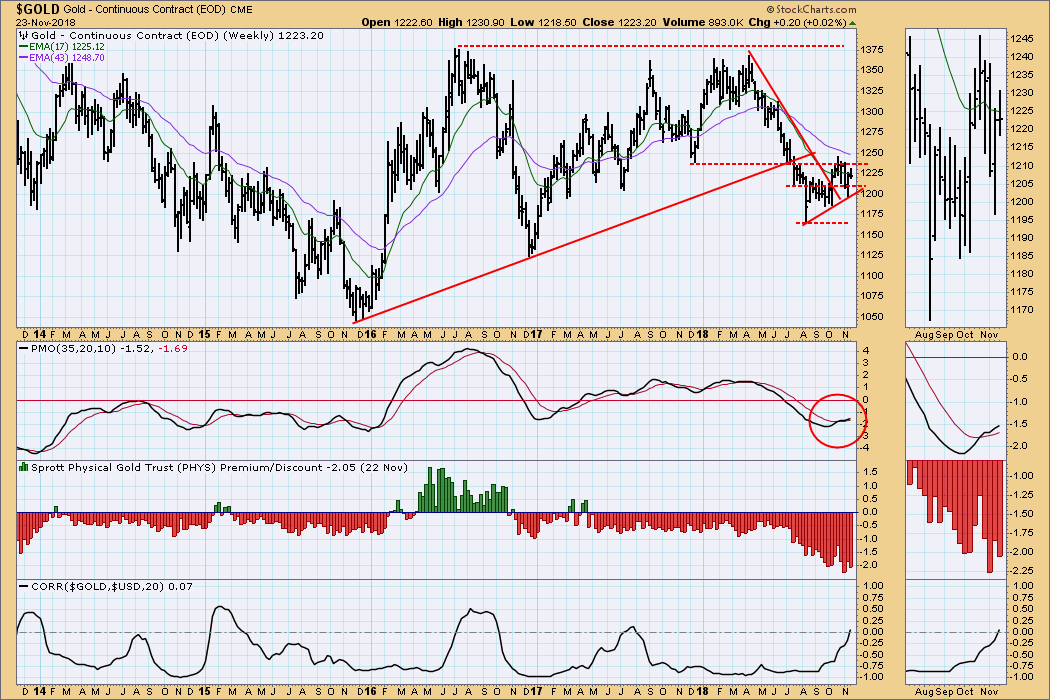
 GOLD Weekly Chart: Gold has decoupled from the dollar in this time frame, but the trend of the correlation indicator is rising steeply, which implies that gold and the dollar will be moving together before long.
CRUDE OIL (USO)
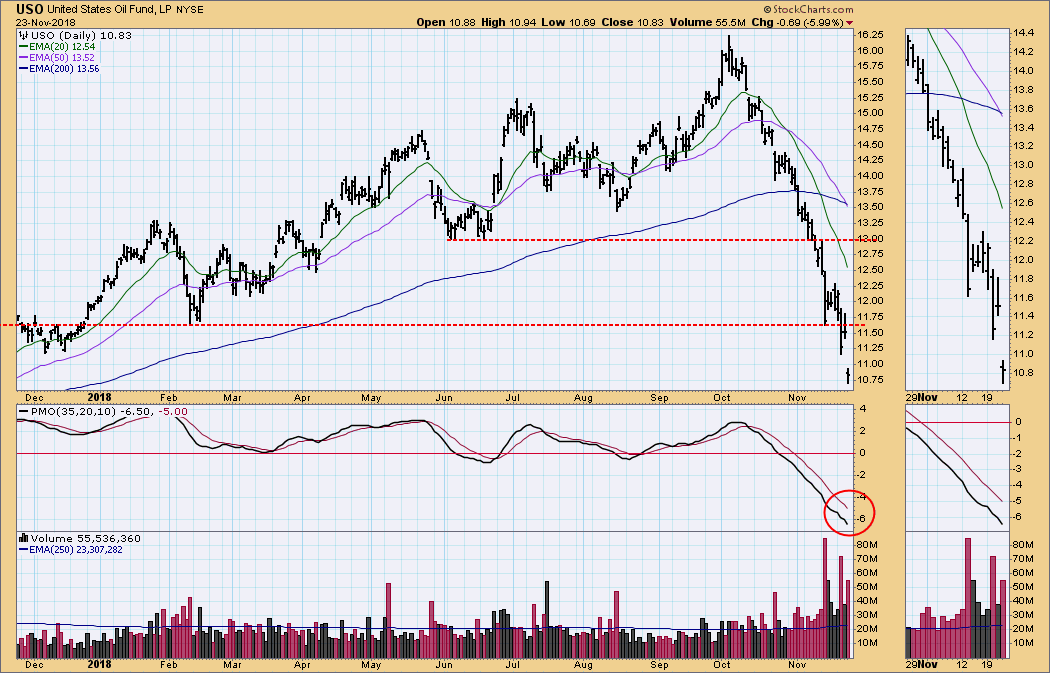
IT Trend Model: NEUTRAL as of 10/29/2018
LT Trend Model: SELL as of 11/23/2018
USO Daily Chart: From the October top to Friday's low USO has declined -34%, and on Friday the 50EMA crossed down through the 200EMA causing the LT Trend Model for USO to change from BUY to SELL. The fundamental reason behind this precipitous decline is not clear to me, but this is why we use technical analysis. We don't need to know the reason why as long as we read and respond to the technicals correctly. There will eventually be a bounce, but I don't see hide nor hair of it yet. The first clue would be for the daily PMO to turn up.
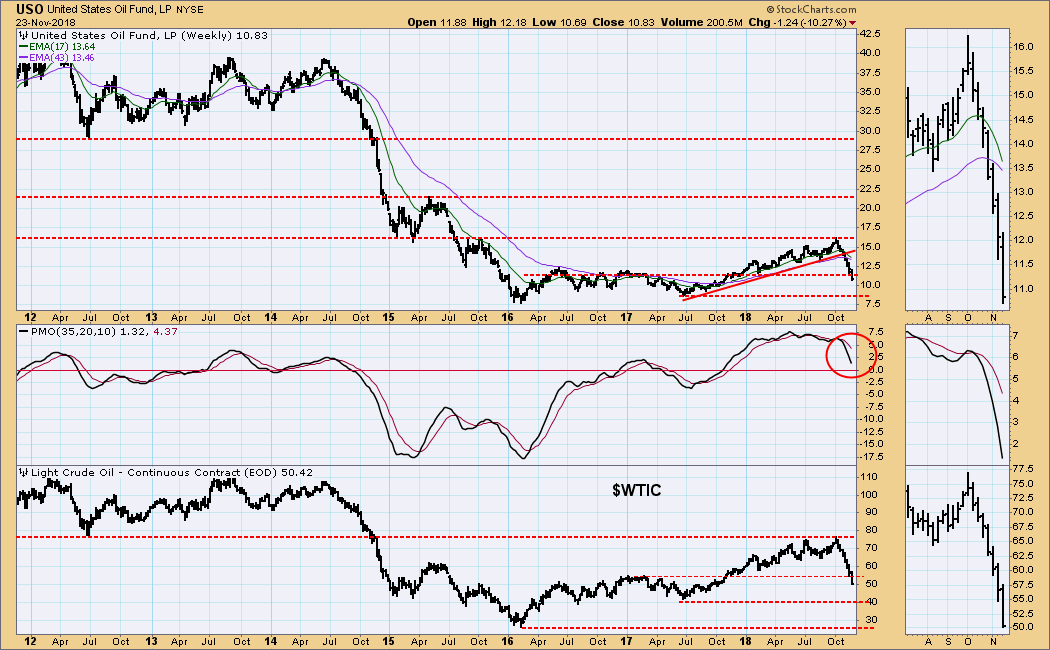
USO Weekly Chart: Any hope of support for crude at $55 is gone, and the next most obvious support is at $40. Beyond that is the line drawn across the $WTIC 2016 low.
BONDS (TLT)
IT Trend Model: NEUTRAL as of 9/13/2018
LT Trend Model: SELL as of 9/18/2018
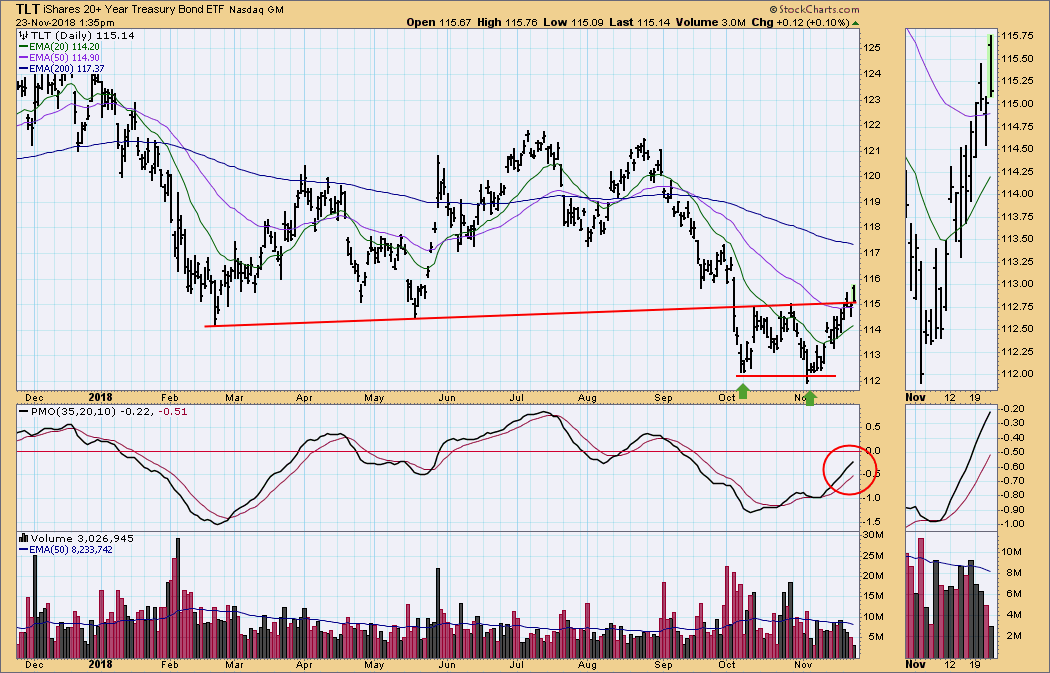
TLT Daily Chart: My expectations have been for bond prices to continue lower based upon the rising interest rate environment; however, prices are starting to behave contrary to my expectations. USO has formed a double bottom, and there has been an upside breakout above the confirmation line. There is a good chance that this is just a reaction rally within an overall down trend, but we can't take anything for granted.
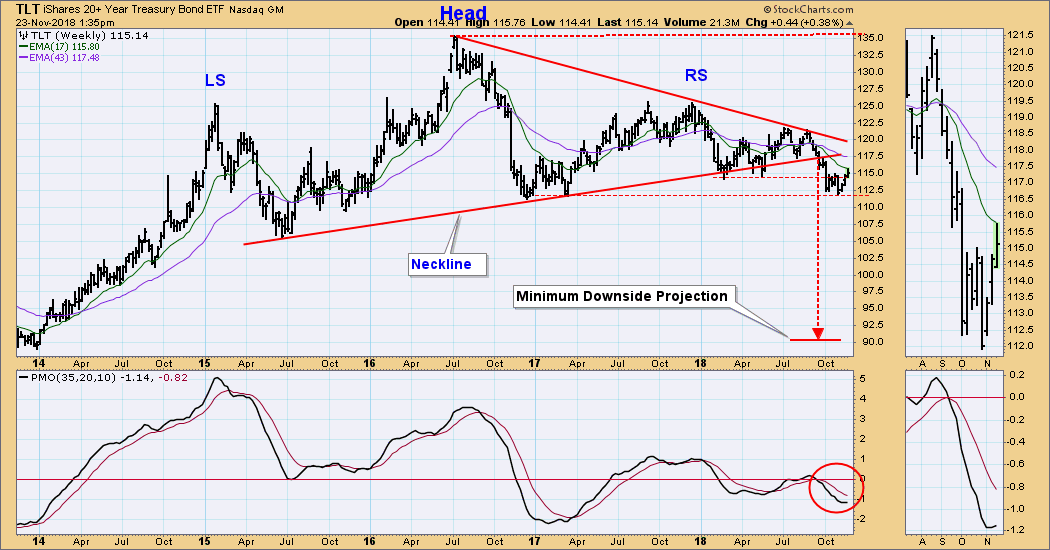
TLT Weekly Chart: What started as a bearish reverse flag formation at the beginning of this quarter, has resolved to the upside. This bullish resolution may not signal a major change in trend, but the weekly PMO has turned up, which introduces some doubt regarding the bearish projection.
**Don't miss any of the DecisionPoint commentaries! Go to the "Notify Me" box toward the end of this blog page to be notified as soon as they are published.**
Technical Analysis is a windsock, not a crystal ball.
Happy Charting!
- Carl
NOTE: The signal status reported herein is based upon mechanical trading model signals, specifically, the DecisionPoint Trend Model. They define the implied bias of the price index based upon moving average relationships, but they do not necessarily call for a specific action. They are information flags that should prompt chart review. Further, they do not call for continuous buying or selling during the life of the signal. For example, a BUY signal will probably (but not necessarily) return the best results if action is taken soon after the signal is generated. Additional opportunities for buying may be found as price zigzags higher, but the trader must look for optimum entry points. Conversely, exit points to preserve gains (or minimize losses) may be evident before the model mechanically closes the signal.
Helpful DecisionPoint Links:
DecisionPoint Shared ChartList and DecisionPoint Chart Gallery
Price Momentum Oscillator (PMO)
Swenlin Trading Oscillators (STO-B and STO-V)
