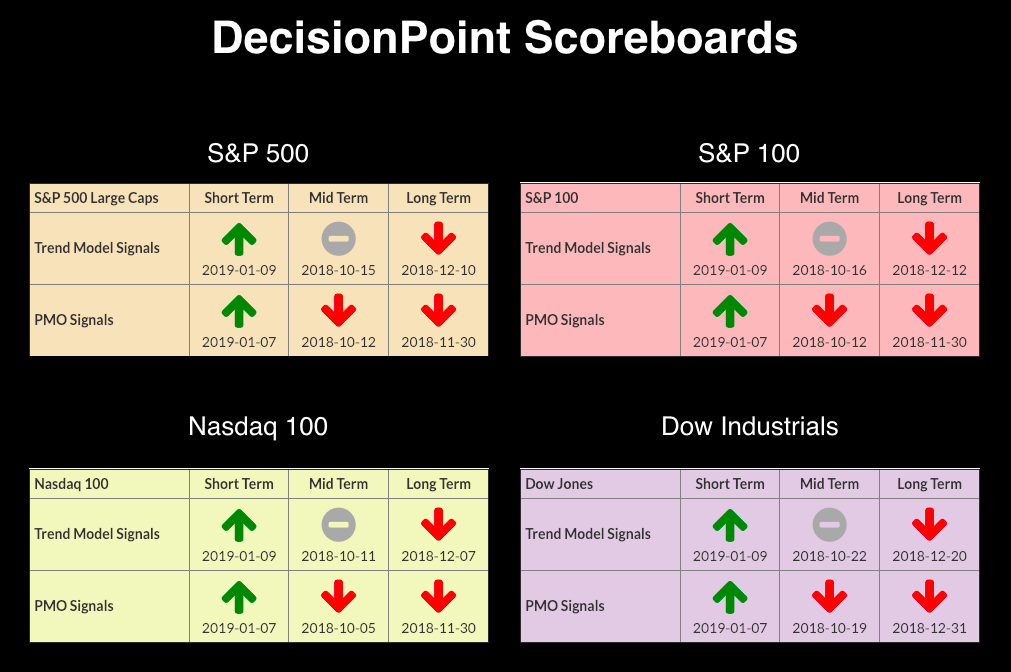
 The DecisionPoint Scoreboards are all bullish in the short term. The bearish rising wedge executed yesterday and the indicators are supporting a decline in the shorter term.
The DecisionPoint Alert presents a mid-week assessment of the trend and condition of the stock market (S&P 500), the U.S. Dollar, Gold, Crude Oil and Bonds.
Watch the latest episode of DecisionPoint on StockCharts TV's YouTube channel here!
SECTORS
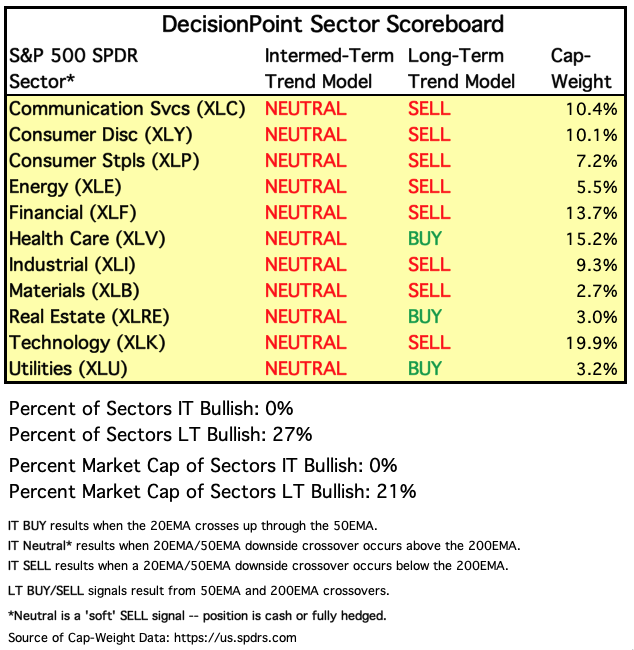
Each S&P 500 Index component stock is assigned to one (and only one) of eleven major sectors. This is a snapshot of the Intermediate-Term and Long-Term Trend Model signal status for those sectors.
STOCKS
IT Trend Model: Neutral as of 10/15/2018
LT Trend Model: SELL as of 12/14/2018
SPY Daily Chart: As annotated below, you can see that, as of yesterday, the bearish rising wedge (or breakdown from the rising trend line) has executed. Today, we saw a lower low and a lower high. Support certainly is close at the 2600 level or even 20-EMA. The PMO decelerated just a hair. I'm looking for a failed test of 2600.
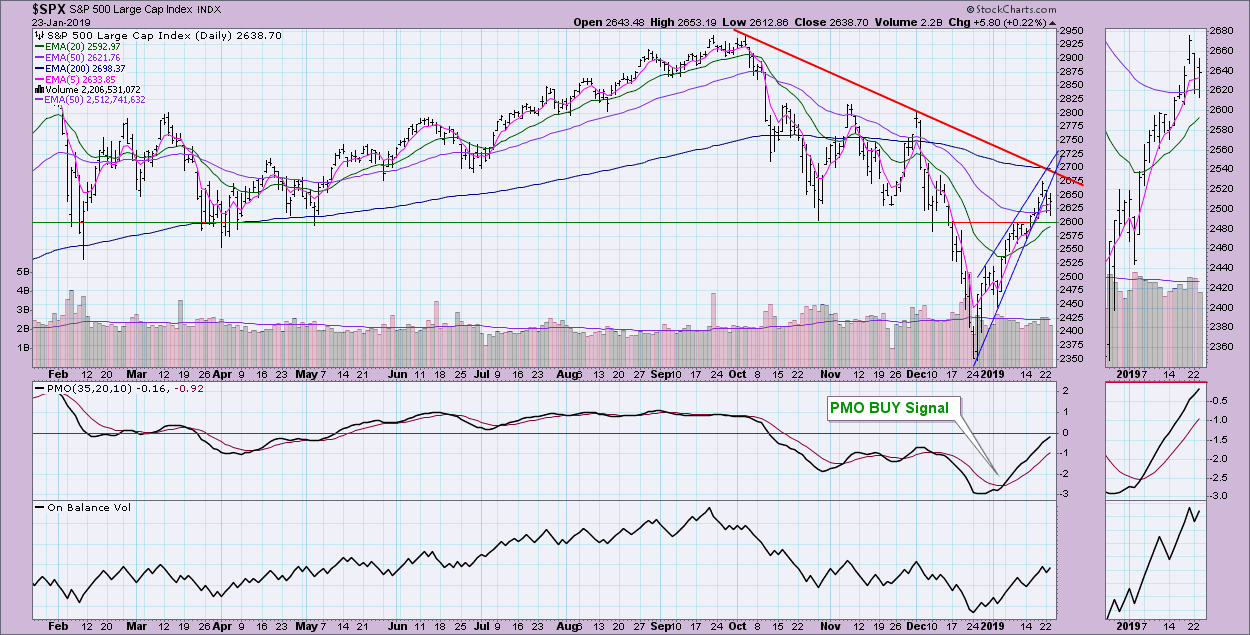
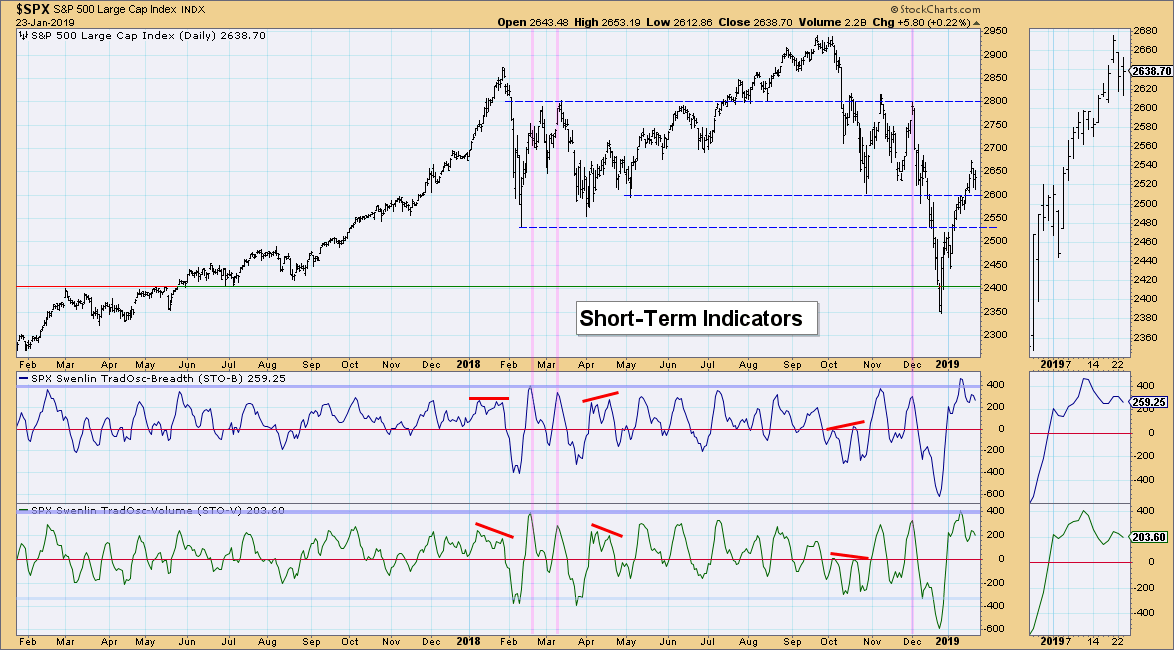
Climactic Market Indicators: Why a "failed test?" I'm seeing selling initiation flags on our ultra-short-term indicators, which basically consist of breadth and the VIX. Note the red bar climactic readings that came in today. These were accompanied by a VIX that has started down toward the lower Bollinger Band.
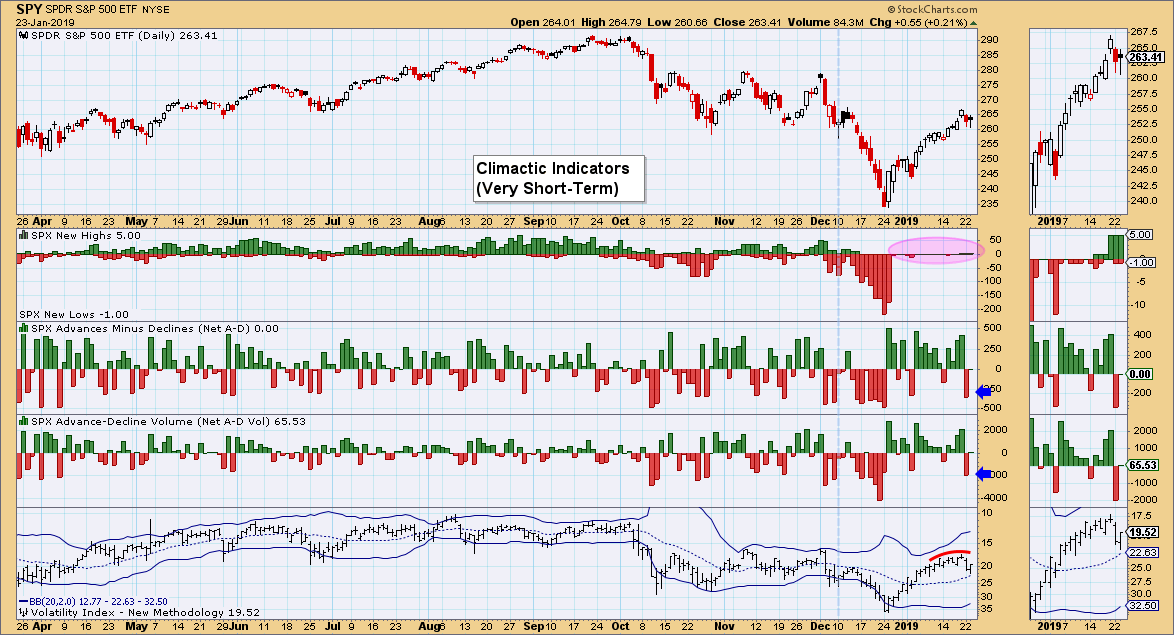
Short-Term Market Indicators: More selling initiation flags are appearing as these indicators have topped in overbought territory. The current tops are below the previous tops for said indicators, which I find bearish.
Intermediate-Term Market Indicators: On the other hand, the bulls can point to the ITBM and ITVM, which are continuing to rise. I'm noticing a slight slowing on the angle of ascent on both the ITBM/ITVM, but it's barely visible. They are now getting in somewhat overbought territory.
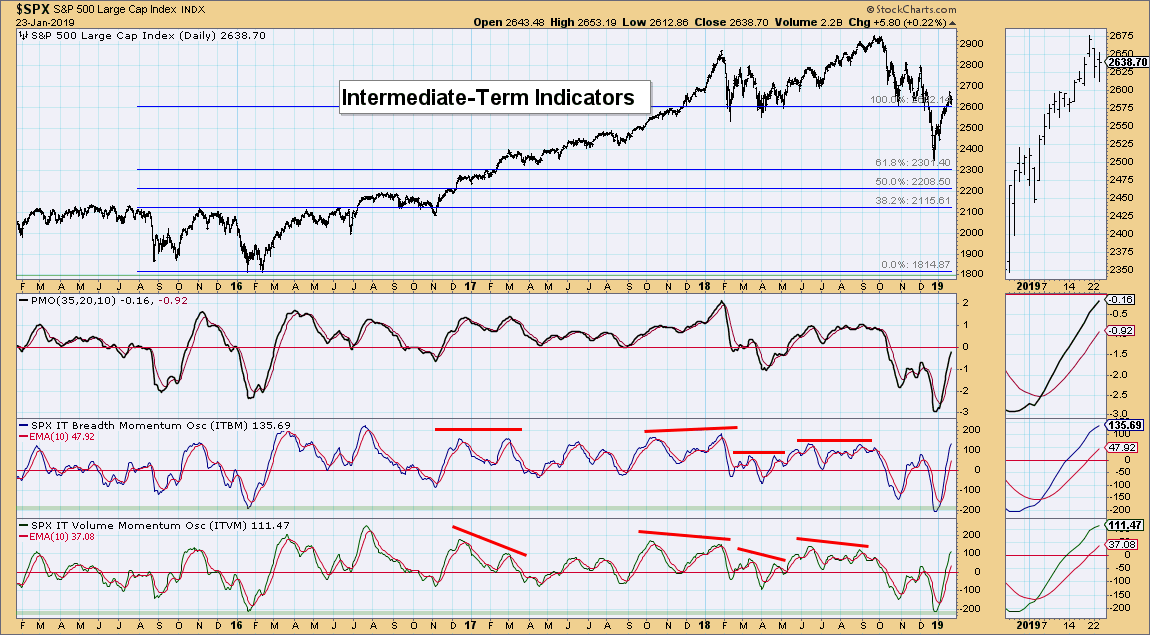
Conclusion: Based on the climactic and short-term indicator charts, I would expect to see the 2600 level unsuccessfully tested, with said test being followed by more decline.
DOLLAR (UUP)
IT Trend Model: BUY as of 4/24/2018
LT Trend Model: BUY as of 5/25/2018
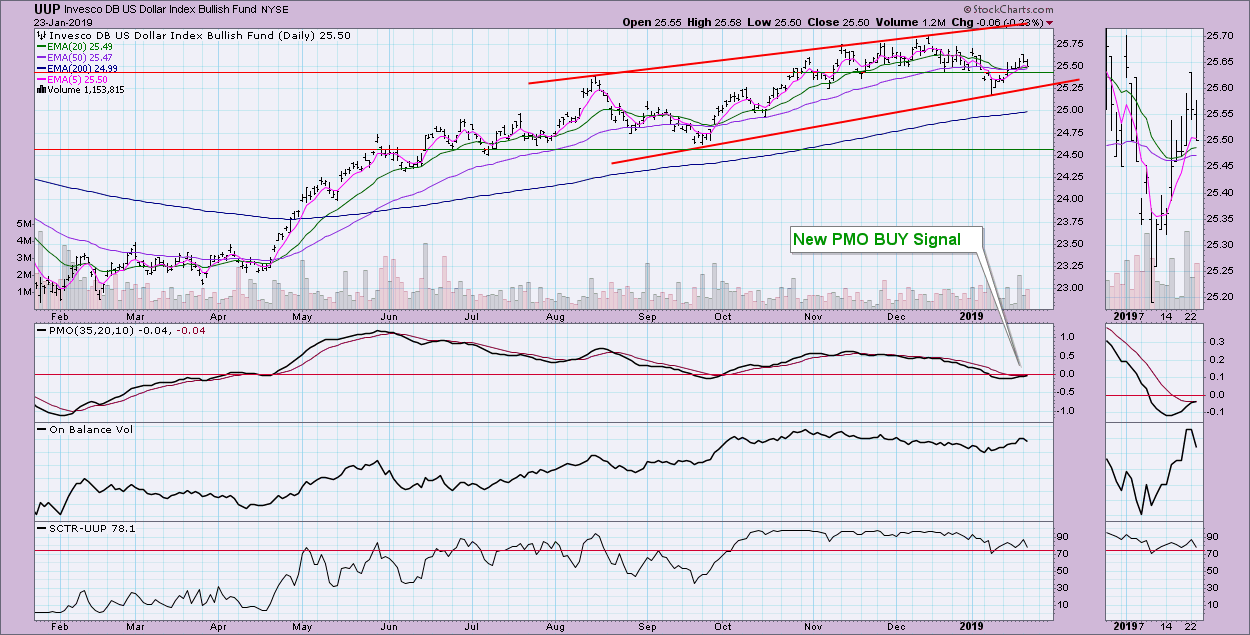
UUP Daily Chart: The Dollar is traveling in a gently rising wedge. A rising wedge is generally bearish, with the exception of a breakdown below the rising bottoms trend line. The confusing thing is that we just got a new PMO BUY signal on UUP. I suspect we may see a move to test December highs.
GOLD
IT Trend Model: BUY as of 10/19/2018
LT Trend Model: SELL as of 6/22/2018
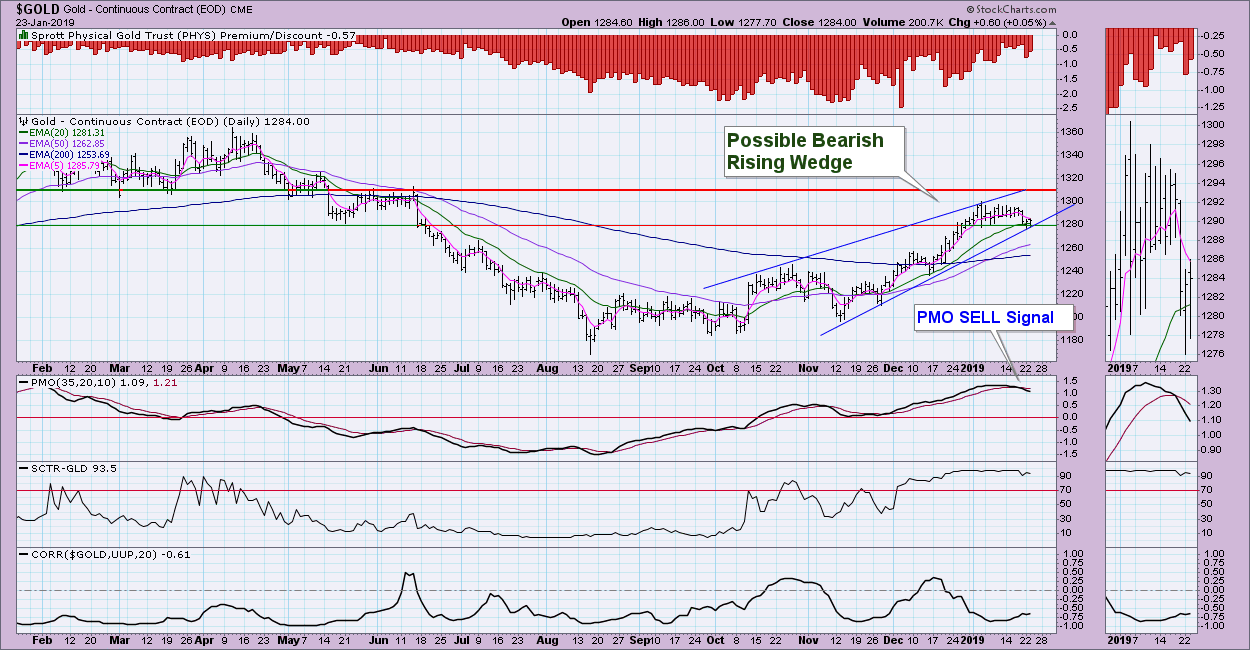
GOLD Daily Chart: Interestingly, Gold also has a rising wedge formation. I think this wedge has a higher likelihood of execution overall. The PMO is lined up in overbought territory with a SELL signal. However, if we see the market break down below 2600 again, Gold could prosper as jittery investors respond by pouring into metals.
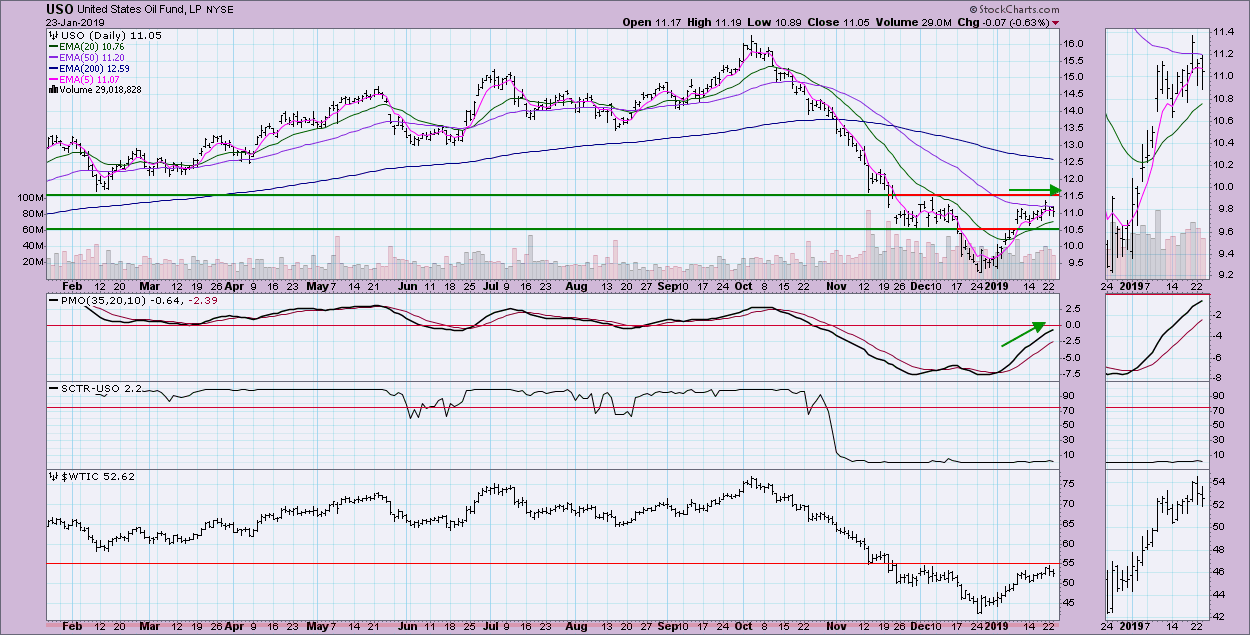
CRUDE OIL (USO)
IT Trend Model: Neutral as of 10/29/2018
LT Trend Model: SELL as of 11/23/2018
USO Daily Chart: Price has been moving sideways and the PMO has continued to rise, which is bullish. I think you could make a case for a reverse head and shoulders here. However, I'm hesitant to annotate that because it is a bit irregular and, more importantly, it isn't a pattern until it executes. However, should price break out above the neckline at $11.45 or $11.50, that would give us a minimum upside target of about $15 based on the pattern. Temper your excitement, though, because the 50-EMA is well below the 200-EMA and price needs to sustain itself above the 50-EMA.
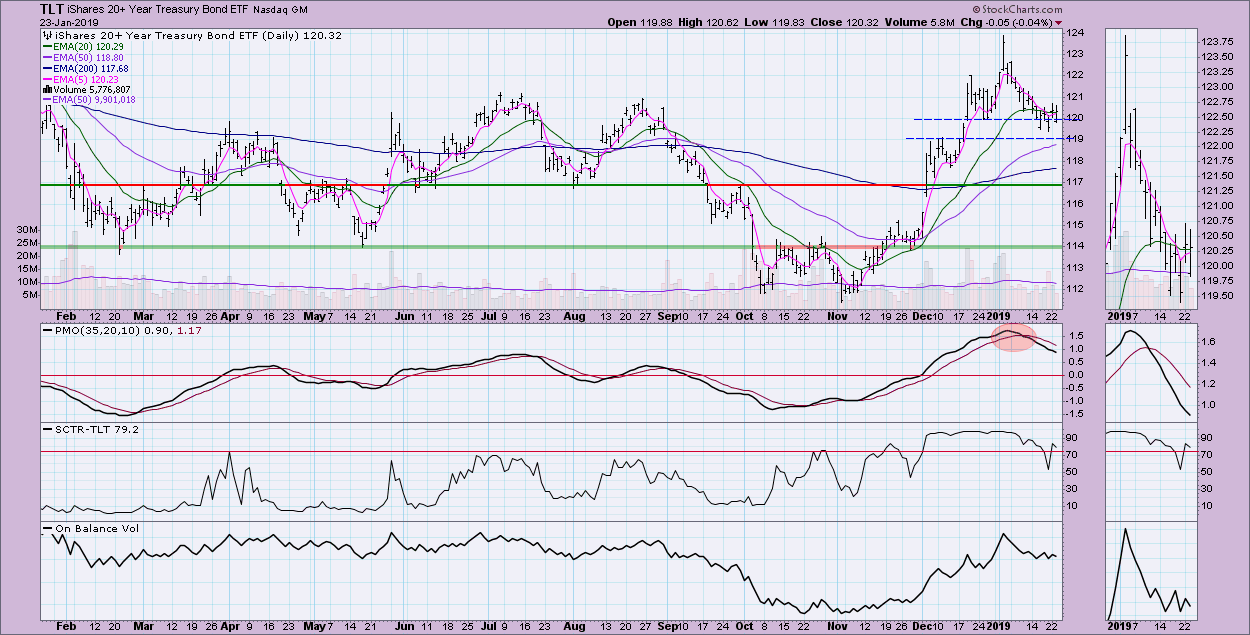
BONDS (TLT)
IT Trend Model: BUY as of 12/6/2018
LT Trend Model: BUY as of 1/2/2019
TLT Daily Chart: I don't know if I have a "head and shoulders" fixation right now, but I see a possible one forming in the short term where the right shoulder hasn't quite completed. In the short term, TLT looks ugly even if you don't take into account a possible bearish H&S. The PMO is on a SELL signal and the OBV is confirming the decline.
Technical Analysis is a windsock, not a crystal ball.
Happy Charting!
- Erin
**Don't miss any of the DecisionPoint commentaries! Go to the "Notify Me" box toward the end of this blog page to be notified as soon as they are published.**
NOTE: The signal status reported herein is based upon mechanical trading model signals, specifically, the DecisionPoint Trend Model. These define the implied bias of the price index based upon moving average relationships, but they do not necessarily call for a specific action. They are information flags that should prompt chart review. Furthermore, they do not call for continuous buying or selling during the life of the signal. For example, a BUY signal will probably (but not necessarily) return the best results if action is taken soon after the signal is generated. Additional opportunities for buying may be found as price zigzags higher, but the trader must look for optimum entry points. Conversely, exit points to preserve gains (or minimize losses) may be evident before the model mechanically closes the signal.
Helpful DecisionPoint Links:
DecisionPoint Shared ChartList and DecisionPoint Chart Gallery
Price Momentum Oscillator (PMO)
Swenlin Trading Oscillators (STO-B and STO-V)
