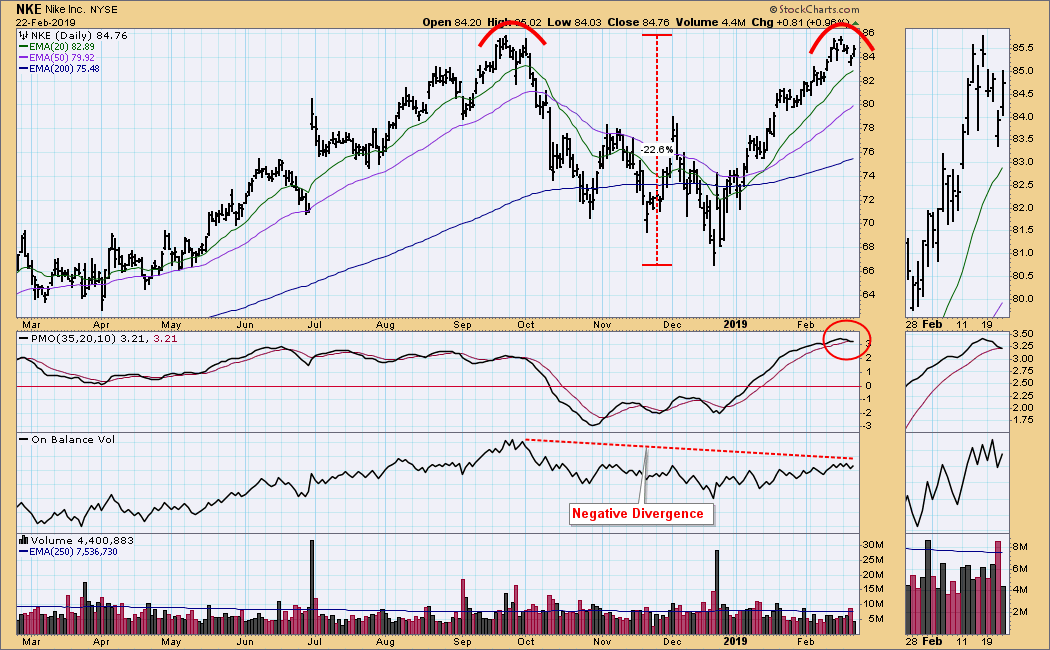
In a basketball game on Wednesday a Nike shoe literally peeled off the foot of 285-pound, 6-foot-7-inch Zion Williamson. The resulting knee injury was regrettable, but the reporting of the incident was rather amusing. For one thing, the video of the incident ran over, and over, and over. I considered offering pair of Dr. Scholls running shoes (well, maybe walking shoes) with my autograph to anyone who could prove they had seen the video more than I did (estimated 4,783 times). Quite often it was breathlessly reported that NKE was down substantially on the news, but at the lowest point it was off maybe -1.8%, and it closed down a mere -1.05%. The point being that such an isolated incident was unlikely to cause much damage to a company like Nike. What the reporters, of course, failed to do was to show a useful chart of NKE, so I will take this opportunity to remedy that shortcoming.
On our chart the dominant feature is a double top set up, which is accompanied by an OBV negative divergence, and an overbought PMO which has topped and is about to cross down through the signal line. This is a negative technical picture, which has nothing to do with the sensationalized failure of a single shoe.
The DecisionPoint Weekly Wrap presents an end-of-week assessment of the trend and condition of the stock market (S&P 500), the U.S. Dollar, Gold, Crude Oil, and Bonds.
Watch the latest episode of DecisionPoint on StockCharts TV's YouTube channel here!
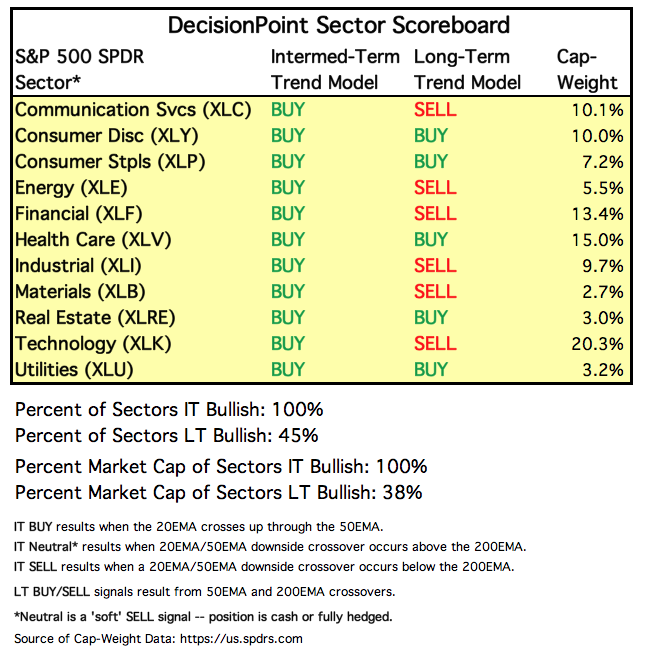
SECTORS
Each S&P 500 Index component stock is assigned to one, and only one, of 11 major sectors. This is a snapshot of the Intermediate-Term and Long-Term Trend Model signal status for those sectors.
STOCKS
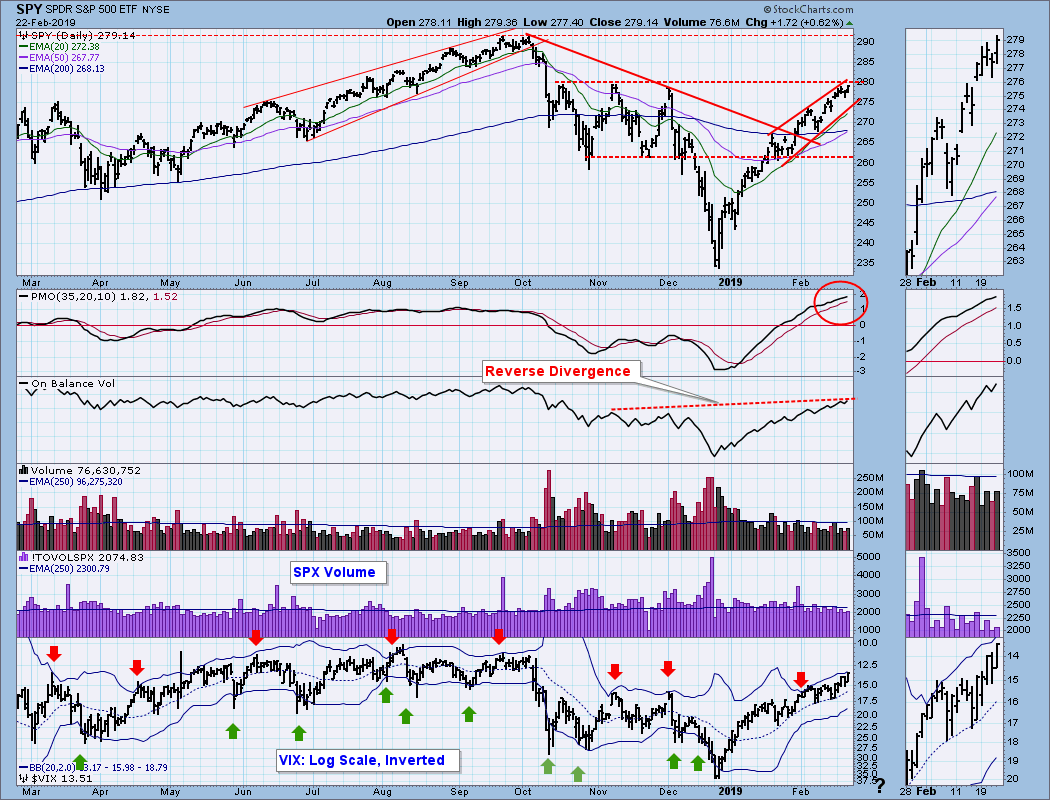
IT Trend Model: BUY as of 2/1/2019
LT Trend Model: SELL as of 12/14/2018
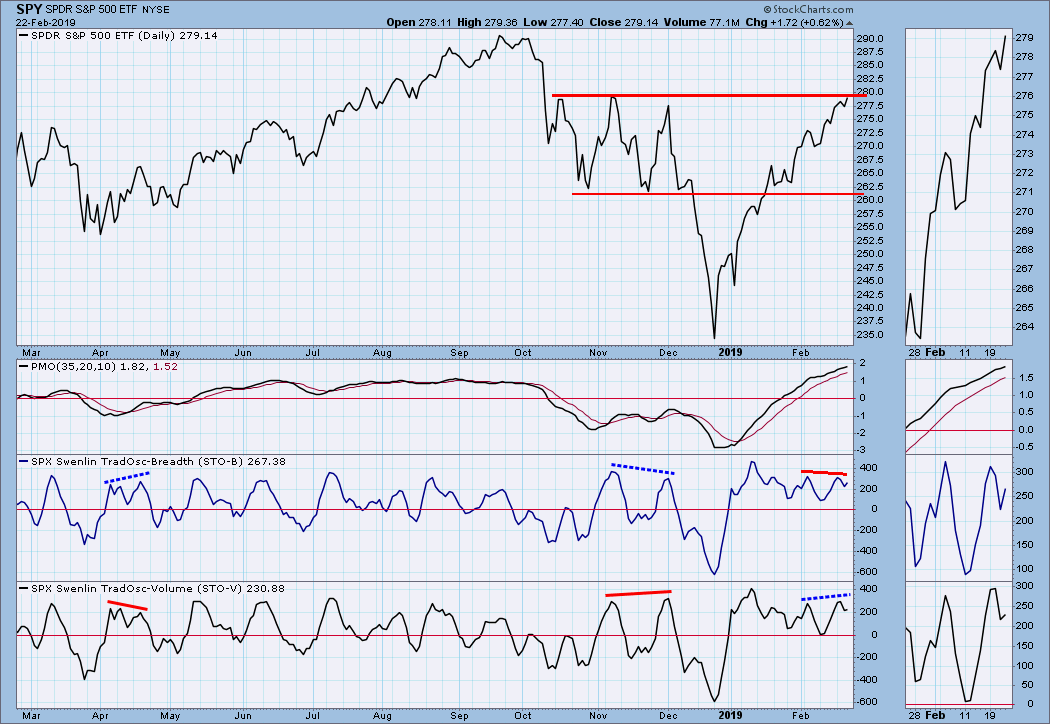
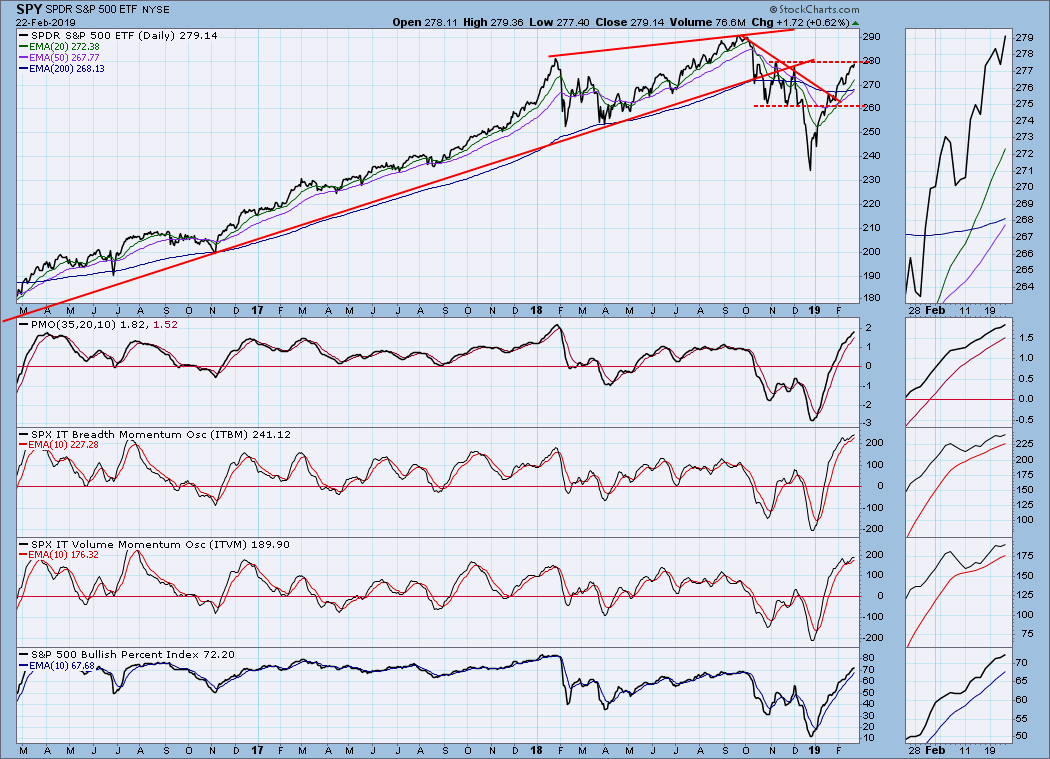
SPY Daily Chart: The rising wedge formation plus overhead resistance are the immediate influences on price. I note that the 50EMA is close to crossing above the 200EMA, and that will probably happen next week unless price gets below those moving averages quickly. The daily PMO is very overbought. And, while price pressed higher this week, volume was far from robust.
SPY Weekly Chart: Price is testing an important level of overhead resistance, and the weekly PMO is above the zero line and signal line and rising.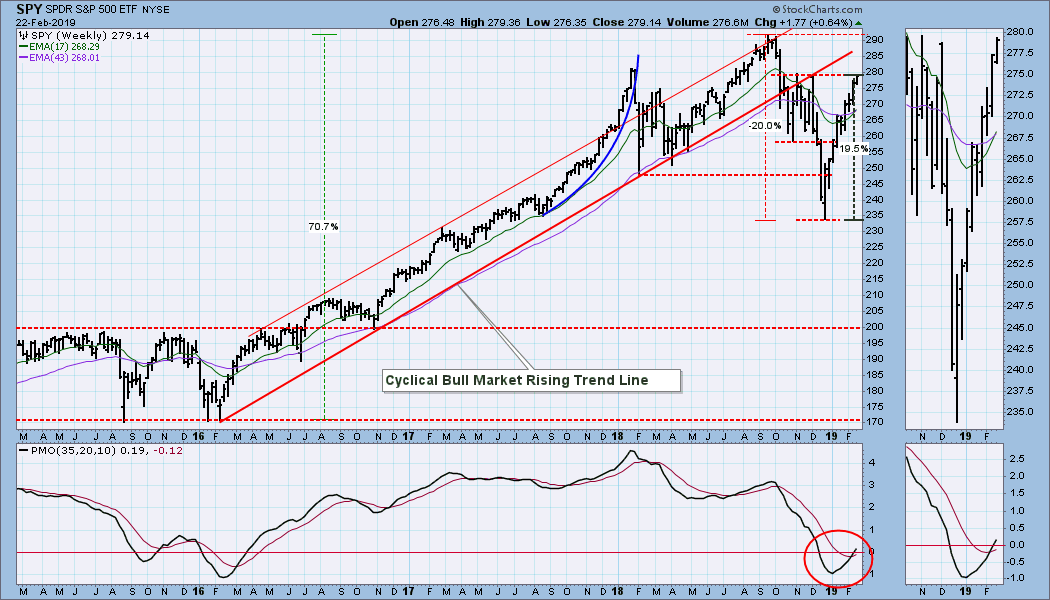
Climactic Market Indicators: We have a climactic reading on New Highs, and breadth and volume continue to narrow. The VIX ic close to tapping the top Bollinger Band, which would signal that a price top is near.
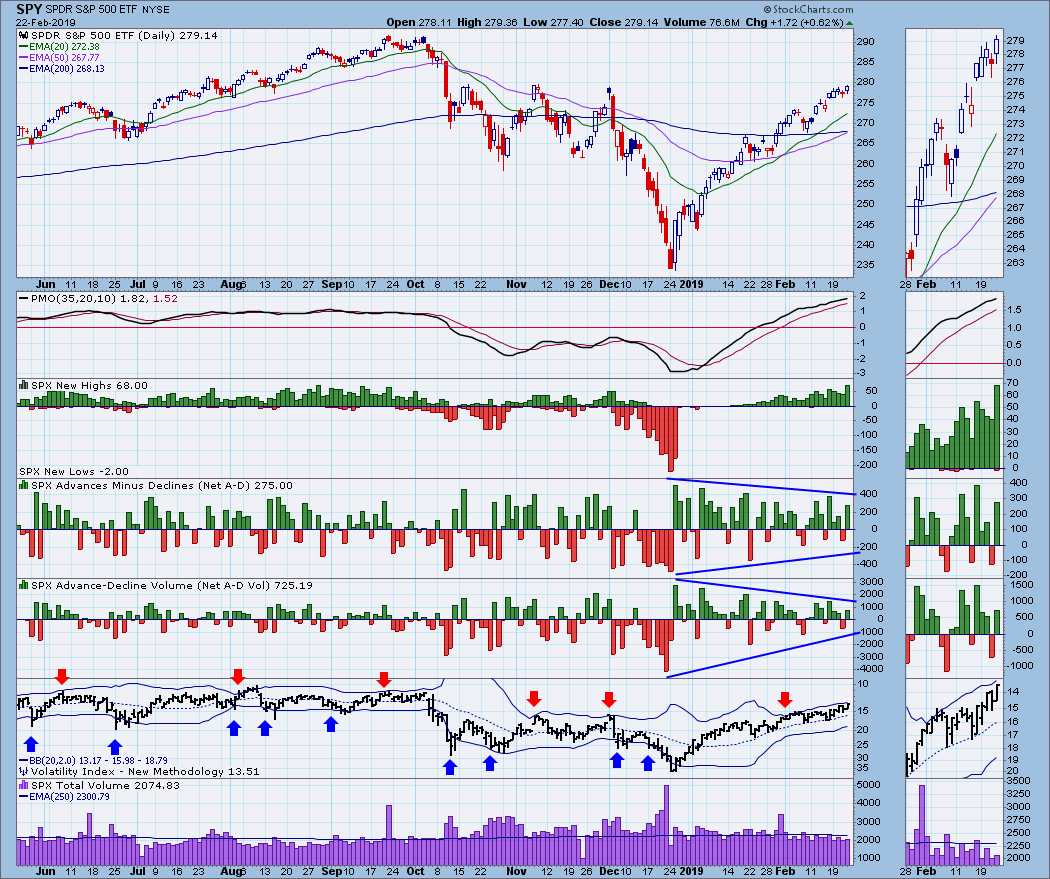
Short-Term Market Indicators: Today on StockCharts TV Erin pointed out to me that there was a divergence between the STO-B and STO-V, and that this was a fairly unusual occurrence. It is unlikely that I haven't noticed this before, but I can't remember when I did. After giving it some thought, here is a preliminary conclusion. The divergence of the STO-B and STO-V from one another is an invitation to look more closely. One indicator will confirm price action and is irrelevant. The other diverges from price action, and that one sends the message. Currently, the STO-B diverges negatively from price, indicating a price top is at hand.
 Intermediate-Term Market Indicators: These indicators are quite overbought.
CONCLUSION: China trade talks are foremost in the thoughts of market participants, and any solid agreements have the potential to move the market in a big way; however, there is no way to predict how the negotiations will resolve, and the technicals, as usual, are our best tools to find our way.
The chart immediately above is once again a good road map to possibilities. The intermediate-term indicators are very overbought, price is overbought and encountering significant resistance, and a correction seems to be the obvious outcome. I mean, I see no other logical choice! My downside target is about SPY 260 (about SPX 2650).
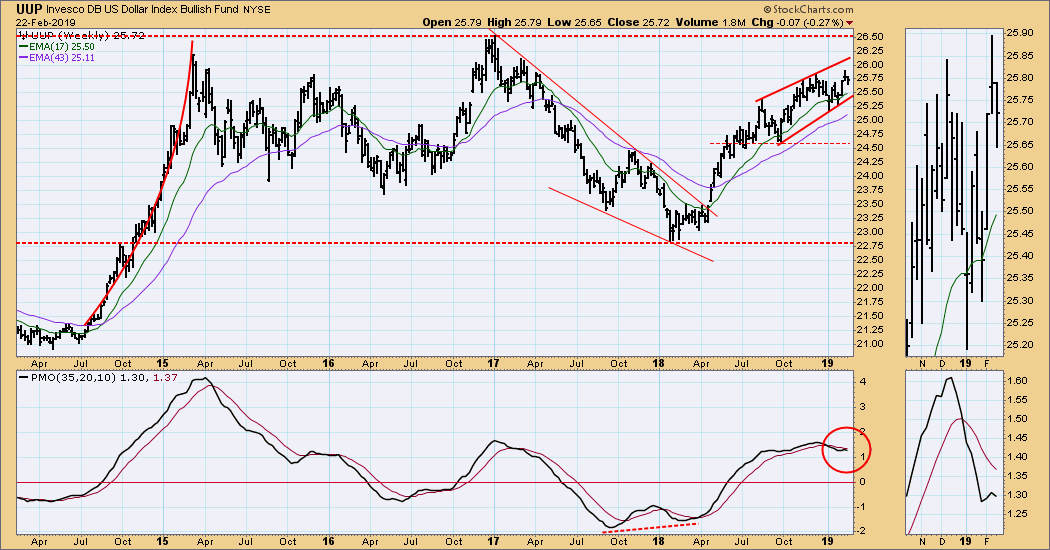
DOLLAR (UUP)
IT Trend Model: BUY as of 2/7/2019
LT Trend Model: BUY as of 5/25/2018
UUP Daily Chart: The dominant chart feature is a rising wedge. It is larger and longer-term than we usually see, so I it may not be resolved quickly.
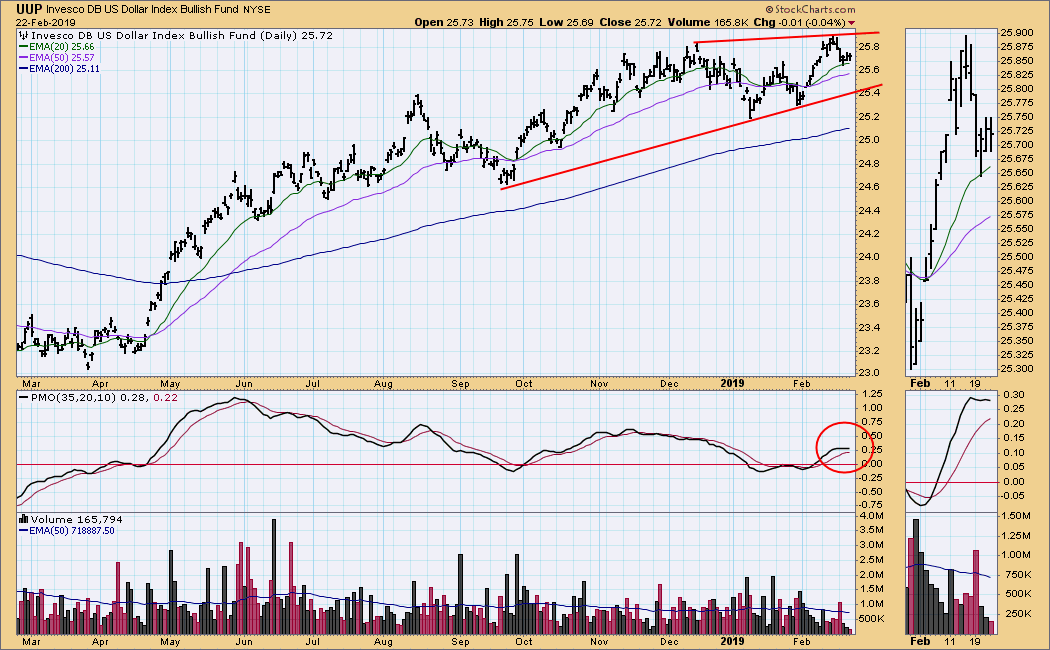
UUP Weekly Chart: In this time frame is another rising wedge, which is not as pronounced as the one on the daily chart. Note that price has topped before reaching the top of the range, and the weekly PMO has topped below the signal line, so a downside resolution is implied.
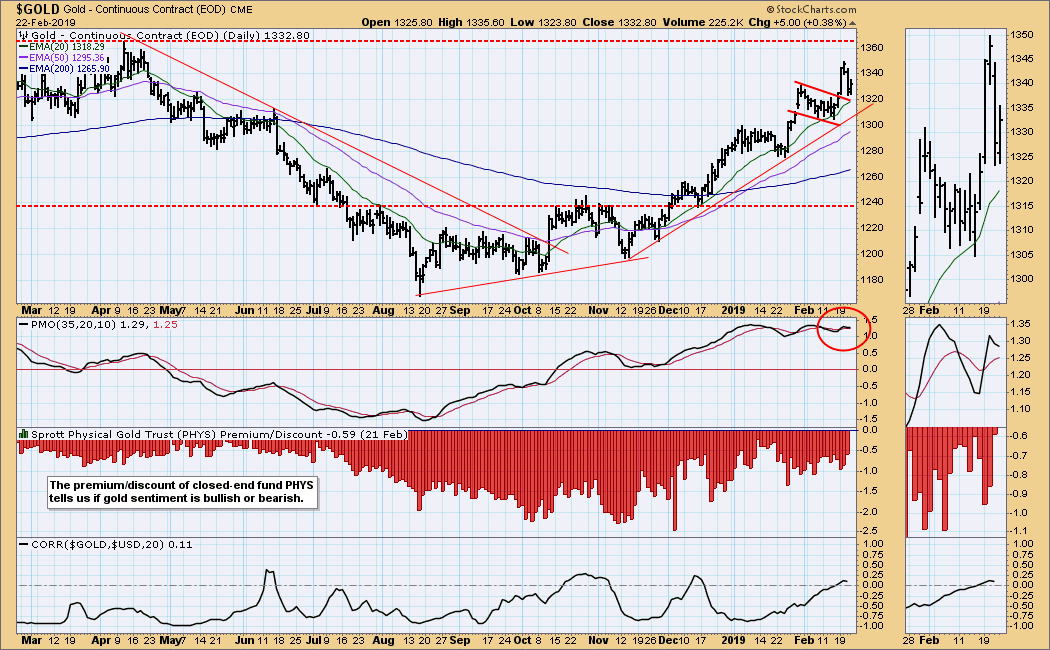
GOLD
IT Trend Model: BUY as of 10/19/2018
LT Trend Model: BUY as of 1/8/2019
GOLD Daily Chart: On Tuesday gold broke out of a flag formation, as I was expecting; however I wasn't expecting it to reverse course two days later. We can interpret this pullback as a normal 'snapback to the point of breakout,' but it is disappointing that gold didn't consolidate instead. There is currently no correlation between gold and the dollar.
GOLD Weekly Chart: This week's price bar would be a shooting star on a candlestick chart. That's bearish, but the chart is positive otherwise. Long-term resistance is at about 1380, and my expectation is that we will see 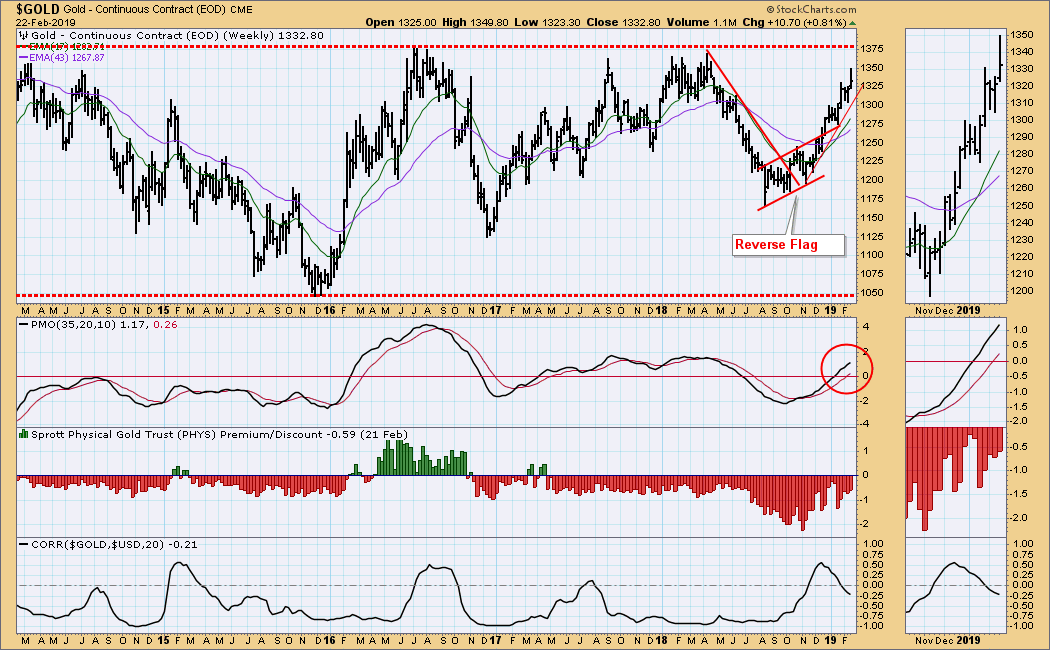
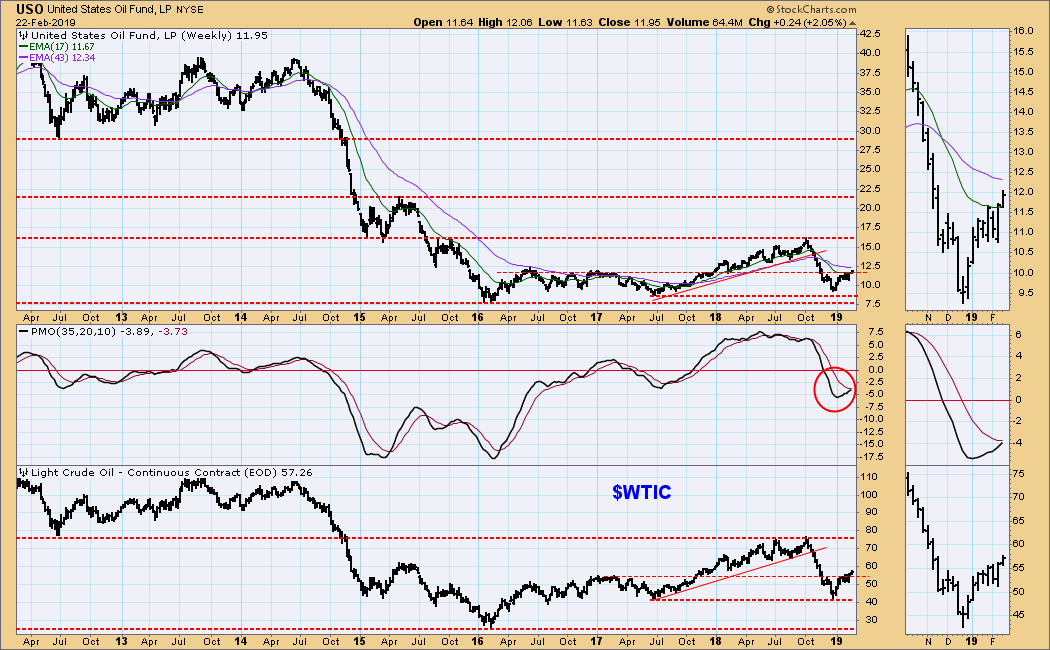
CRUDE OIL (USO)
IT Trend Model: NEUTRAL as of 10/29/2018
LT Trend Model: SELL as of 11/23/2018
USO Daily Chart: A reverse head and shoulders pattern has executed -- price broke above the neckline. The daily PMO is becoming overbought.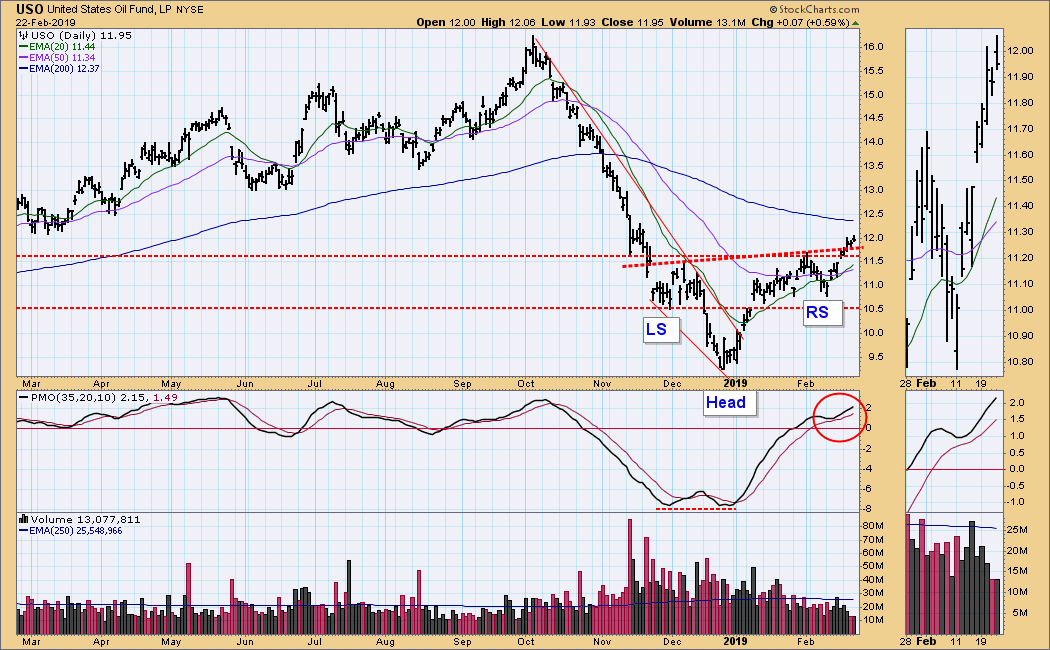
USO Weekly Chart: The reverse head and shoulders theme persists in this time frame, and a potential upside target for WTIC is about $76/bbl, which is the top of a range defined by the 2018 high. The weekly PMO is rising, somewhat sluggishly, and it is below the signal line.
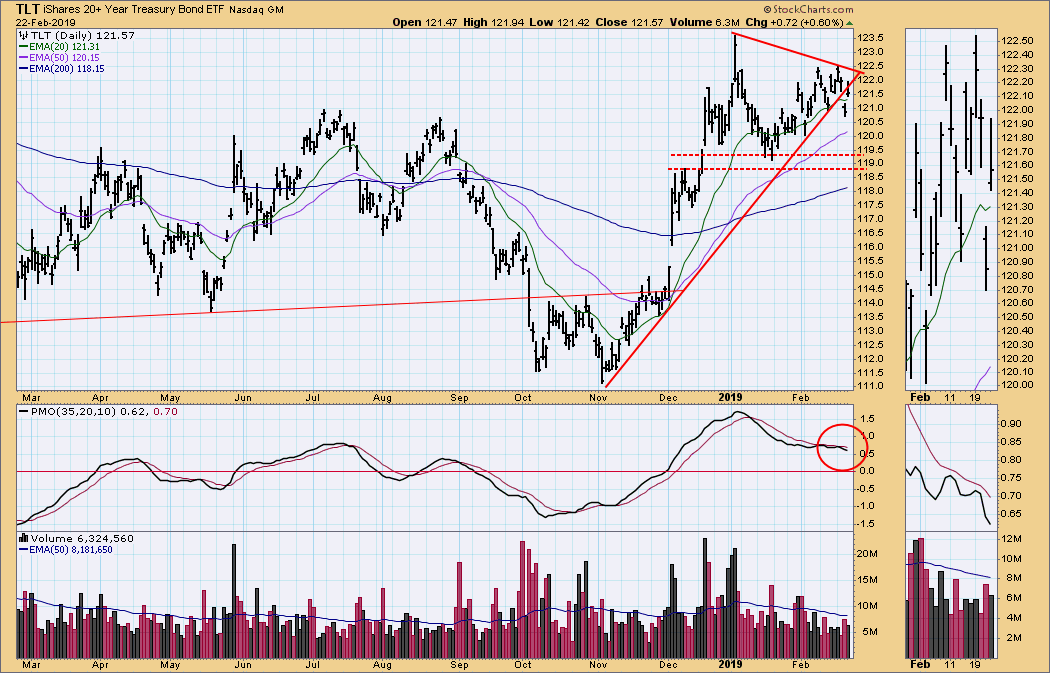
BONDS (TLT)
IT Trend Model: BUY as of 12/6/2018
LT Trend Model: BUY as of 1/2/2019
TLT Daily Chart: A rising triangle resolved downward, but the three-month trading range is intact.
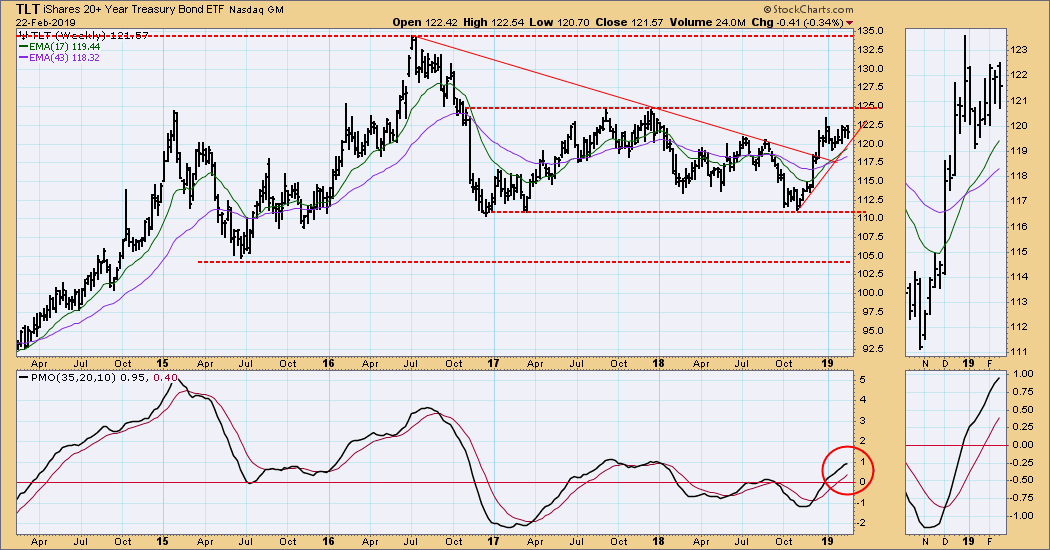
TLT Weekly Chart: The dominant feature is the two-year trading range, and TLT is in a rising trend to reach for the top of that range.
**Don't miss any of the DecisionPoint commentaries! Go to the "Notify Me" box toward the end of this blog page to be notified as soon as they are published.**
Technical Analysis is a windsock, not a crystal ball.
Happy Charting!
- Carl
NOTE: The signal status reported herein is based upon mechanical trading model signals, specifically, the DecisionPoint Trend Model. They define the implied bias of the price index based upon moving average relationships, but they do not necessarily call for a specific action. They are information flags that should prompt chart review. Further, they do not call for continuous buying or selling during the life of the signal. For example, a BUY signal will probably (but not necessarily) return the best results if action is taken soon after the signal is generated. Additional opportunities for buying may be found as price zigzags higher, but the trader must look for optimum entry points. Conversely, exit points to preserve gains (or minimize losses) may be evident before the model mechanically closes the signal.
Helpful DecisionPoint Links:
DecisionPoint Shared ChartList and DecisionPoint Chart Gallery
Price Momentum Oscillator (PMO)
Swenlin Trading Oscillators (STO-B and STO-V)
