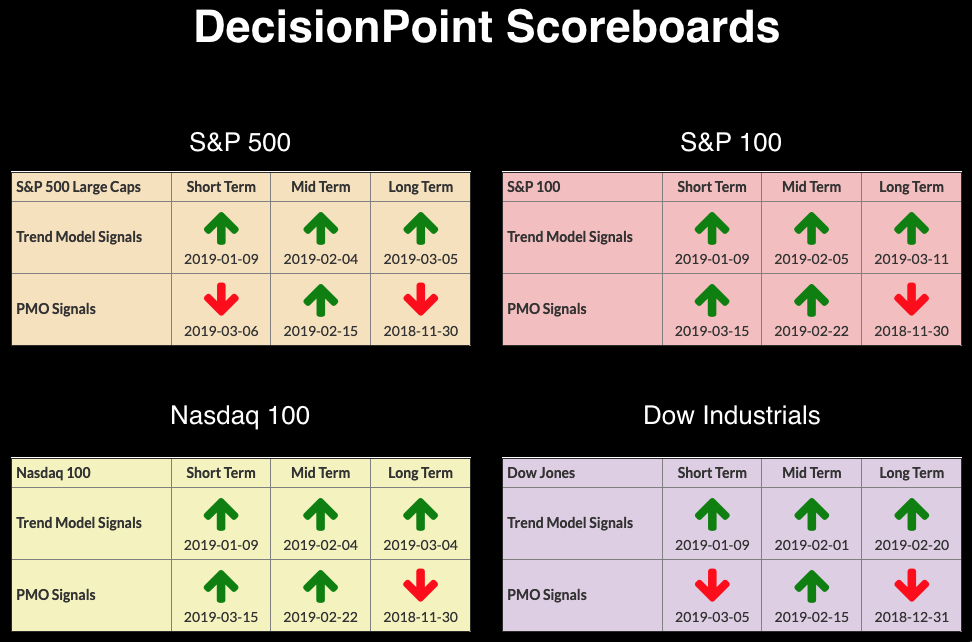
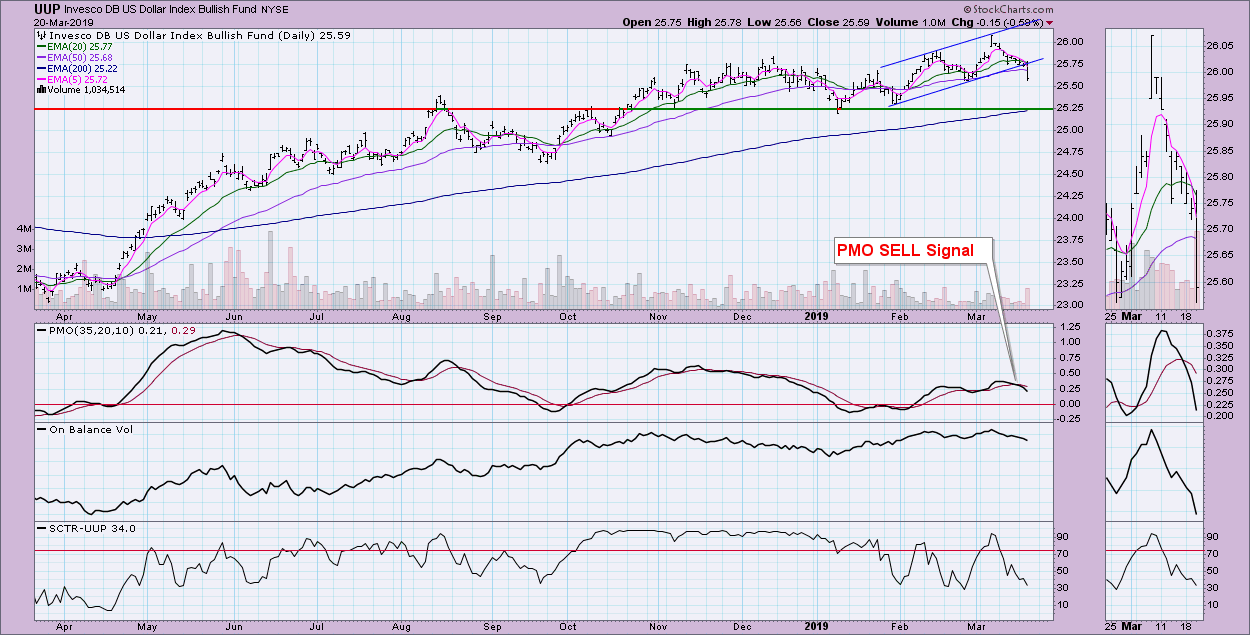
 The Price Momentum Oscillator (PMO) has topped underneath the signal line, something I consider especially bearish in the short term. Our short-term indicators have presented another "attention flag" divergence, which could be pointing to a more lasting decline. Today, the Dollar broke down dramatically on the heels of a PMO SELL signal. The DecisionPoint Scoreboards below show us that both the Dow and the SPX are lagging in terms of the short-term PMO signals and, with a decline likely to continue, those SELL signals will remain intact. Nothing new on the DP Sector Scoreboard underneath the large-cap Scoreboard.
The DecisionPoint Alert presents a mid-week assessment of the trend and condition of the stock market (S&P 500), the U.S. Dollar, Gold, Crude Oil and Bonds.
Watch the latest episode of DecisionPoint on StockCharts TV's YouTube channel here!
SECTORS
Each S&P 500 Index component stock is assigned to one, and only one, of eleven major sectors. This is a snapshot of the Intermediate-Term and Long-Term Trend Model signal status for those sectors.
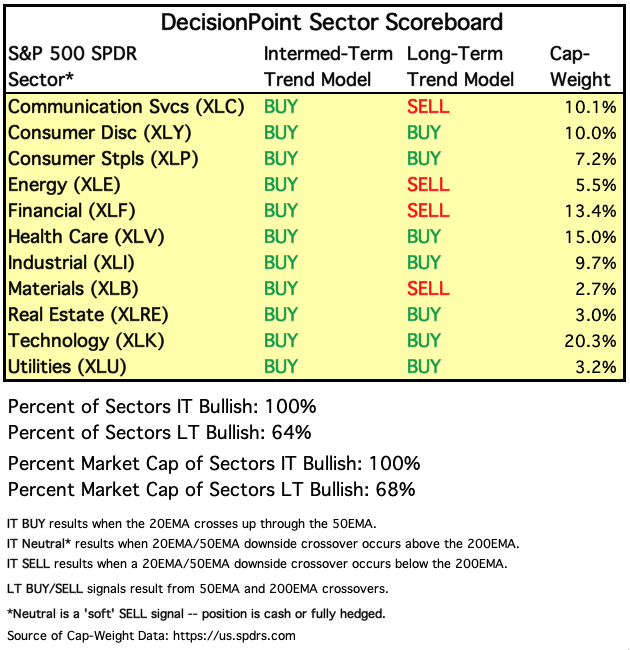
STOCKS
IT Trend Model: BUY as of 2/1/2019
LT Trend Model: BUY (SPY) as of 2/26/2019
SPY Daily Chart: There are certainly some mixed messages on the SPX chart. The breakout this week previously appeared to be the beginning of the execution of the bullish ascending triangle. Unfortunately we never got a decisive (≥3%) breakout to confirm the pattern. Now we are likely looking at a bearish rising wedge. I'm noting a significant negative divergence between price tops and OBV tops, which doesn't bode well. My sense is that we will test the rising bottoms trend line that formed the bottom of the busted triangle pattern. The PMO topped below its signal line, which I read as especially bearish for the short term. A test of that rising trend line would put price right around 2750-2760.
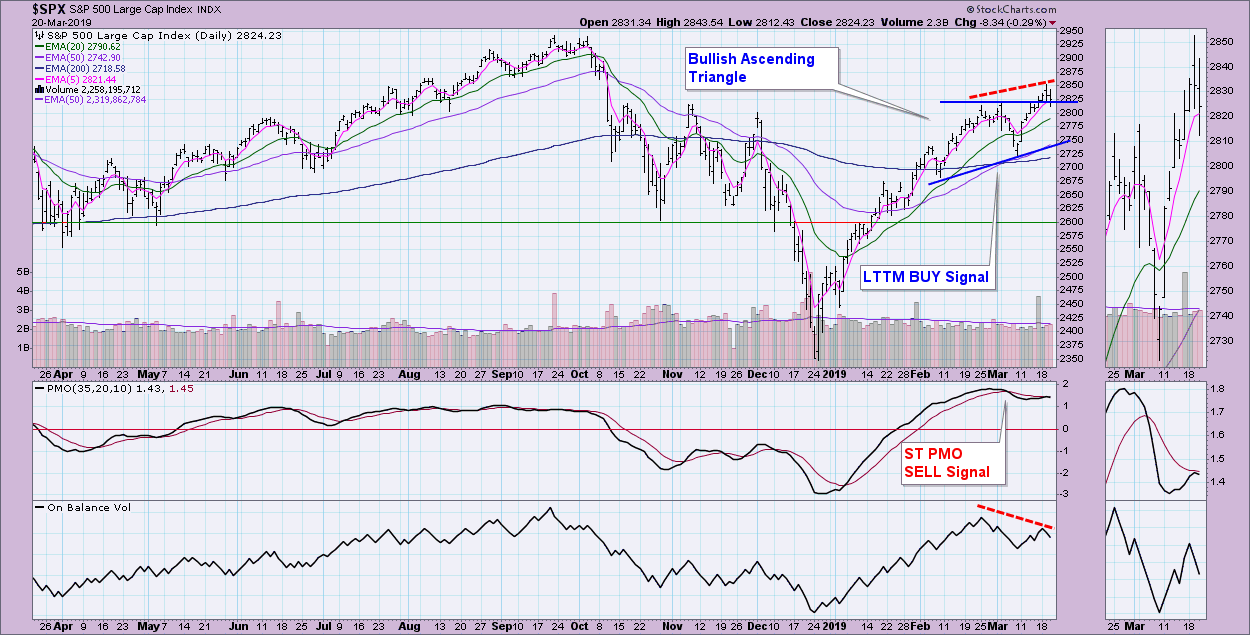
Climactic Market Indicators: We have climactic negative breadth, but do not have the confirming VIX Bollinger Band breakdown, nor New Highs/New Lows climactic readings. This could be a selling initiation. It certainly seems plausible that this decline will continue going by the daily chart above.
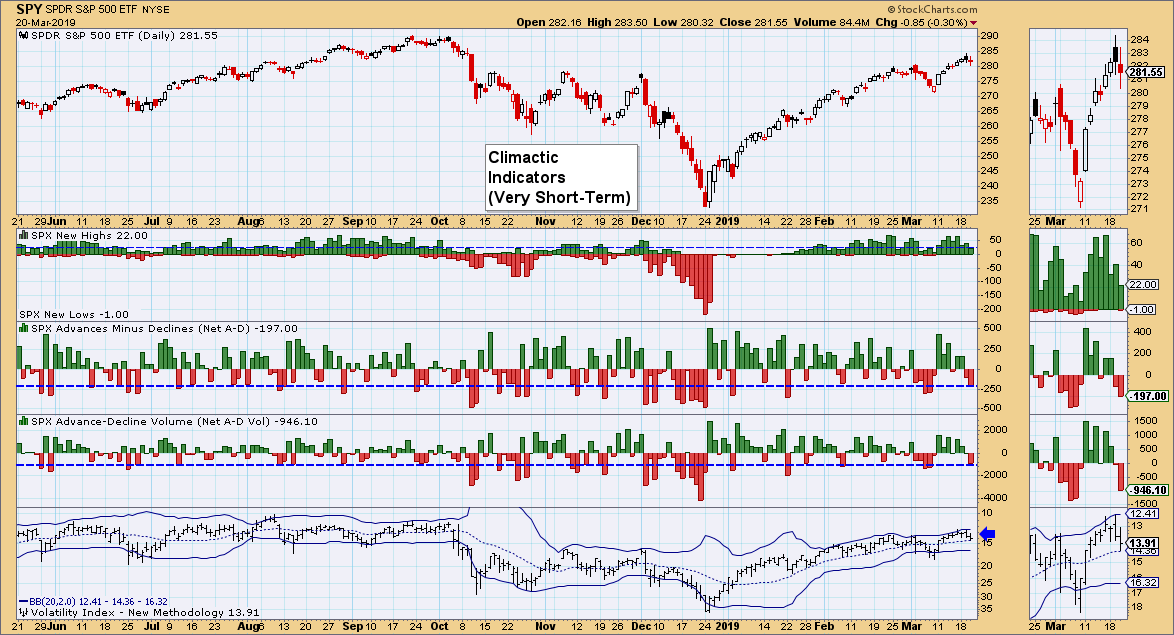
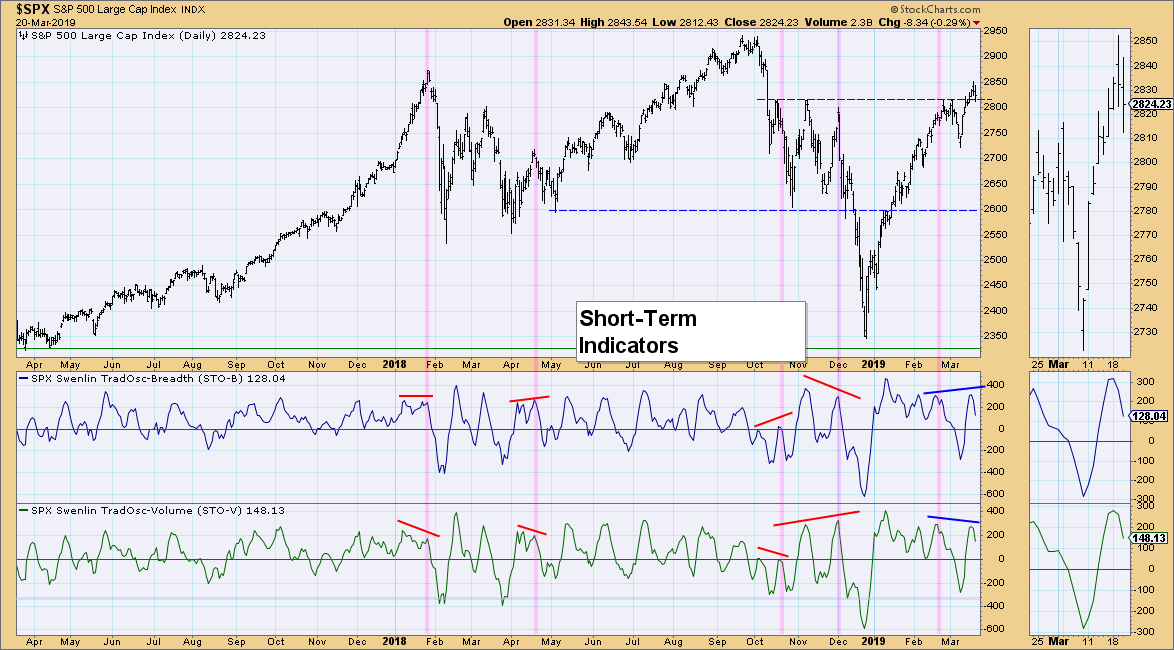
Short-Term Market Indicators: The phenomena of divergences between the STO-B and STO-V only began happening regularly in 2018; Carl and I believe it is an attention flag worth investigating further. In my estimation, this divergence is coming off a healthy rally, which suggests that we are vulnerable to a decline or perhaps correction.
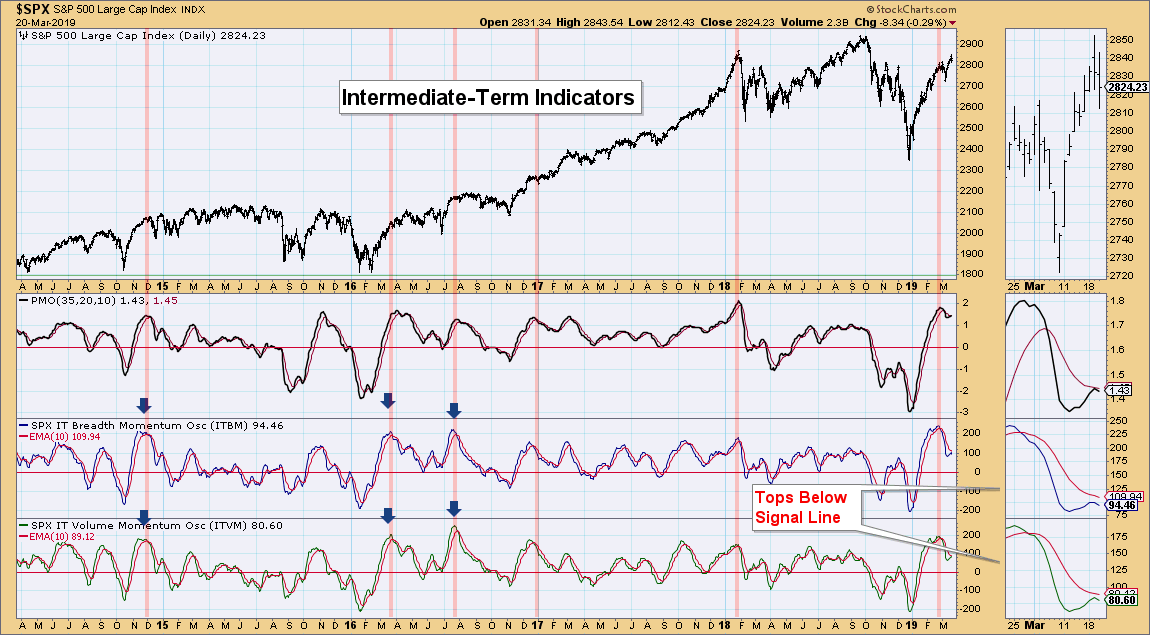
Intermediate-Term Market Indicators: These indicators had previously been looking very bullish; today, however, we saw both top underneath their signal line. As I have mentioned in prior articles, I generally don't get too bullish until these indicators actually have positive crossovers. Today's top is a great example of why it's a good idea to wait for crossovers.
Conclusion: All three timeframes are looking bearish and the indicators are confirming that assessment. I am looking for some follow-through on today's drop, bringing the price down to the 2760 area, with the possibility of a deeper decline or correction to the 2700 level.
DOLLAR (UUP)
IT Trend Model: BUY as of 2/7/2019
LT Trend Model: BUY as of 5/25/2018
UUP Daily Chart: The bottom fell out on the Dollar today. UUP had formed a rising trend channel, but price broke straight through. We did have warning: the PMO triggered a SELL signal on Monday, while the OBV and volume in general were also indications of a near-term breakdown in the making. I would look for a test just above $25.25.
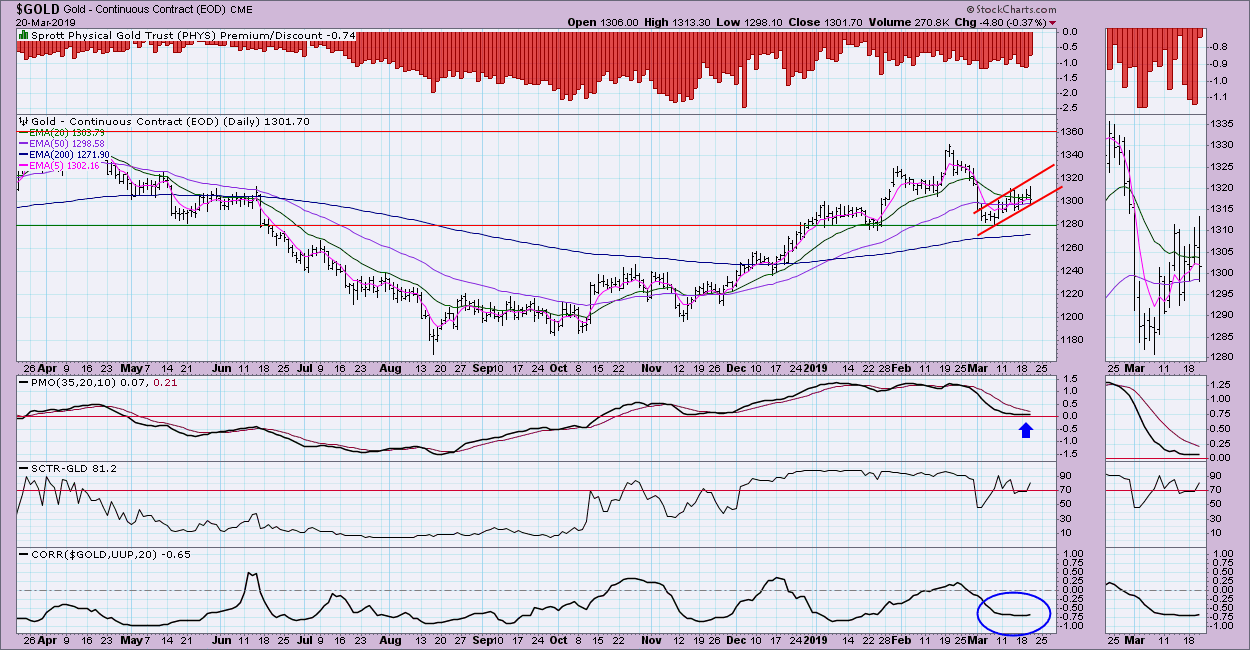
GOLD
IT Trend Model: BUY as of 10/19/2018
LT Trend Model: BUY as of 1/8/2019
GOLD Daily Chart: The demise of the Dollar is generally Gold's fortune, but that isn't the case today. Gold declined today, though it is holding onto a rising trend channel. The PMO has flattened out during this rally and is stubbornly refusing to move upward. Overall, Gold is still bullish. The discount rate is still elevated, suggesting bearish sentiment. With sentiment being contrarian, this is positive for Gold.
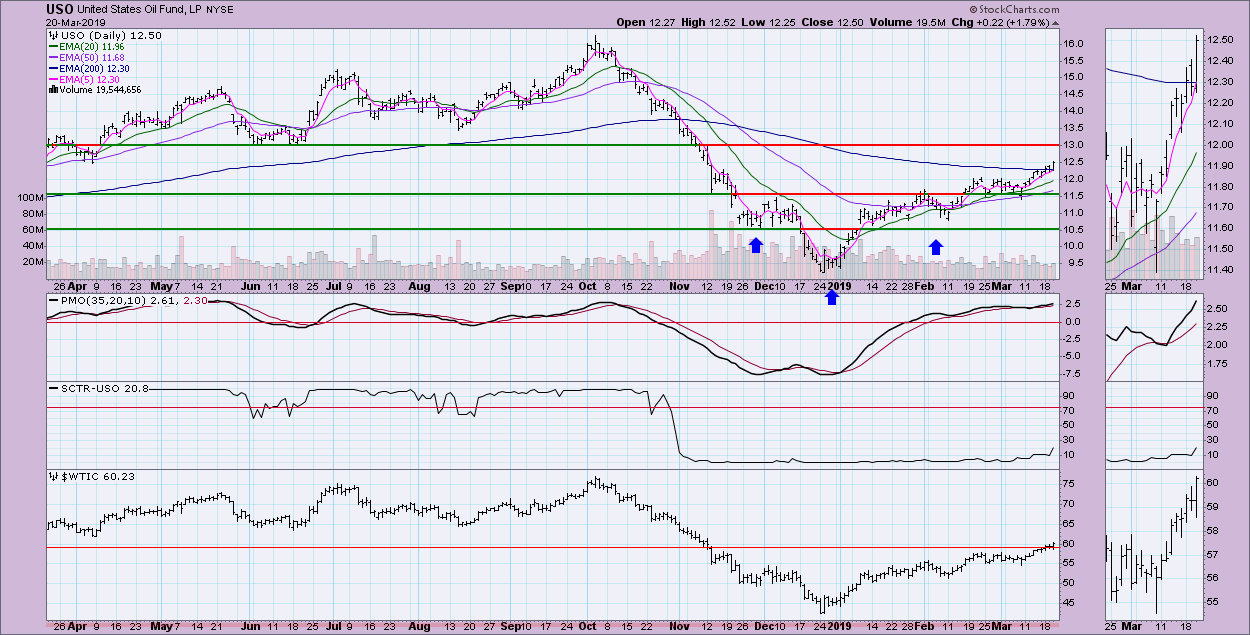
CRUDE OIL (USO)
IT Trend Model: BUY as of 2/19/2019
LT Trend Model: SELL as of 11/23/2018
USO Daily Chart: Oil has been on a rally since the December low. That rally has been "tortured," though, struggling to stay in a rising trend as it stops to consolidate along the way. The reverse head and shoulders has executed, so I'm looking for a move to $13 or, if the pattern executes the way it's supposed to, the upside target near overhead resistance at $15 (around the July top).
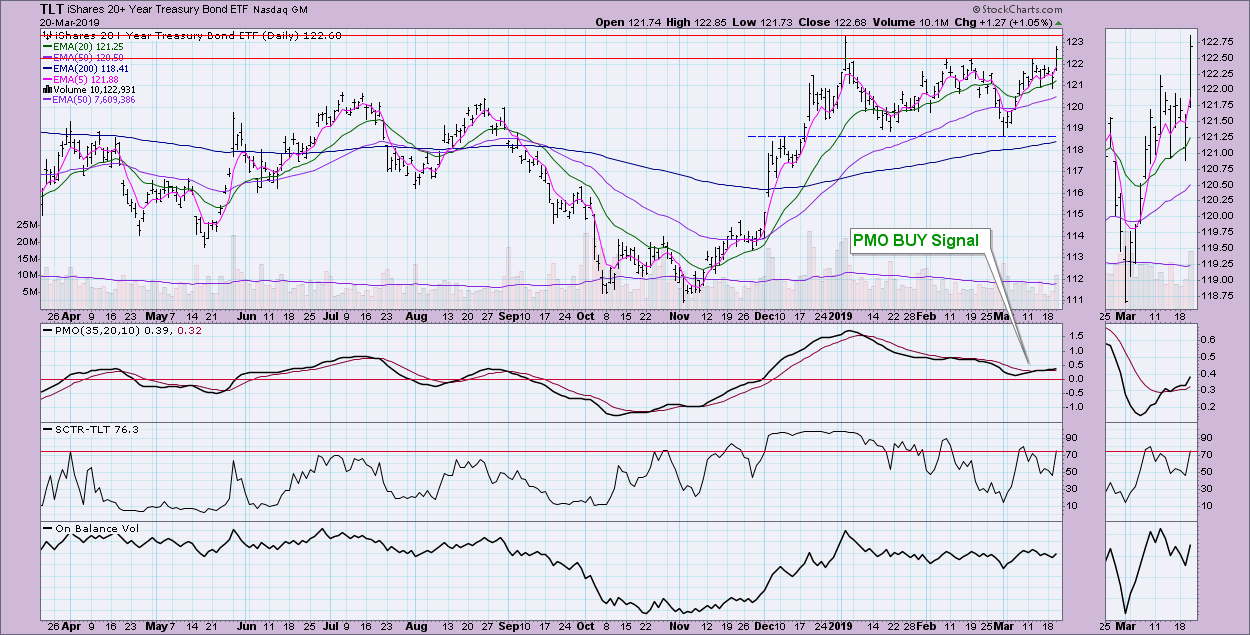
BONDS (TLT)
IT Trend Model: BUY as of 12/6/2018
LT Trend Model: BUY as of 1/2/2019
TLT Daily Chart: Bonds are looking tasty right now. Today's breakout was impressive, coming on the heels of a PMO BUY signal. I would look for bonds to break to annual highs very soon.
Technical Analysis is a windsock, not a crystal ball.
Happy Charting!
- Erin
**Don't miss any of the DecisionPoint commentaries! Go to the "Notify Me" box toward the end of this blog page to be notified as soon as they are published.**
NOTE: The signal status reported herein is based upon mechanical trading model signals, specifically, the DecisionPoint Trend Model. These define the implied bias of the price index based upon moving average relationships, but they do not necessarily call for a specific action. They are information flags that should prompt chart review. Further, they do not call for continuous buying or selling during the life of the signal. For example, a BUY signal will probably (but not necessarily) return the best results if action is taken soon after the signal is generated. Additional opportunities for buying may be found as price zigzags higher, but the trader must look for optimum entry points. Conversely, exit points to preserve gains (or minimize losses) may be evident before the model mechanically closes the signal.
Helpful DecisionPoint Links:
DecisionPoint Shared ChartList and DecisionPoint Chart Gallery
Price Momentum Oscillator (PMO)
Swenlin Trading Oscillators (STO-B and STO-V)
