 There are no changes this week on the DecisionPoint Scoreboards or on the DecisionPoint Sector Scoreboard. The market appears strong, but there are a few items under the hood I'm concerned about. Good news for Gold as it just triggered a Price Momentum Oscillator (PMO) BUY signal today. Bonds (TLT) just rallied off the 20-EMA even after a PMO SELL signal appeared a few days ago.
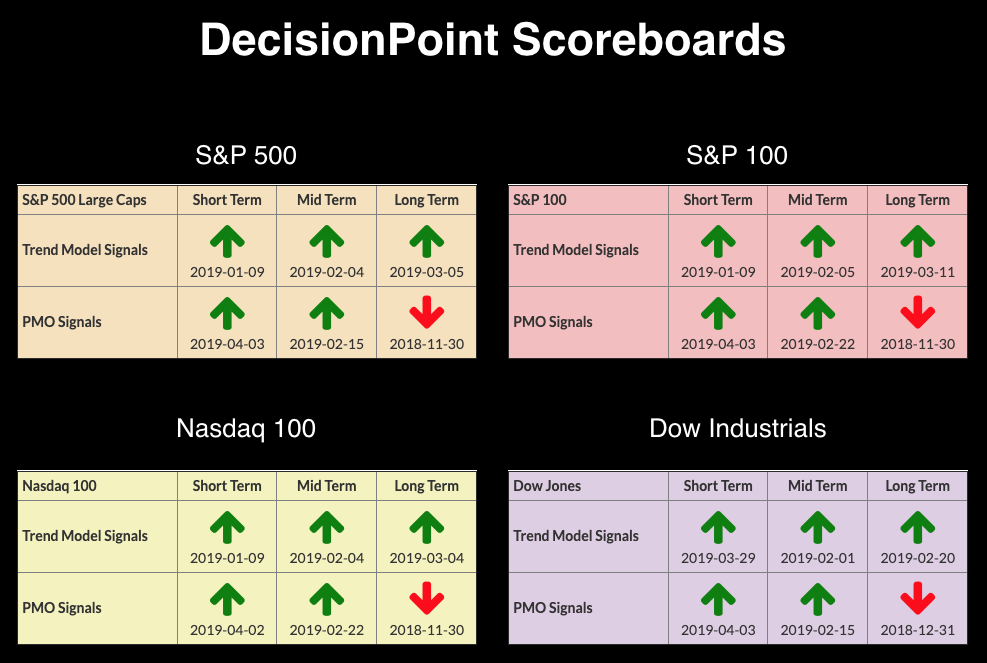
The DecisionPoint Alert presents a mid-week assessment of the trend and condition of the stock market (S&P 500), the U.S. Dollar, Gold, Crude Oil and Bonds.
Watch the latest episode of DecisionPoint on StockCharts TV's YouTube channel here!
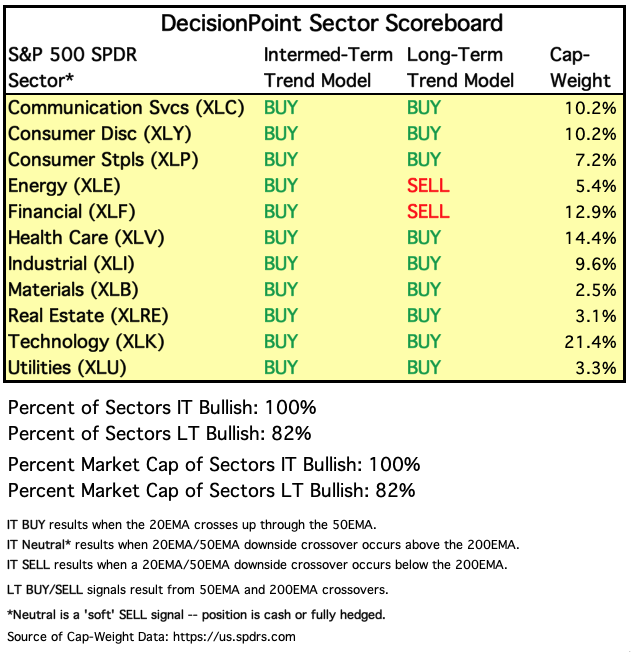
SECTORS
Each S&P 500 Index component stock is assigned to one, and only one, of eleven major sectors. This is a snapshot of the Intermediate-Term and Long-Term Trend Model signal status for those sectors.
STOCKS
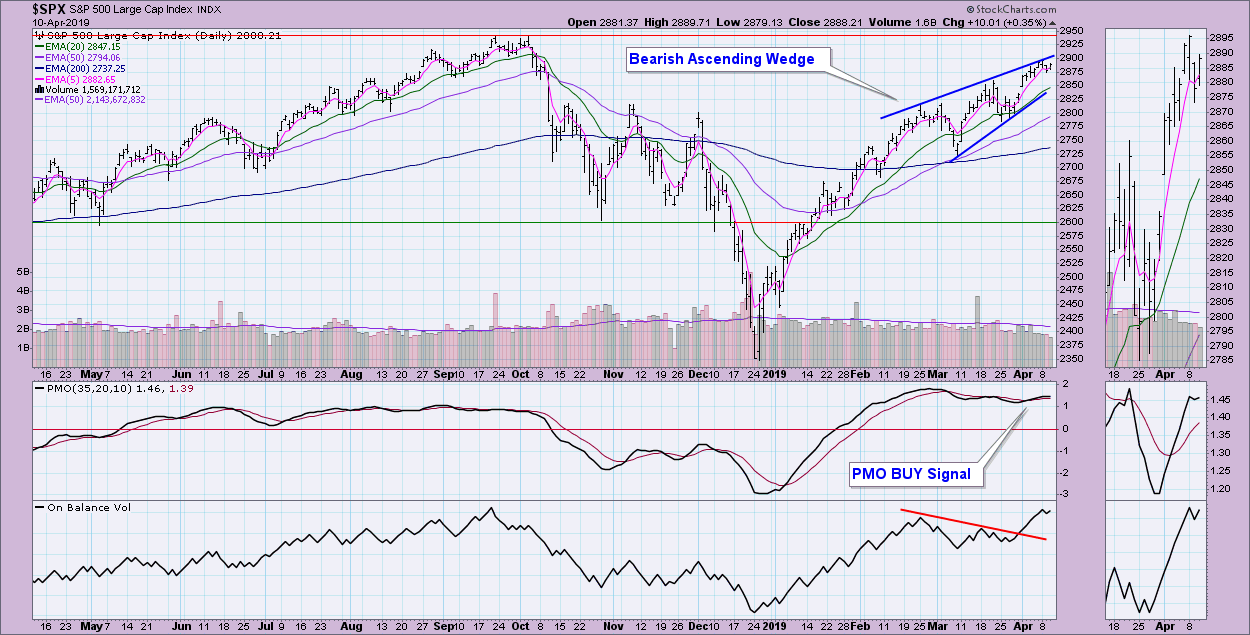
IT Trend Model: BUY as of 2/1/2019
LT Trend Model: BUY (SPY) as of 2/26/2019
SPY Daily Chart: The PMO ticked downward on yesterday's pullback, but it has already righted itself and is moving higher once again. The normal range for the SPX's PMO is from about -2 to +2. Given that, the current 1.46 PMO reading is only somewhat overbought and could certainly stretch higher. The biggest issue for me on this chart is the bearish rising wedge, which has morphed and persisted for quite some time. However, we do see a very nice looking OBV that has certainly confirmed the rally from late March lows.
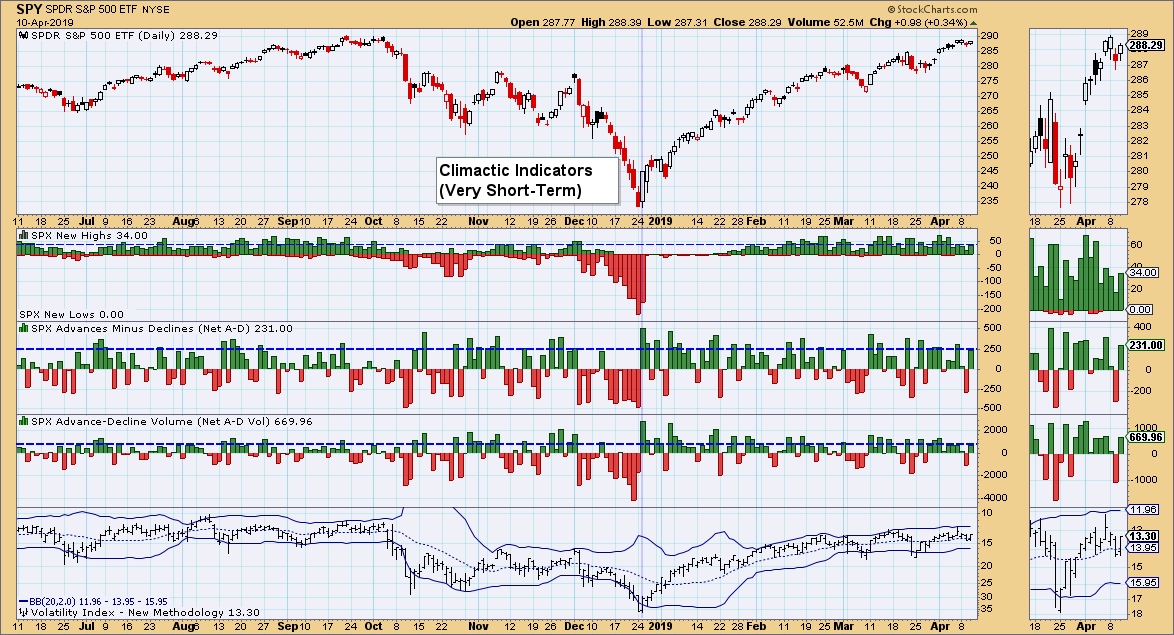
Climactic Market Indicators: Some problems underneath the surface include somewhat climactic breadth readings. We certainly saw a climax on net advances/declines yesterday that suggested a selling initiation, but already we've started to see positive breadth today. The VIX isn't helpful as it is sitting just above the middle of the Bollinger Band.
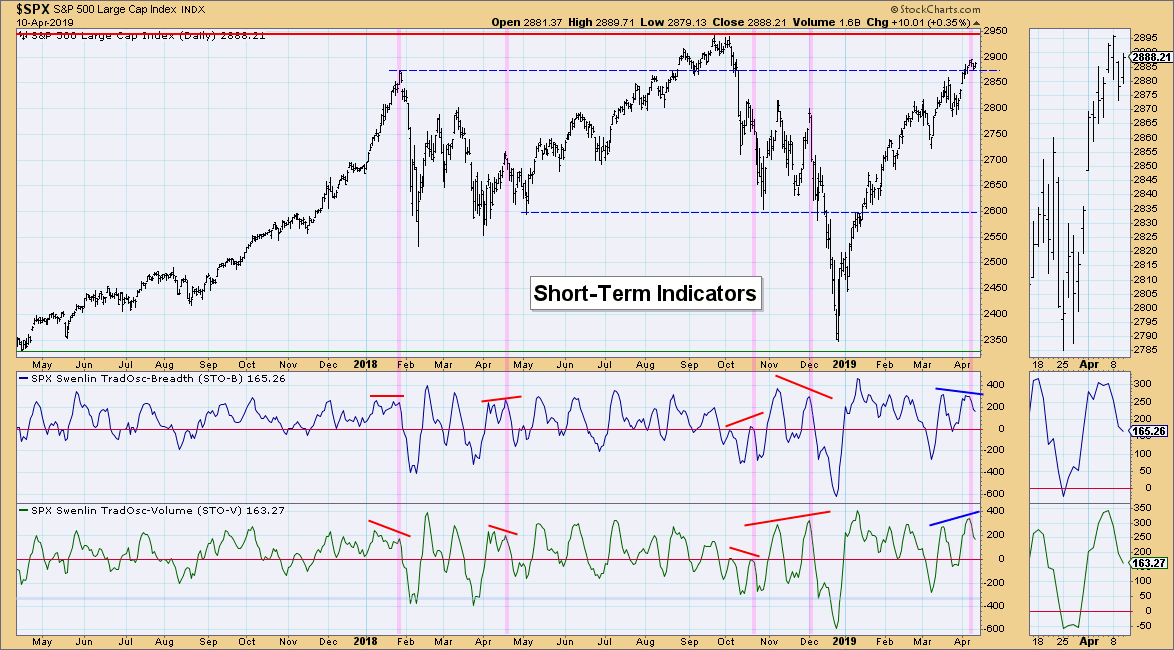
Short-Term Market Indicators: I would like to see these indicators turn back up soon. This chart concerns me. We just had a divergence between the STO-B and STO-V. While it may be hard to believe, this is probably the first time in the last ten years where distinct divergences have begun to pop up. What Carl and I have observed is that these divergences are attention flags. We are undecided as to whether they are positive or negative, as we haven't had enough of them to really confirm the meaning. What I do see is that, in general, they tend to be warning signs of lower prices.
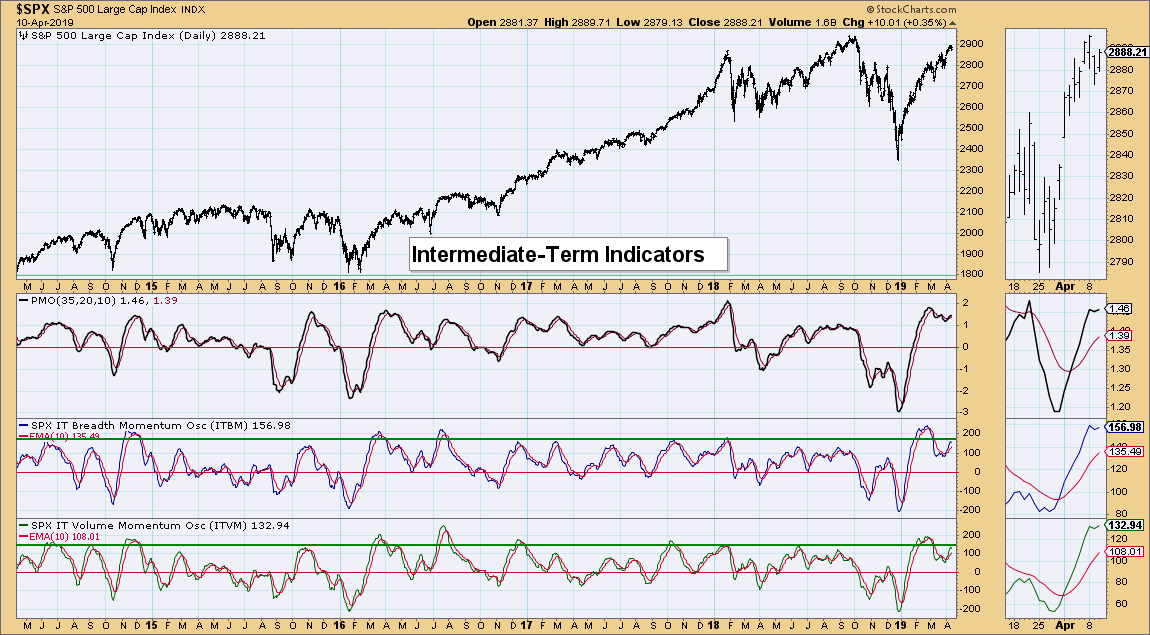
Intermediate-Term Market Indicators: These topped yesterday, but they are already rising again. I'm not convinced they will rise much further, as they are overbought and suggest the intermediate term will likely experience a pullback.
Conclusion: The market is acting bullishly and the OBV is confirming the move higher. However, there are bearish undercurrents appearing in the DecisionPoint indicators. I would be cautious and consider the validity of your current stops.
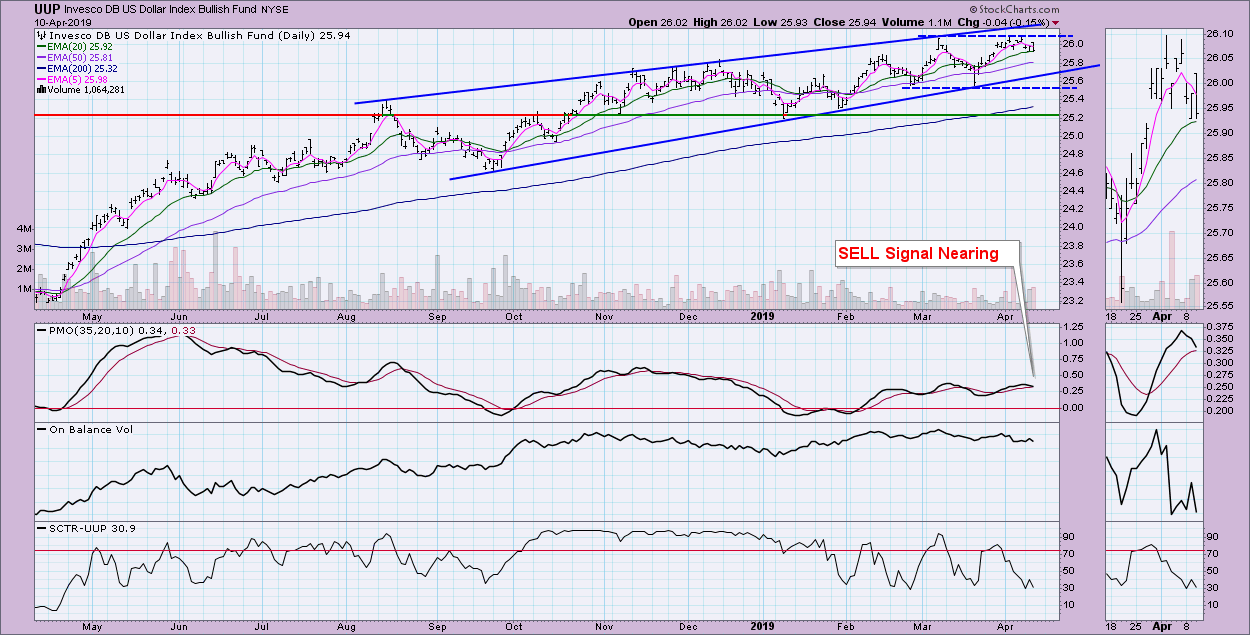
DOLLAR (UUP)
IT Trend Model: BUY as of 2/7/2019
LT Trend Model: BUY as of 5/25/2018
UUP Daily Chart: The Dollar is undeniably in a rising trend, but has been forming a longer-term bearish ascending wedge. Price wasn't able to get to the top of the wedge this time, suggesting downward pressure is winning. However, price hasn't broken below the 20-EMA and, instead of quickly dropping lower, it has bounced around sideways. The PMO is sending the message that we should expect a short-term decline to test the rising trend again.
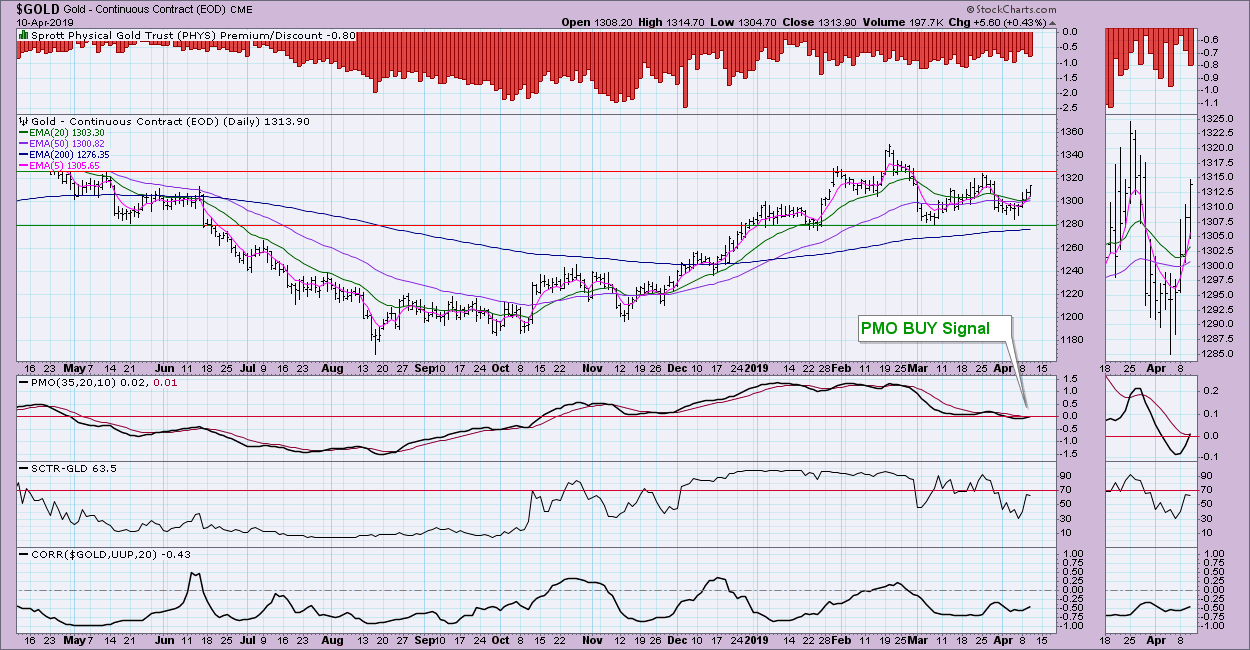
GOLD
IT Trend Model: BUY as of 10/19/2018
LT Trend Model: BUY as of 1/8/2019
GOLD Daily Chart: The Dollar is looking weak in the short term, which bodes well for Gold. The PMO just crossed above its signal line to trigger a BUY signal and the SCTR is coming back to life as well. Price seems trapped in a trading range. This new PMO BUY signal does give us hope for a breakout above last month's top; I am expecting to see it test 1330 soon.
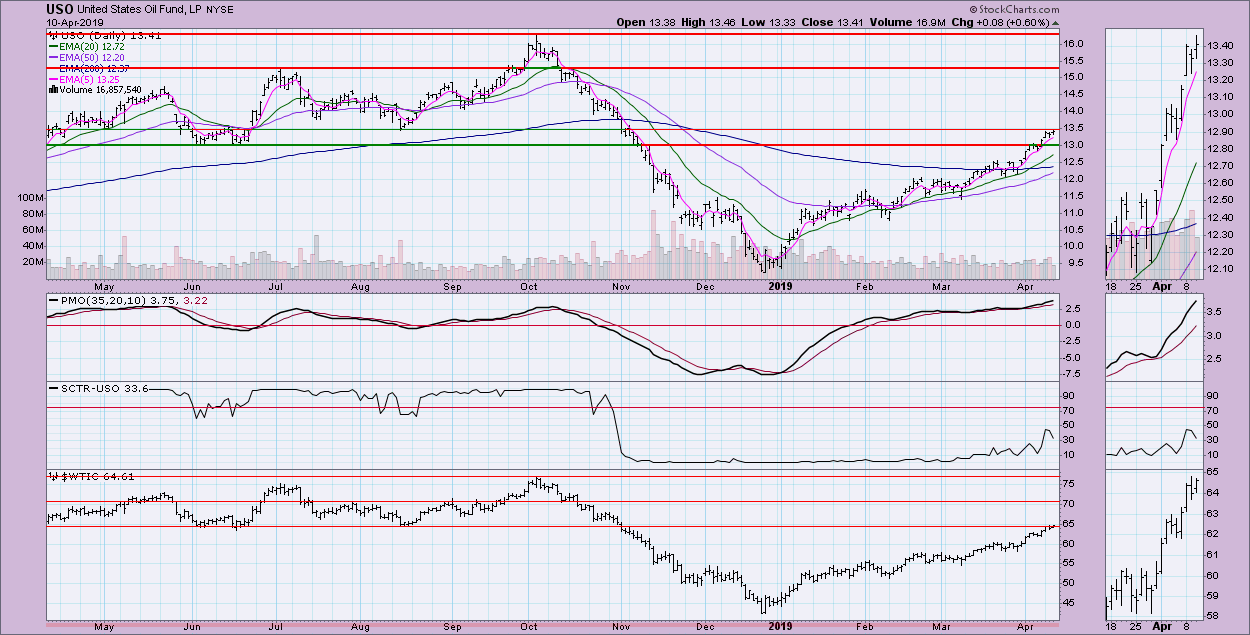
CRUDE OIL (USO)
IT Trend Model: BUY as of 2/19/2019
LT Trend Model: SELL as of 11/23/2018
USO Daily Chart: USO continues to ride higher. I don't see any negatives here except the fact that the PMO is somewhat overbought. Yet we've seen it stretch past its normal range. The 50-EMA has nearly reached the 200-EMA. A positive crossover or "golden cross" would switch USO into a "bull market" configuration. The current challenge is to push past possible resistance at the August low.
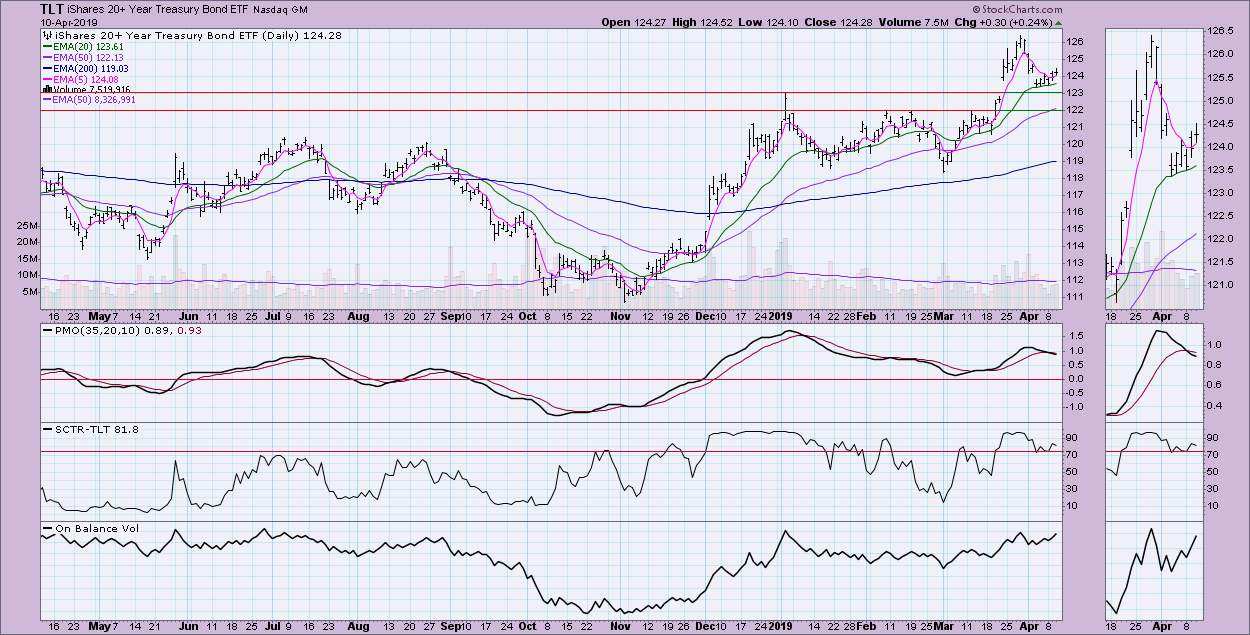
BONDS (TLT)
IT Trend Model: BUY as of 12/6/2018
LT Trend Model: BUY as of 1/2/2019
TLT Daily Chart: TLT took off in March but has seen April in decline, wiping away a sizable amount of profit on the move. The good news is that it has rallied off the 20-EMA. The gap down earlier in April suggested to me that TLT was going to have to close the March gap. Instead, it has clung to support along the 20-EMA and, despite a recent PMO SELL signal, appears ready to continue higher after closing the April gap. The SCTR is still strong and I like the positive volume coming in right now. I would actually look for a challenge of the March top before a closure of the March gap.
Technical Analysis is a windsock, not a crystal ball.
Happy Charting!
- Erin
**Don't miss any of the DecisionPoint commentaries! Go to the "Notify Me" box toward the end of this blog page to be notified as soon as they are published.**
NOTE: The signal status reported herein is based upon mechanical trading model signals, specifically the DecisionPoint Trend Model. These define the implied bias of the price index based upon moving average relationships, but they do not necessarily call for a specific action. They are information flags that should prompt chart review. Further, they do not call for continuous buying or selling during the life of the signal. For example, a BUY signal will probably (but not necessarily) return the best results if action is taken soon after the signal is generated. Additional opportunities for buying may be found as price zigzags higher, but the trader must look for optimum entry points. Conversely, exit points to preserve gains (or minimize losses) may be evident before the model mechanically closes the signal.
Helpful DecisionPoint Links:
DecisionPoint Shared ChartList and DecisionPoint Chart Gallery
Price Momentum Oscillator (PMO)
Swenlin Trading Oscillators (STO-B and STO-V)
