Since the market gapped up on the first of April, it has been quietly moving higher, making marginal new, all-time highs. Volume has been a bit thin, particularly for SPY. I think that thin volume is a reflection of the low volatility, and of investors happy to sit quietly, not seeing any need to change their position. What's causing this? The only thing I can see is Easter week and the Fed meeting next week. The Fed announcement will be on Wednesday.
The DecisionPoint Weekly Wrap presents an end-of-week assessment of the trend and condition of the stock market (S&P 500), the U.S. Dollar, Gold, Crude Oil, and Bonds.
Watch the latest episode of DecisionPoint on StockCharts TV's YouTube channel here!
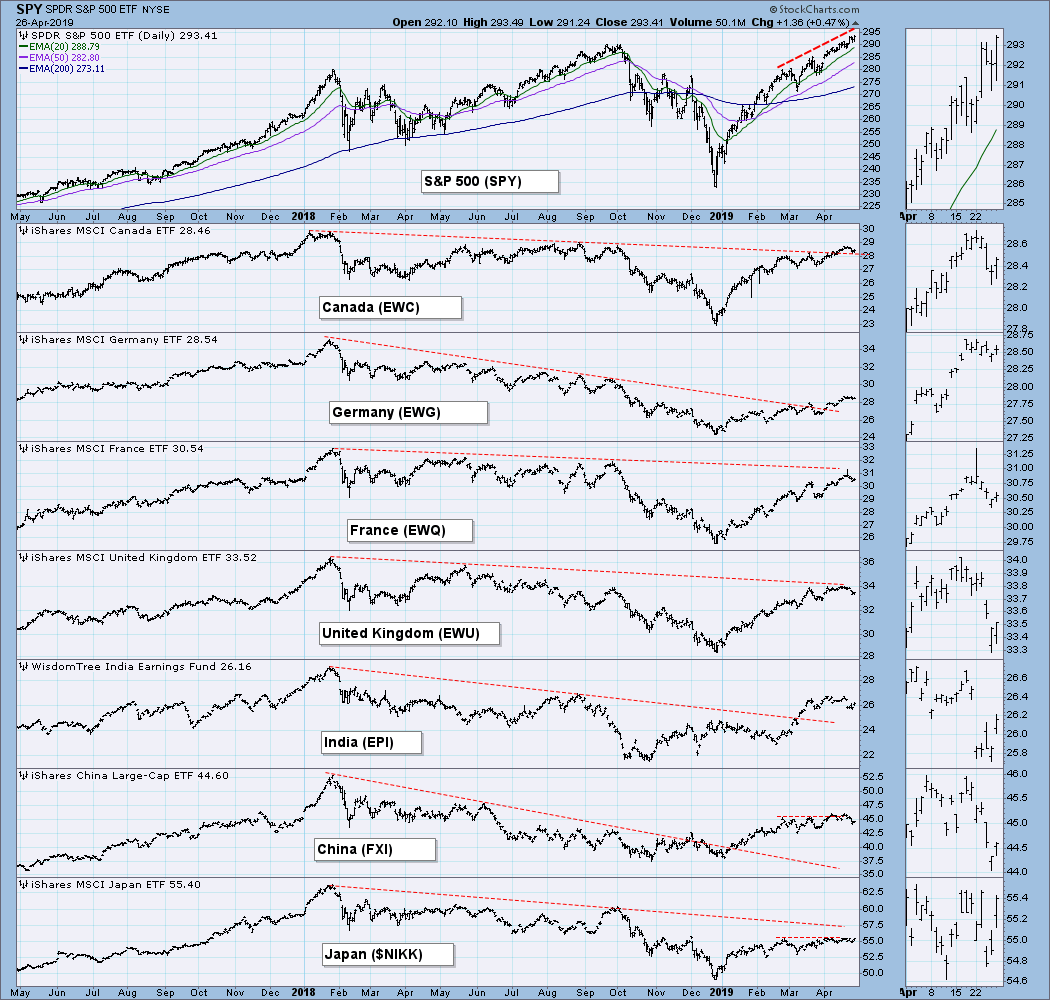
GLOBAL MARKETS
Still lagging the S&P 500.
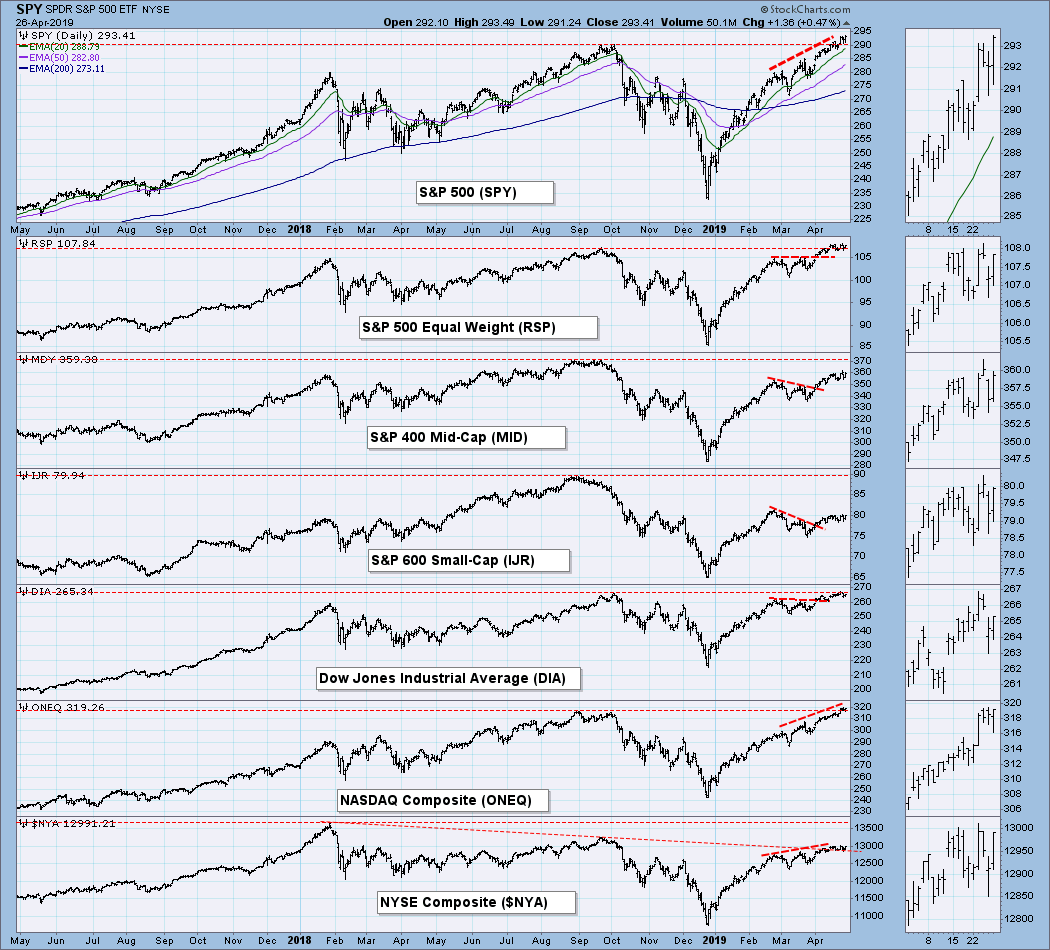
BROAD MARKET INDEXES
Small- and mid-cap stocks still lagging the large-cap indexes.
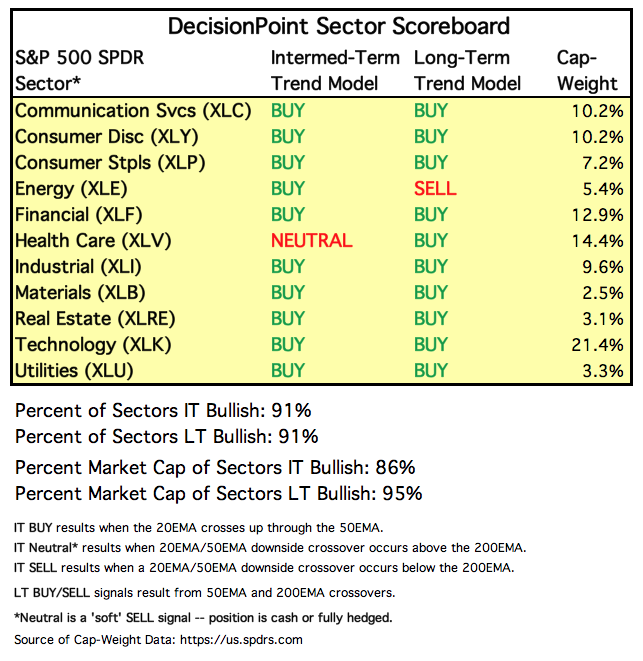
SECTORS
Each S&P 500 Index component stock is assigned to one, and only one, of 11 major sectors. This is a snapshot of the Intermediate-Term and Long-Term Trend Model signal status for those sectors.
STOCKS
IT Trend Model: BUY as of 2/1/2019
LT Trend Model: BUY as of 2/26/2019
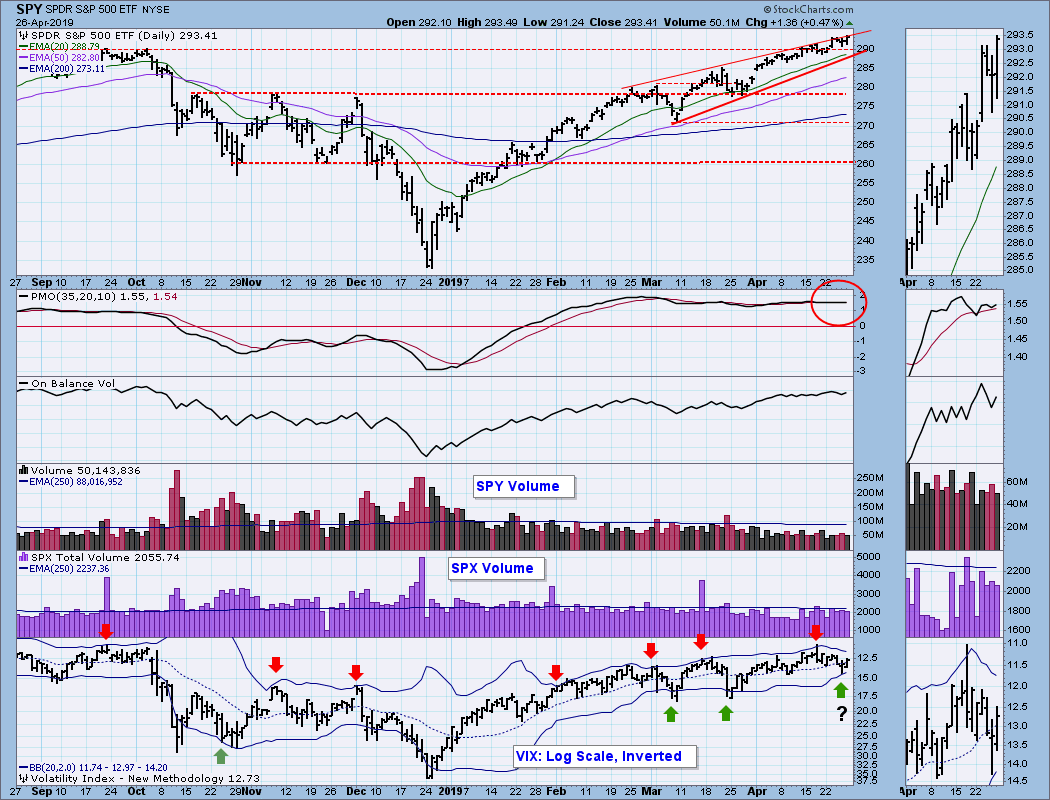
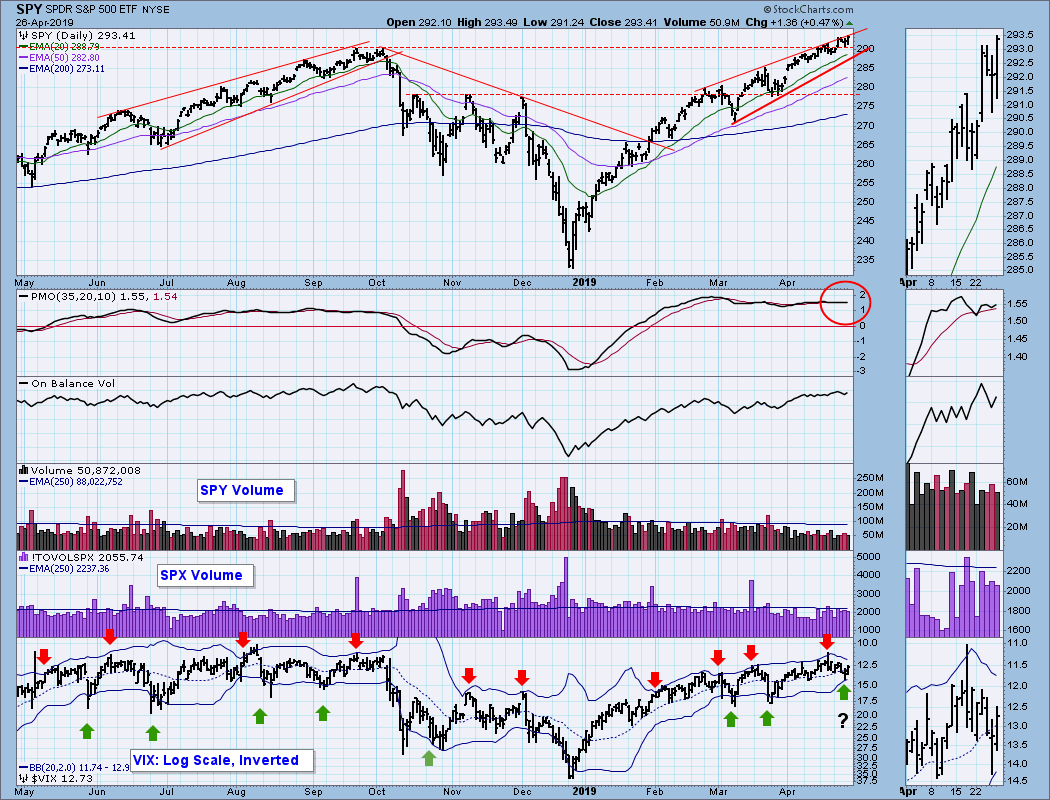
SPY Daily Chart: The VIX almost touched the lower Bollinger Band (close enough), and the expected price reversal arrived the next day with the market making new, all-time highs. Next week I'd expect the VIX to touch the top B-Band, possibly signalling a downturn. The daily PMO has been positive and super flat for two months, a reflection of steady upward pressure.
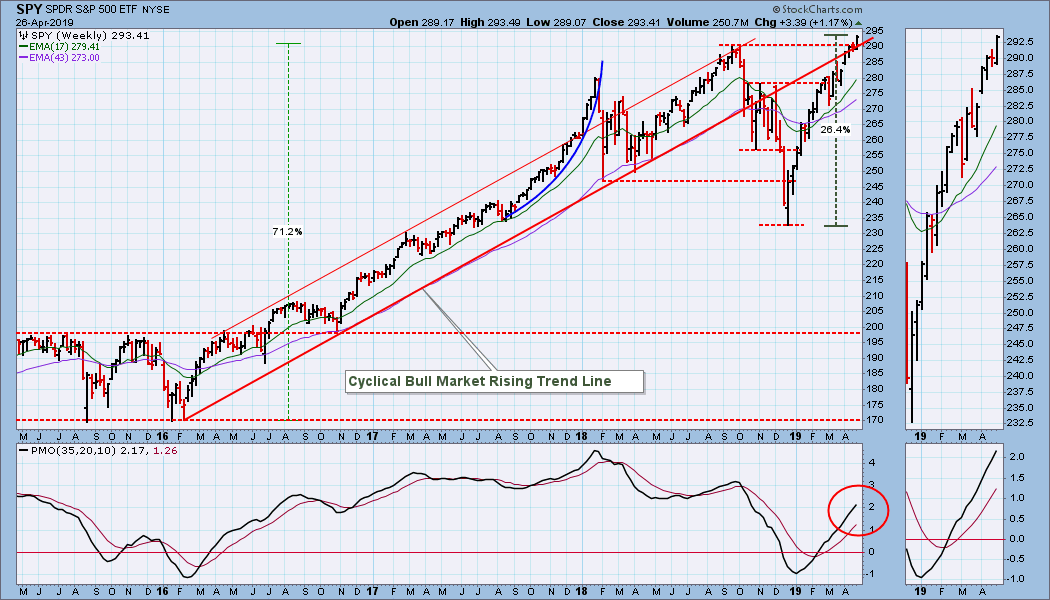
SPY Weekly Chart: Price has recaptured the cyclical bull market rising trend line. The weekly PMO is overbought, but it could still go higher, based upon the four-year range.
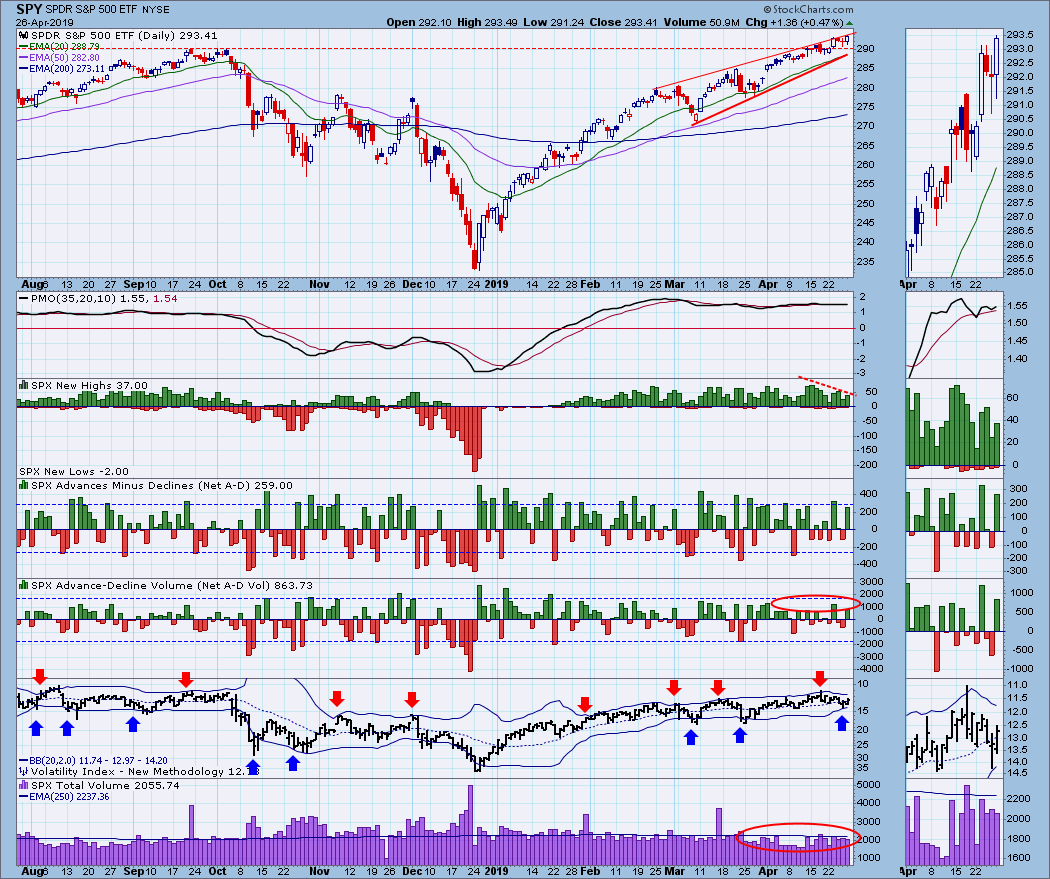
Climactic Market Indicators: New highs have been fading for the last two weeks, and volume has been thin.
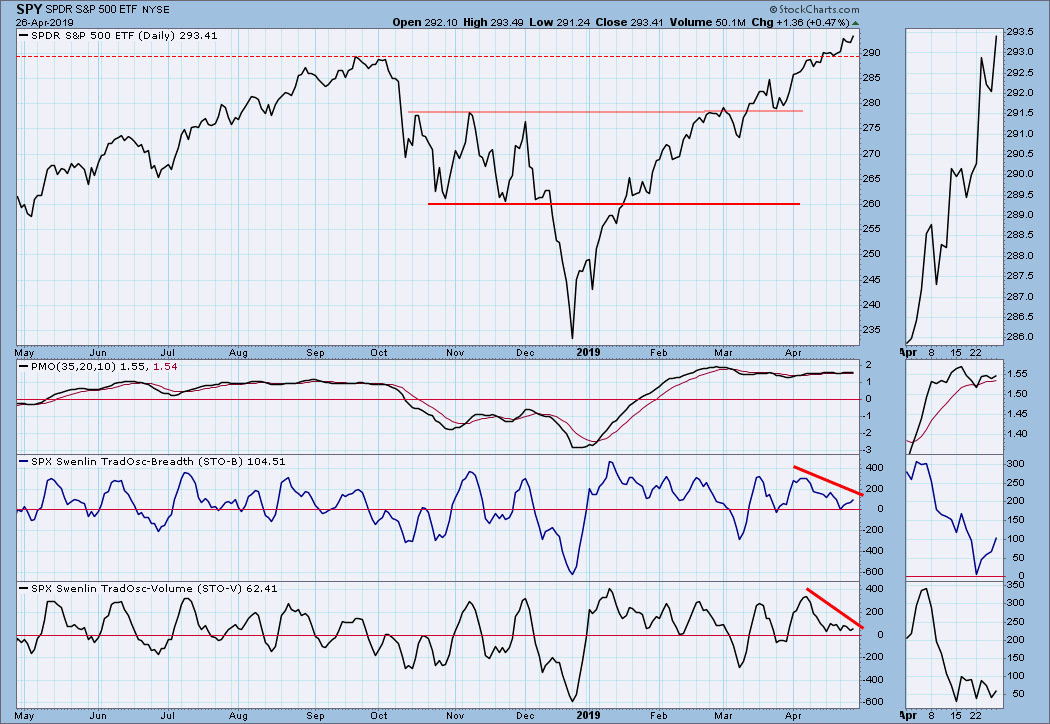
Short-Term Market Indicators: Note how the STO-B and STO-V have diverged against price this month.
Intermediate-Term Market Indicators: While the BPI (bottom panel) confirmed the price highs two weeks ago, since then it has pulled back. The other indicators have been diverging negatively since their February tops.
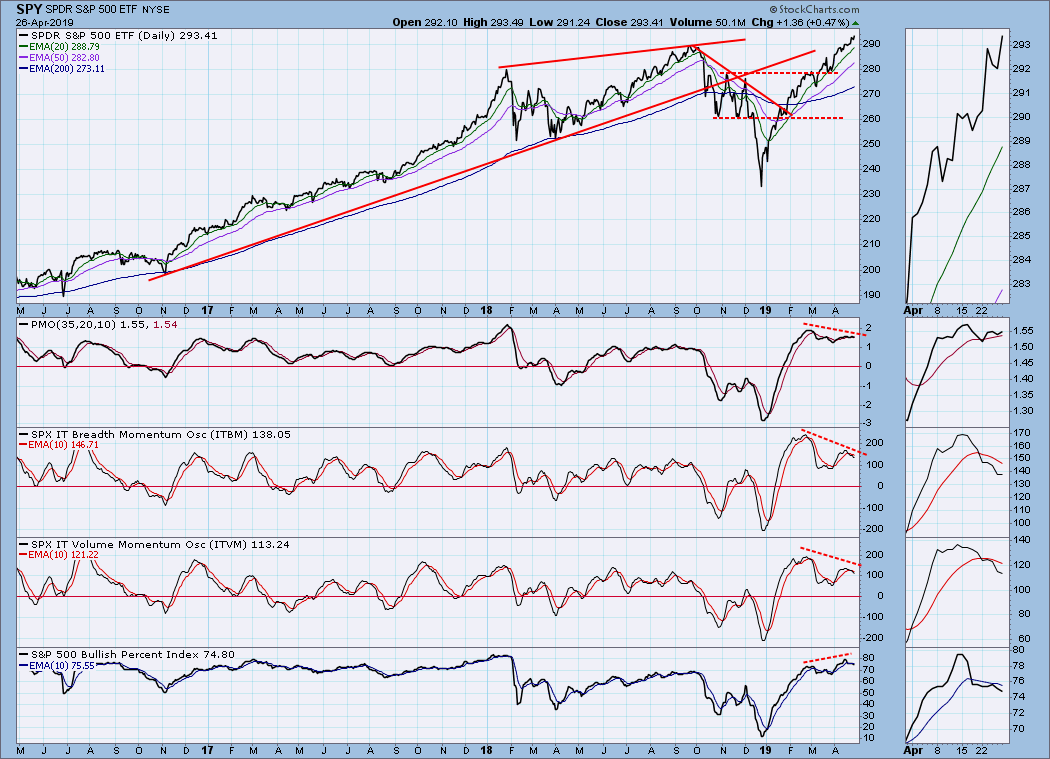
CONCLUSION: The chart immediately above best illustrates my negative outlook. Price is going higher, while indicators diverge -- since the February top and the top two weeks ago. I still expect some corrective action to make a very accelerated up trend adjust to an angle that is not so steep.
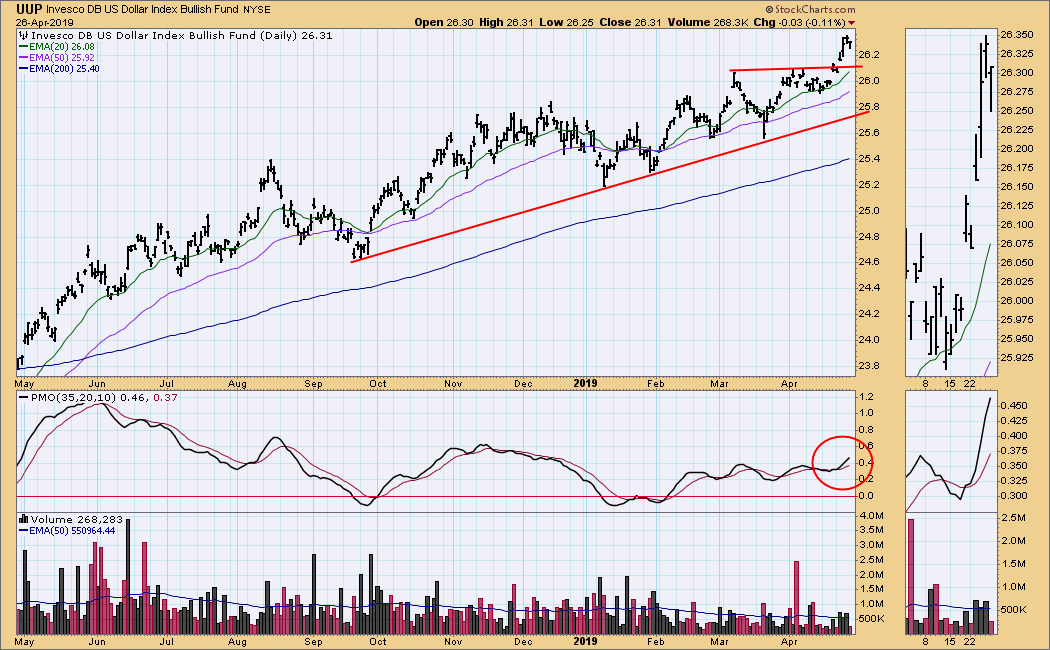
DOLLAR (UUP)
IT Trend Model: BUY as of 2/7/2019
LT Trend Model: BUY as of 5/25/2018
UUP Daily Chart: Price broke out of a very loose rising wedge this week.
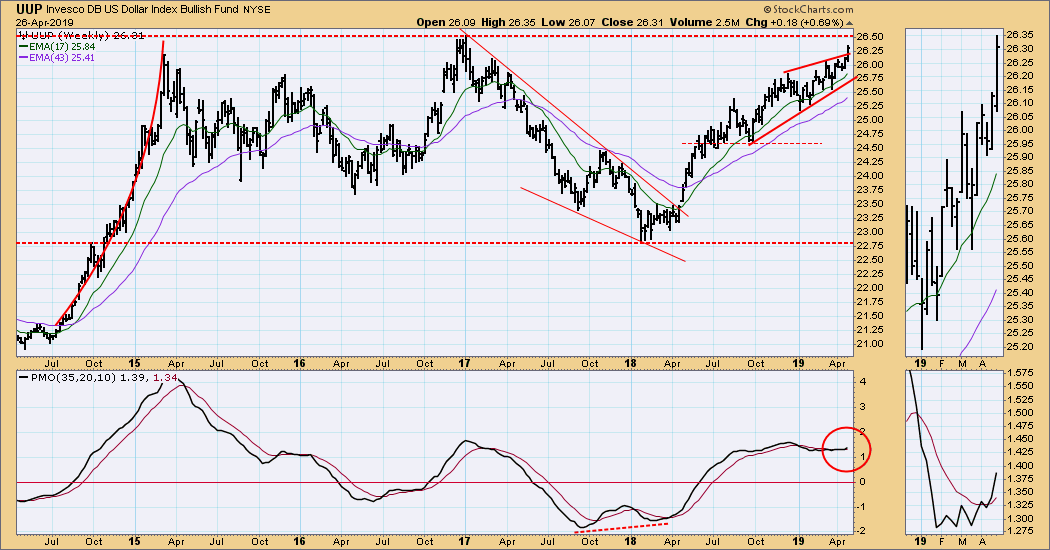
UUP Weekly Chart: The weekly chart provides a better context for the breakout on the daily chart, as we can see long-term overhead resistance dead ahead. The thumbnail magnification shows that the weekly PMO is above the signal line and rising, but without the magnification the PMO is flat. I should mention that the resistance line goes all the way back to 2008.
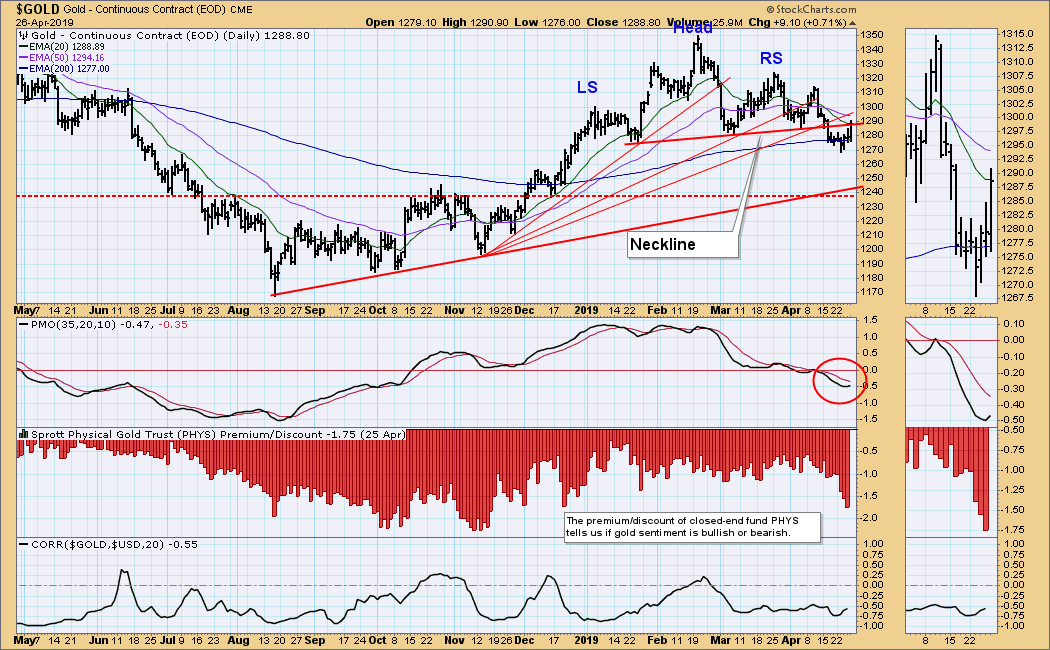
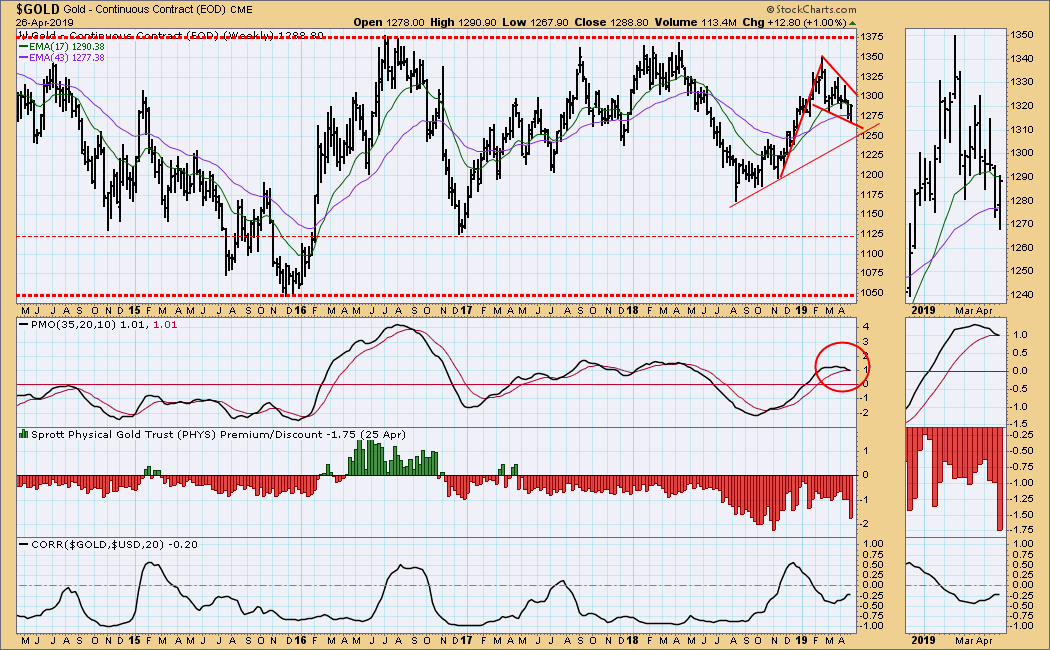
GOLD
IT Trend Model: NEUTRAL as of 4/16/2019
LT Trend Model: BUY as of 1/8/2019
GOLD Daily Chart: Gold has broken down through the head and shoulders neckline, which implies a minimum downside target of about 1210; however, price has recaptured the neckline, and the daily PMO has turned up.
GOLD Weekly Chart: The weekly PMO has almost crossed down through the signal line, but there is a flag formation to inject some bullishness into the picture.
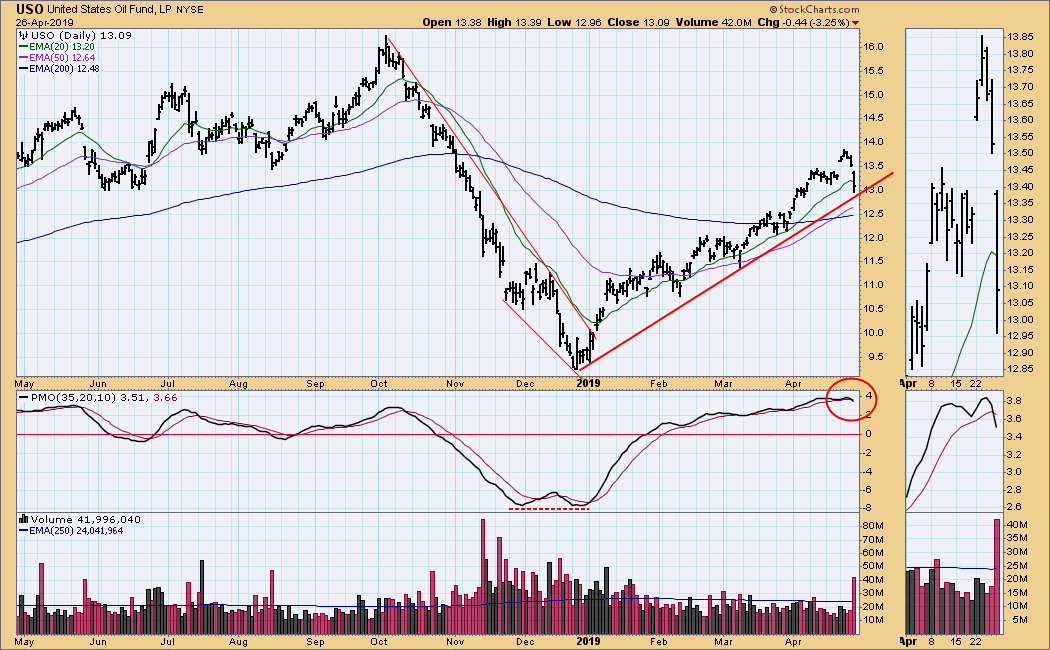
CRUDE OIL (USO)
IT Trend Model: BUY as of 2/19/2019
LT Trend Model: BUY as of 4/17/2019
USO Daily Chart: On Monday the Trump administration announced tighter sanctions against Iran, and crude oil gapped up about +2%. From there it consolidated a few days, then it crashed on Friday. Because of the lack of follow through after Monday's gap, I was not surprised to see the breakdown. My guess is that crude is not in as short supply as we are led to believe. The daily PMO has crossed down through its signal line from very overbought levels.
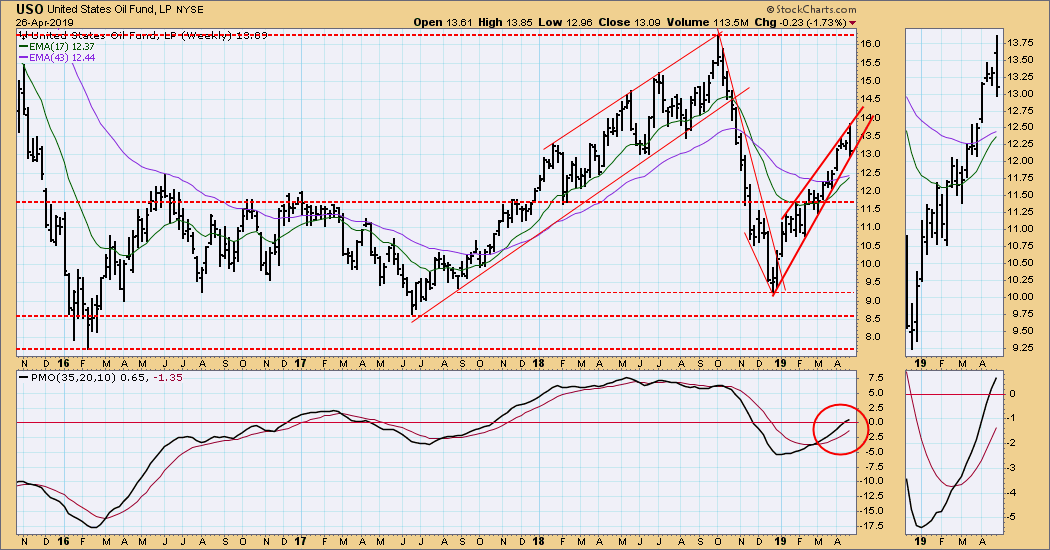
USO Weekly Chart: A rising wedge pattern implies that a pullback could be on the way, but the weekly PMO is rising and above the zero line. The 2018 high for USO represents about $76 for $WTIC.
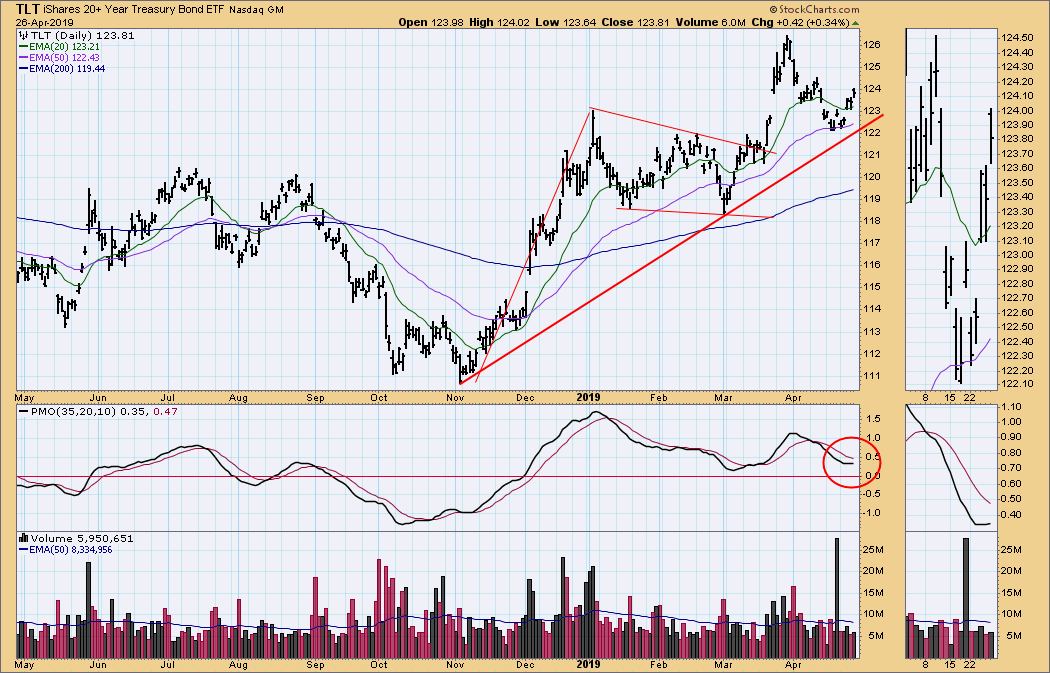
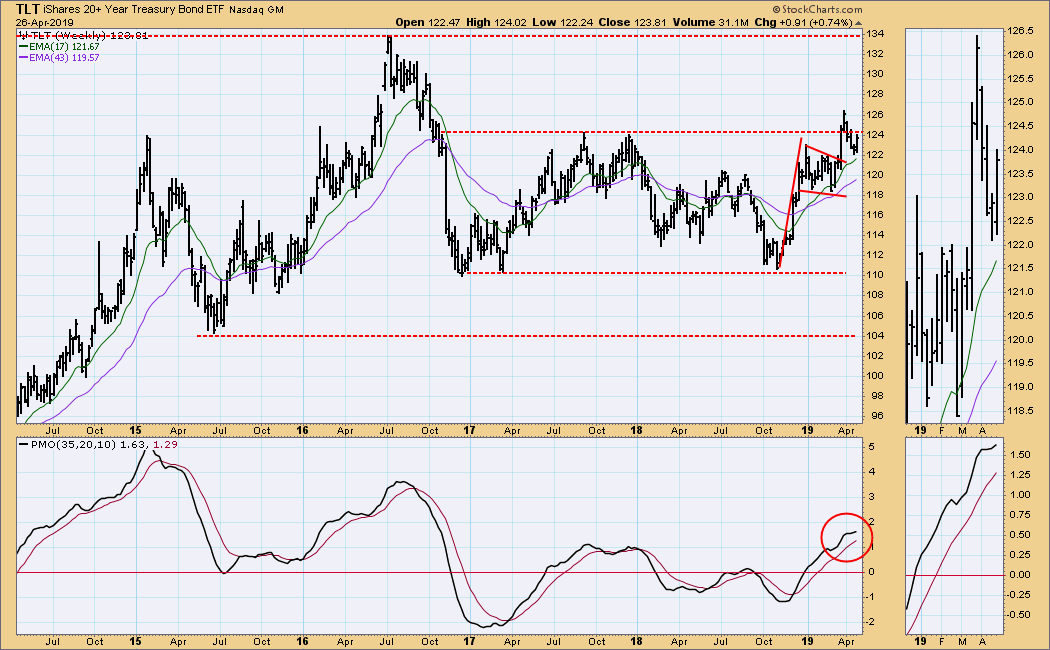
BONDS (TLT)
IT Trend Model: BUY as of 12/6/2018
LT Trend Model: BUY as of 1/2/2019
TLT Daily Chart: Price has been very 'gappy' in the last six weeks, first showing unusual strength, then reciprocal weakness. TLT seems to have entered another wave of strengt, and the daily PMO is rising again.
TLT Weekly Chart: Price broke out of a flag formation and penetrated long-term overhead resistance as if it were not even there. Then a massive pullback toward the point of breakout followed. This week a strong advance almost reached the resistance line. We shall see if the resistance will continue to be ignored. The weekly PMO is a bit overbought, but it is well below the top of the five-year range.
**Don't miss any of the DecisionPoint commentaries! Go to the "Notify Me" box toward the end of this blog page to be notified as soon as they are published.**
Technical Analysis is a windsock, not a crystal ball.
Happy Charting!
- Carl
NOTE: The signal status reported herein is based upon mechanical trading model signals, specifically, the DecisionPoint Trend Model. They define the implied bias of the price index based upon moving average relationships, but they do not necessarily call for a specific action. They are information flags that should prompt chart review. Further, they do not call for continuous buying or selling during the life of the signal. For example, a BUY signal will probably (but not necessarily) return the best results if action is taken soon after the signal is generated. Additional opportunities for buying may be found as price zigzags higher, but the trader must look for optimum entry points. Conversely, exit points to preserve gains (or minimize losses) may be evident before the model mechanically closes the signal.
Helpful DecisionPoint Links:
DecisionPoint Shared ChartList and DecisionPoint Chart Gallery
Price Momentum Oscillator (PMO)
Swenlin Trading Oscillators (STO-B and STO-V)
