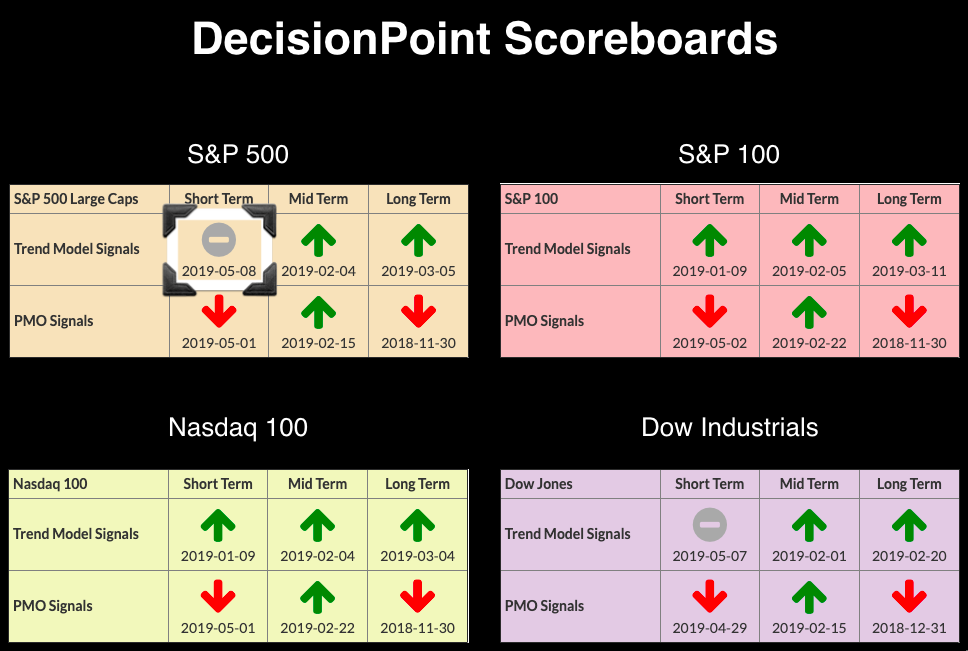
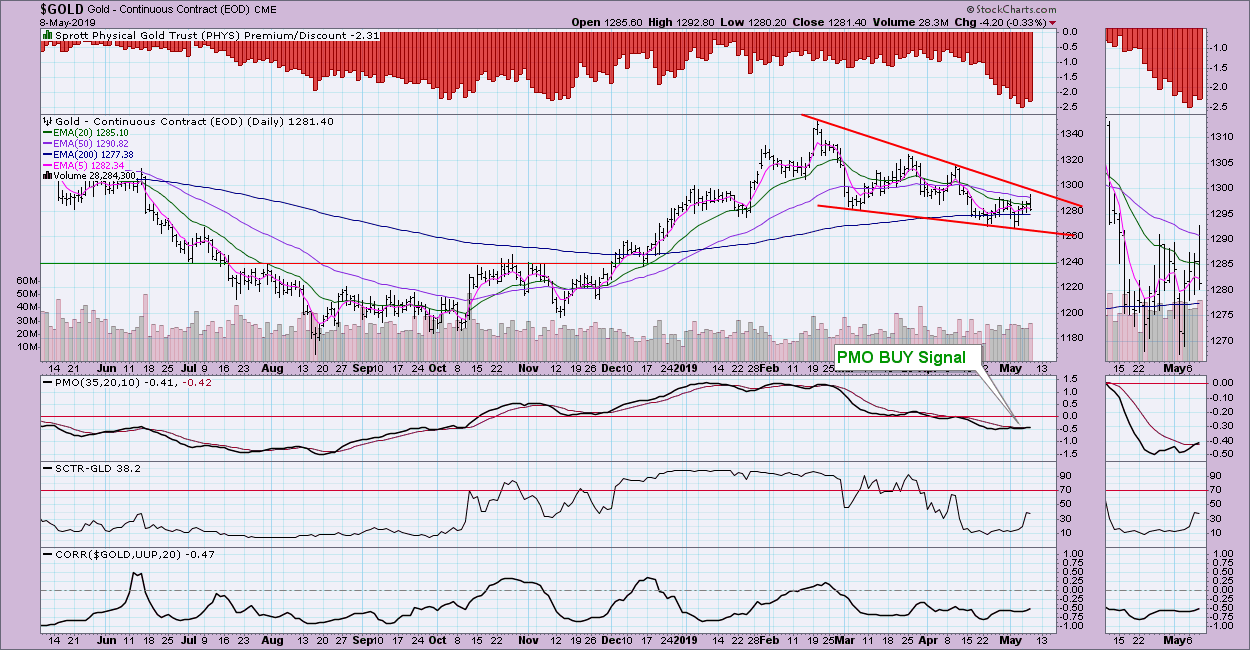
 The Dow Industrials generated a ST Trend Model Neutral signal yesterday. Now, the SPX joins in with its own STTM Neutral signal. XLE triggered a new IT Trend Model SELL signal, the first to appear on the DecisionPoint Sector Scoreboard in some time. Gold may be forming a bullish declining wedge. I can still make a case for a bearish head-and-shoulders, but price has been reluctant to execute it cleanly.
The DecisionPoint Alert presents a mid-week assessment of the trend and condition of the stock market (S&P 500), the U.S. Dollar, Gold, Crude Oil and Bonds.
Watch the latest episode of DecisionPoint on StockCharts TV's YouTube channel here!
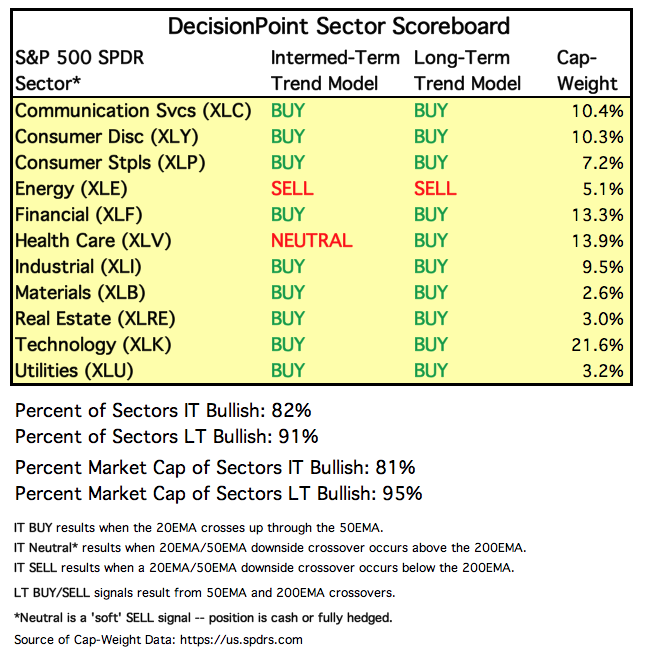
SECTORS
Each S&P 500 Index component stock is assigned to one, and only one, of eleven major sectors. This is a snapshot of the Intermediate-Term and Long-Term Trend Model signal status for those sectors.
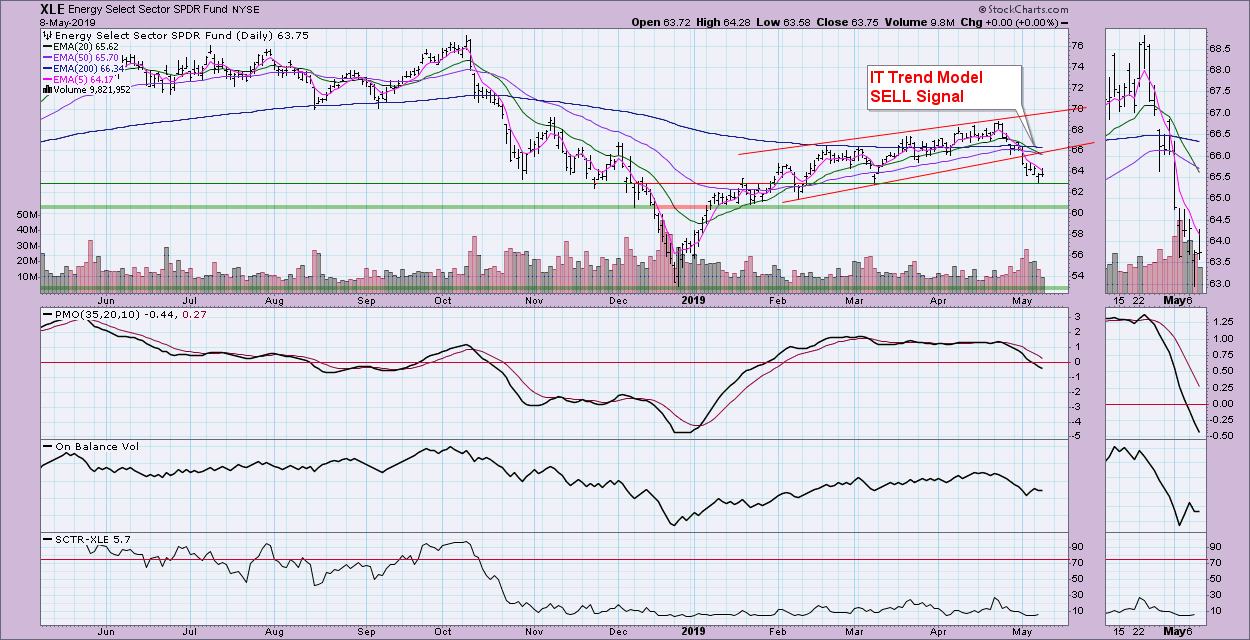
The bearish rising wedge has now executed on XLE. The 20-EMA dropped below the 50-EMA while both were below the 200-EMA. Support may have been found at the March low, but none of the indicators are bullish. The EMAs are now configured as negatively as they can be (5-EMA < 20-EMA < 50-EMA < 200-EMA). Maybe XLE can find support around $60.
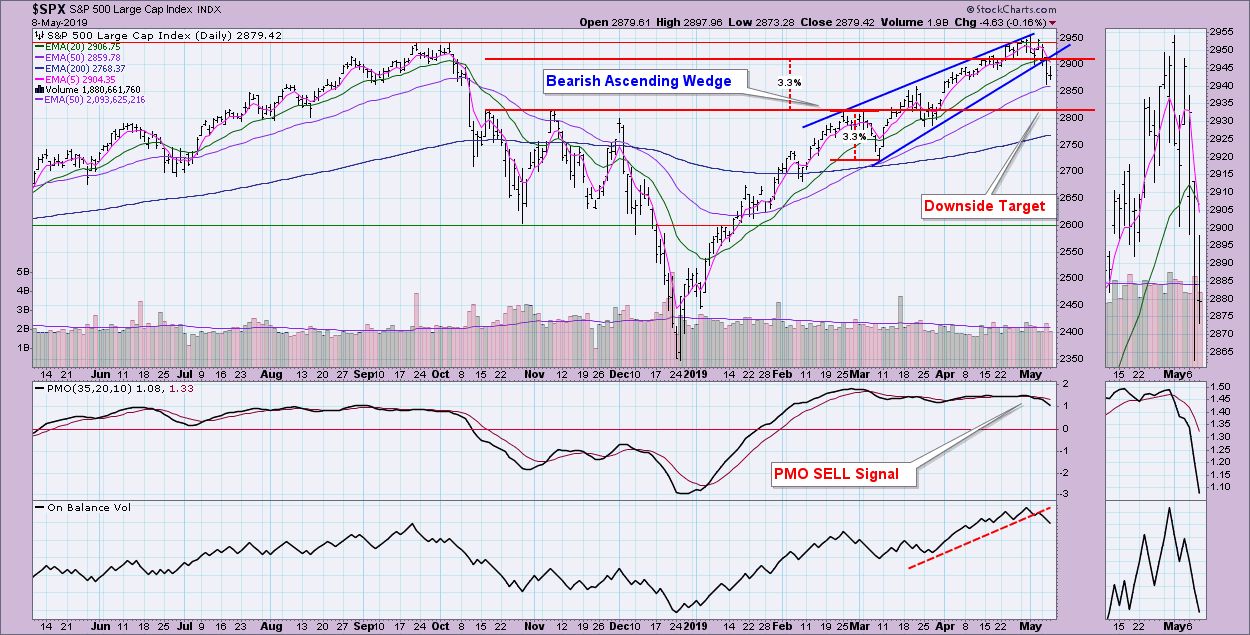
STOCKS
IT Trend Model: BUY as of 2/1/2019
LT Trend Model: BUY (SPY) as of 2/26/2019
SPY Daily Chart: You can see that the 5-EMA crossed below the 20-EMA, triggering the STTM Neutral signal. It would have been a SELL signal had the crossover occurred BELOW the 50-EMA. We've all been watching this wedge for weeks and today we finally saw the pattern execute. The minimum downside target of the rising wedge is calculated by measuring the back of the pattern and measuring that distance from the point of the breakdown. The target would bring price down to the October/November tops. The PMO and OBV both suggest that the target will be reached before the rally returns.
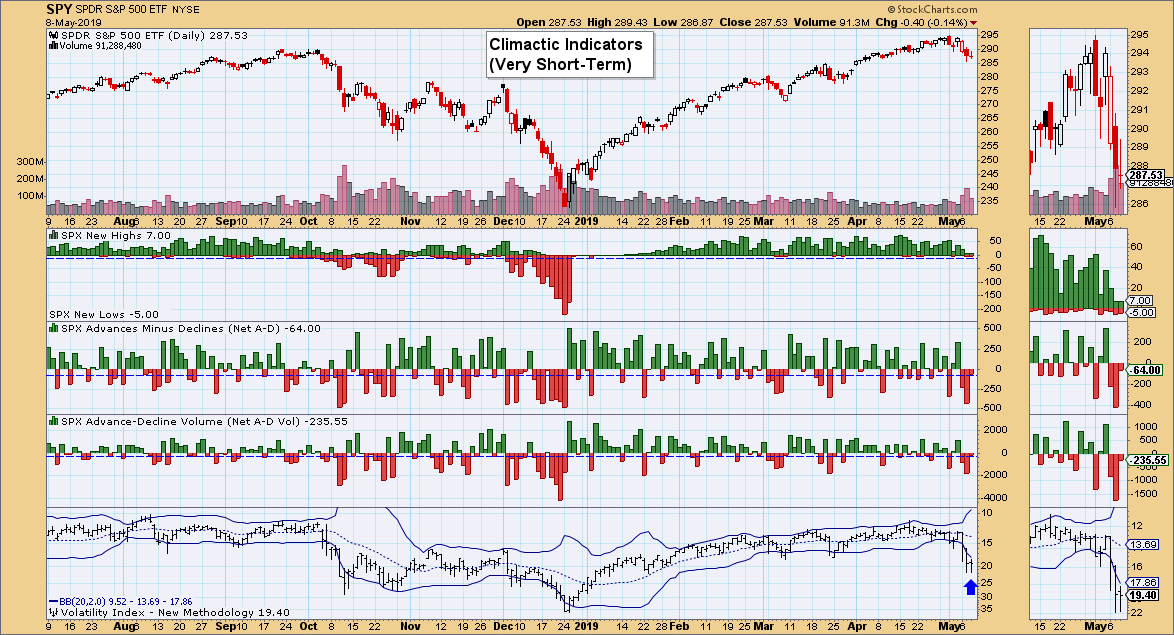
Climactic Market Indicators: The VIX Bollinger Band is expanding, yet the readings are still well below the lower band. When the bands begin to widen, volatility is strengthening. This is not a safe trading environment and, despite the visibility of these punctures, they aren't accompanied by any breadth to suggest this decline is over.
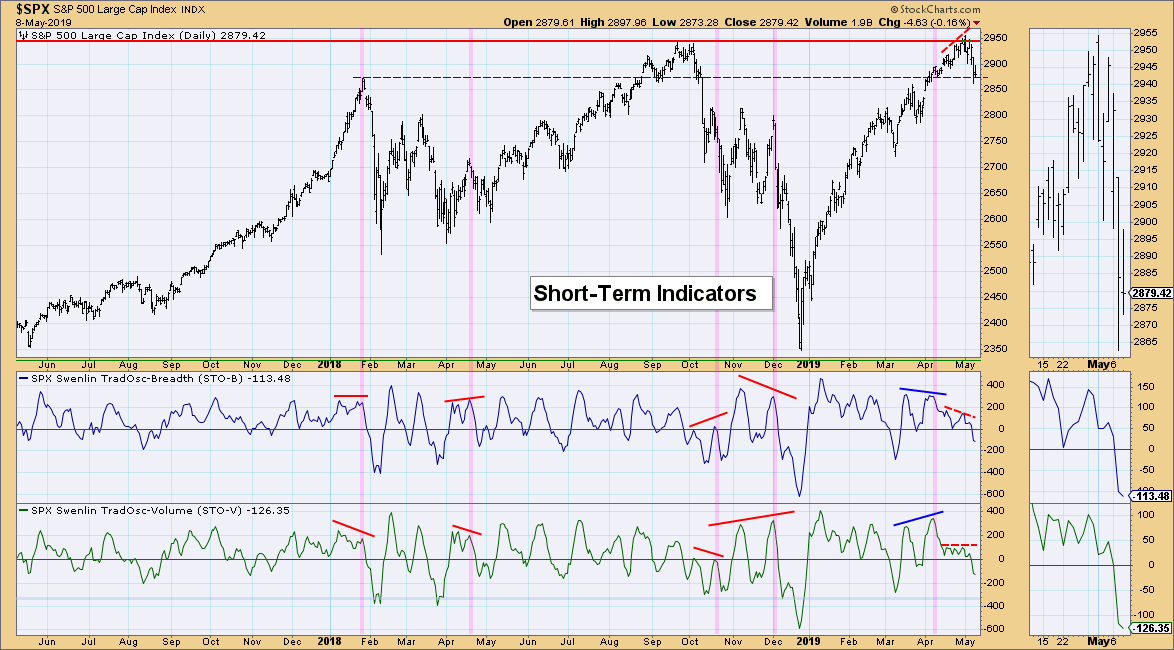
Short-Term Market Indicators: These are beginning to decelerate slightly, but have both reached negative territory. This has been considered oversold territory based on the typical range in a bull market. They remain bearish until I see them really begin to bottom.
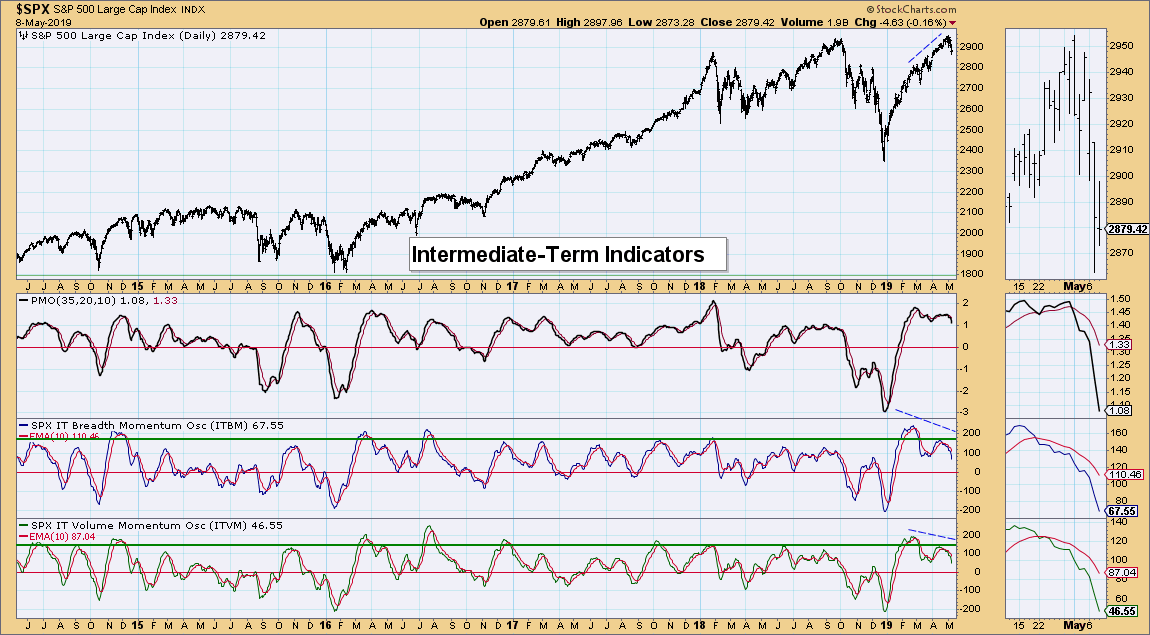
Intermediate-Term Market Indicators: Nothing good here. Very bearish and definitely not oversold.
Conclusion: I would've liked to have seen some climactic breadth numbers to accompany today's spike in the VIX, but we don't always get what we want. For this reason, along with the fact that DP indicators continue to decline, I am looking for a bit more follow-through on the recent decline.
DOLLAR (UUP)
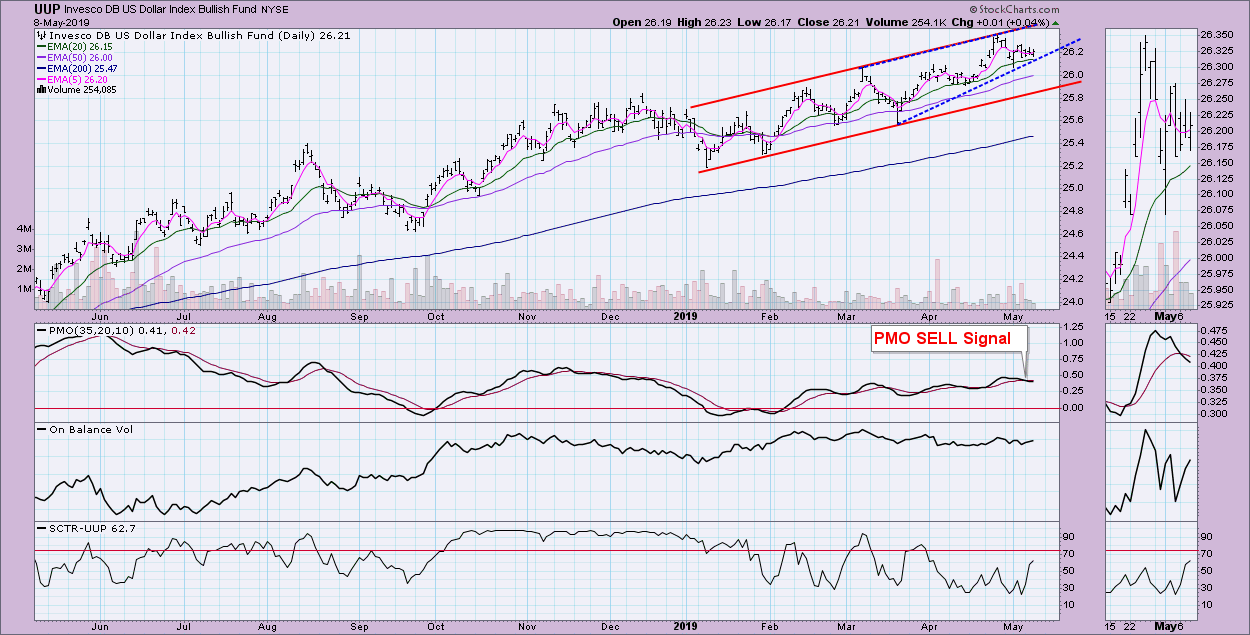
IT Trend Model: BUY as of 2/7/2019
LT Trend Model: BUY as of 5/25/2018
UUP Daily Chart: UUP remains in a rising trend channel, weaving its way higher. The last two major bottoms didn't have to reach the bottom of the channel, which I generally consider bullish. However, the recent PMO SELL signal worries me. The 20-EMA is still holding up as support, as are the March/April tops. However, if you look at a shorter-term pattern (annotated in blue), that's a bearish rising wedge. I suspect UUP will need to make a trip down and test the bottom of the trend channel.
GOLD
IT Trend Model: Neutral as of 4/16/2019
LT Trend Model: BUY as of 1/8/2019
GOLD Daily Chart: I've decided to abandon the head-and-shoulders pattern (left shoulder = Jan top, head = Feb top, right shoulder = March top) mainly because it was not really executing as it should. When I took a fresh look at the chart, I noted a bullish declining wedge. That is coupled with a new PMO BUY signal and very bullish sentiment as discounts are making annual highs. I think it may finally be time for Gold to break out.
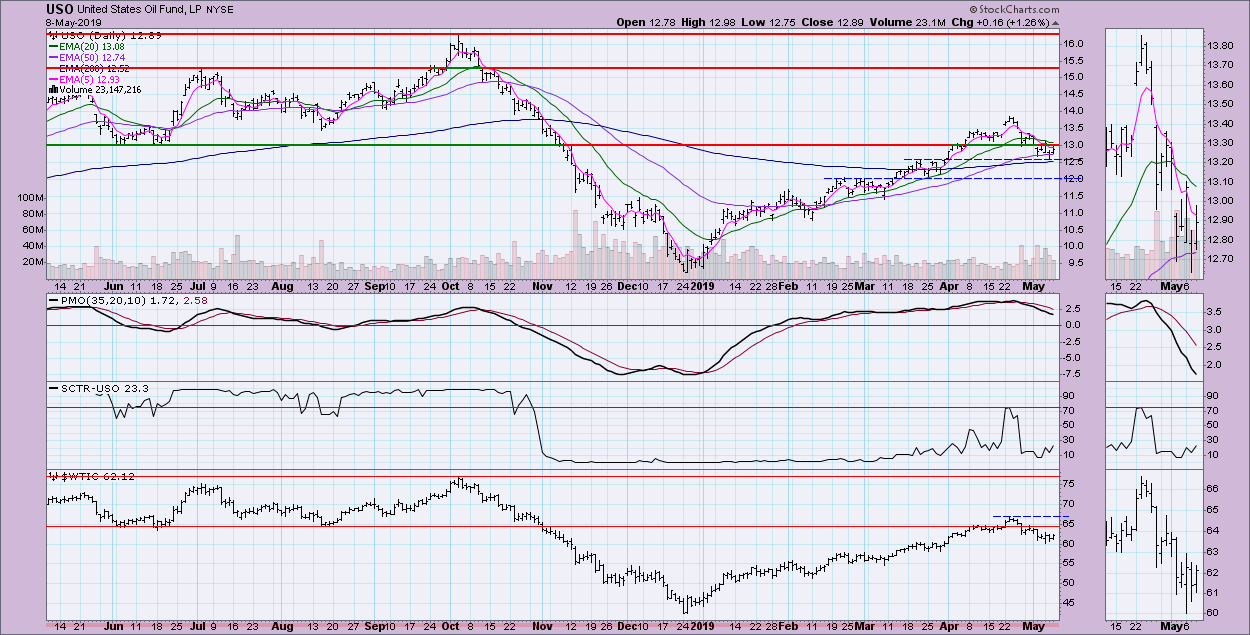
CRUDE OIL (USO)
IT Trend Model: BUY as of 2/19/2019
LT Trend Model: SELL as of 11/23/2018
USO Daily Chart: A very short-term support line drawn from the March top held on the last price drop. However, I'm not convinced that this will hold. The PMO is not showing signs of deceleration; if it does manage to cling to the 50-EMA, we could see more sideways movement as the PMO clears overbought territory. If not, I would look at $12 as next area of support, as that lines up with the February top and minor lows in March.
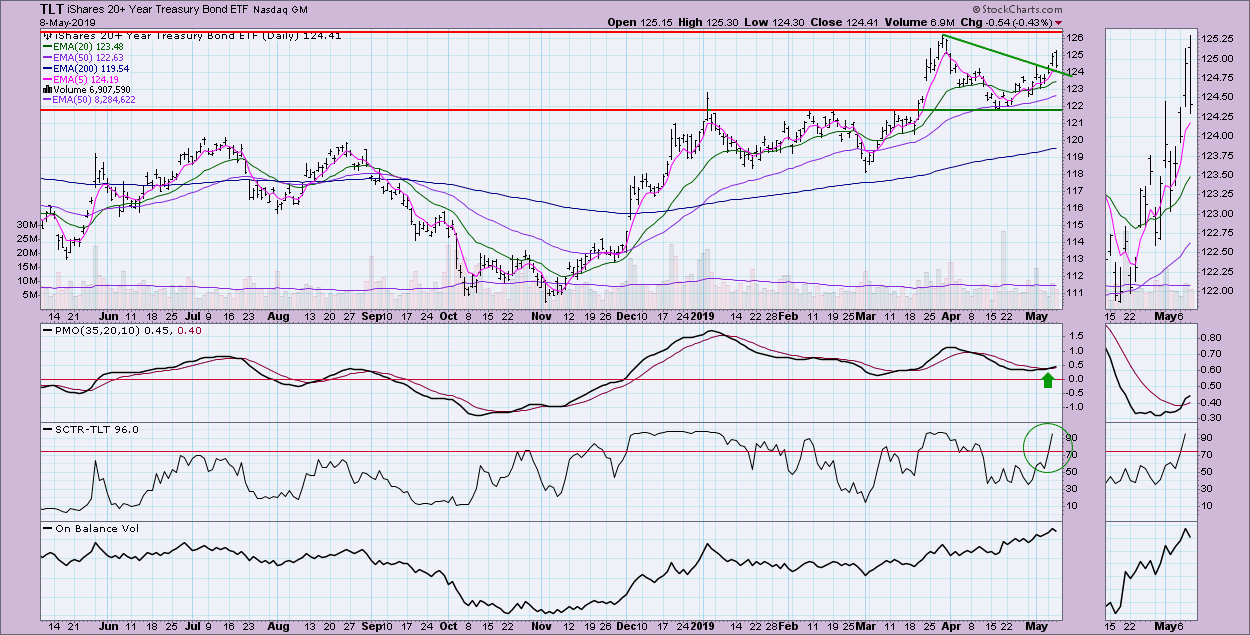
BONDS (TLT)
IT Trend Model: BUY as of 12/6/2018
LT Trend Model: BUY as of 1/2/2019
TLT Daily Chart: Price broke out above the declining tops trend line. The PMO has logged a BUY signal and the SCTR has popped quickly back into the "hot zone." OBV is rising along with price lows. I am looking for a test of overhead resistance at the March top.
Technical Analysis is a windsock, not a crystal ball.
Happy Charting!
- Erin
erinh@stockcharts.com
**Don't miss any of the DecisionPoint commentaries! Go to the "Notify Me" box toward the end of this blog page to be notified as soon as they are published.**
NOTE: The signal status reported herein is based upon mechanical trading model signals, specifically, the DecisionPoint Trend Model. They define the implied bias of the price index based upon moving average relationships, but they do not necessarily call for a specific action. They are information flags that should prompt chart review. Further, they do not call for continuous buying or selling during the life of the signal. For example, a BUY signal will probably (but not necessarily) return the best results if action is taken soon after the signal is generated. Additional opportunities for buying may be found as price zigzags higher, but the trader must look for optimum entry points. Conversely, exit points to preserve gains (or minimize losses) may be evident before the model mechanically closes the signal.
Helpful DecisionPoint Links:
DecisionPoint Shared ChartList and DecisionPoint Chart Gallery
Price Momentum Oscillator (PMO)
Swenlin Trading Oscillators (STO-B and STO-V)
