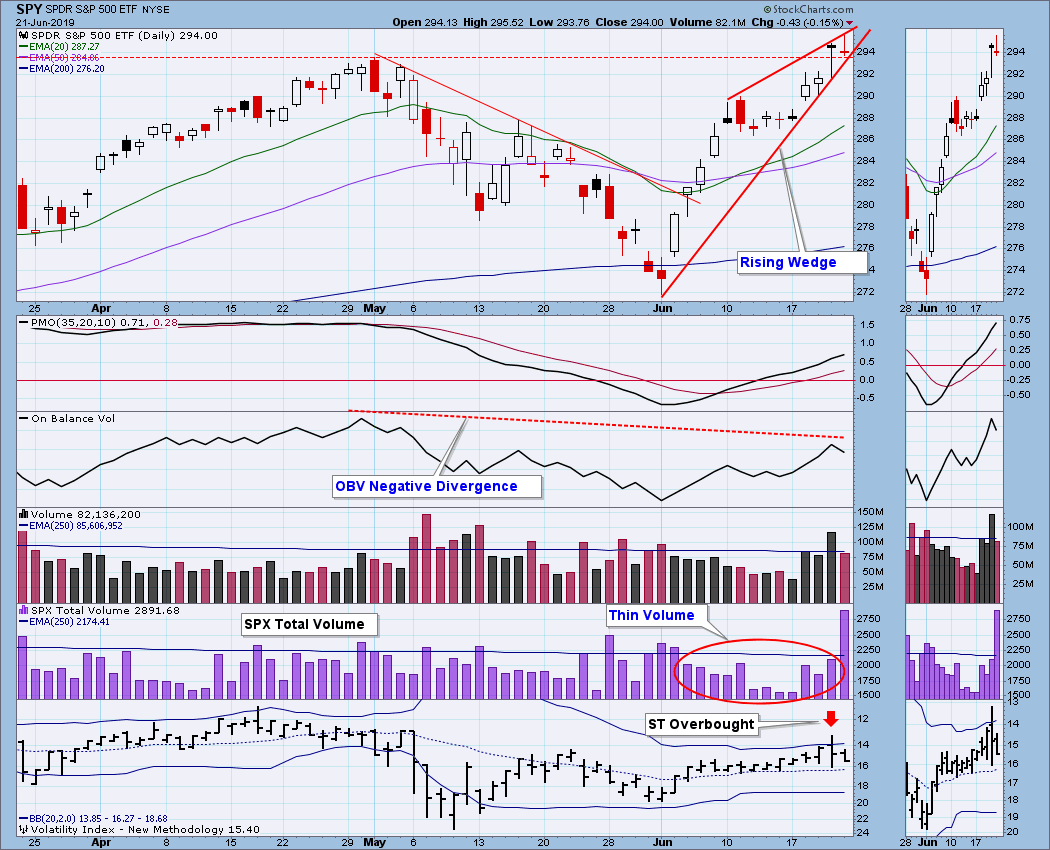
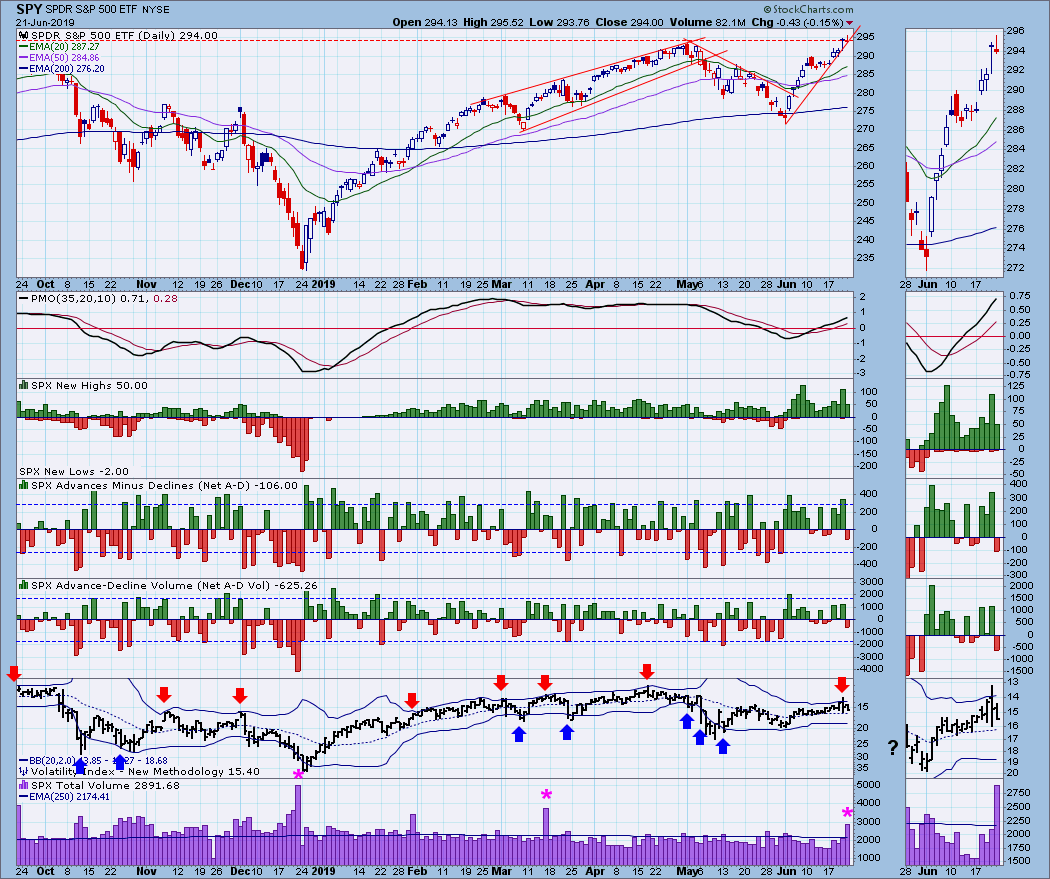
The market closed at an all-time high on Thursday, then on Friday it hit an all-time intraday high; however, there are some technical problems: (1) a bearish rising wedge pattern has formed; (2) there is an OBV negative divergence; (3) volume has been thin since the June low; and (4) the VIX penetrated the top Bollinger Band on Thursday, indicating that a short-term price top may be in. To clarify, SPX Volume on Friday was huge, but that was because of end-of-quarter options expiration, not an indication of some kind of blow-off. Below let's see how all this fits in the broader picture.
The DecisionPoint Weekly Wrap presents an end-of-week assessment of the trend and condition of the stock market (S&P 500), the U.S. Dollar, Gold, Crude Oil, and Bonds.
Watch the latest episode of DecisionPoint on StockCharts TV's YouTube channel here!
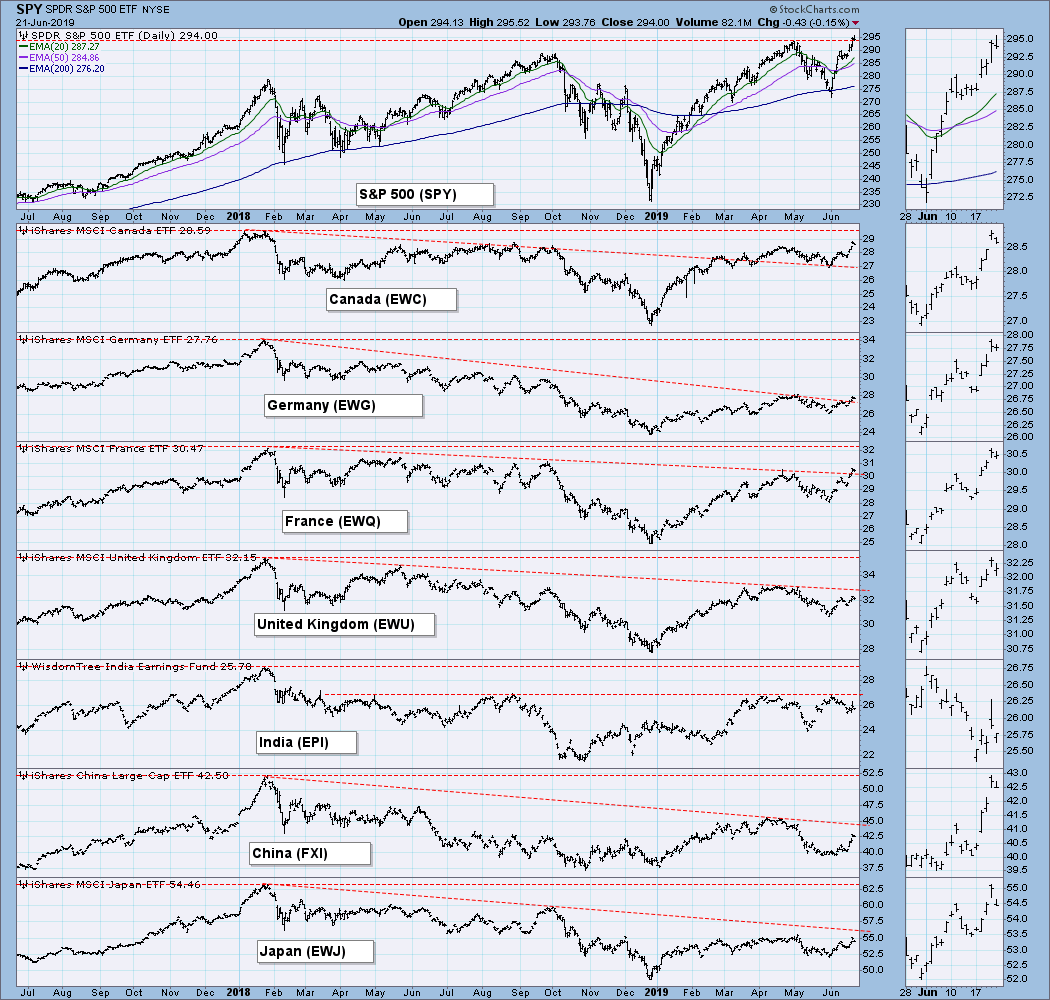
GLOBAL MARKETS
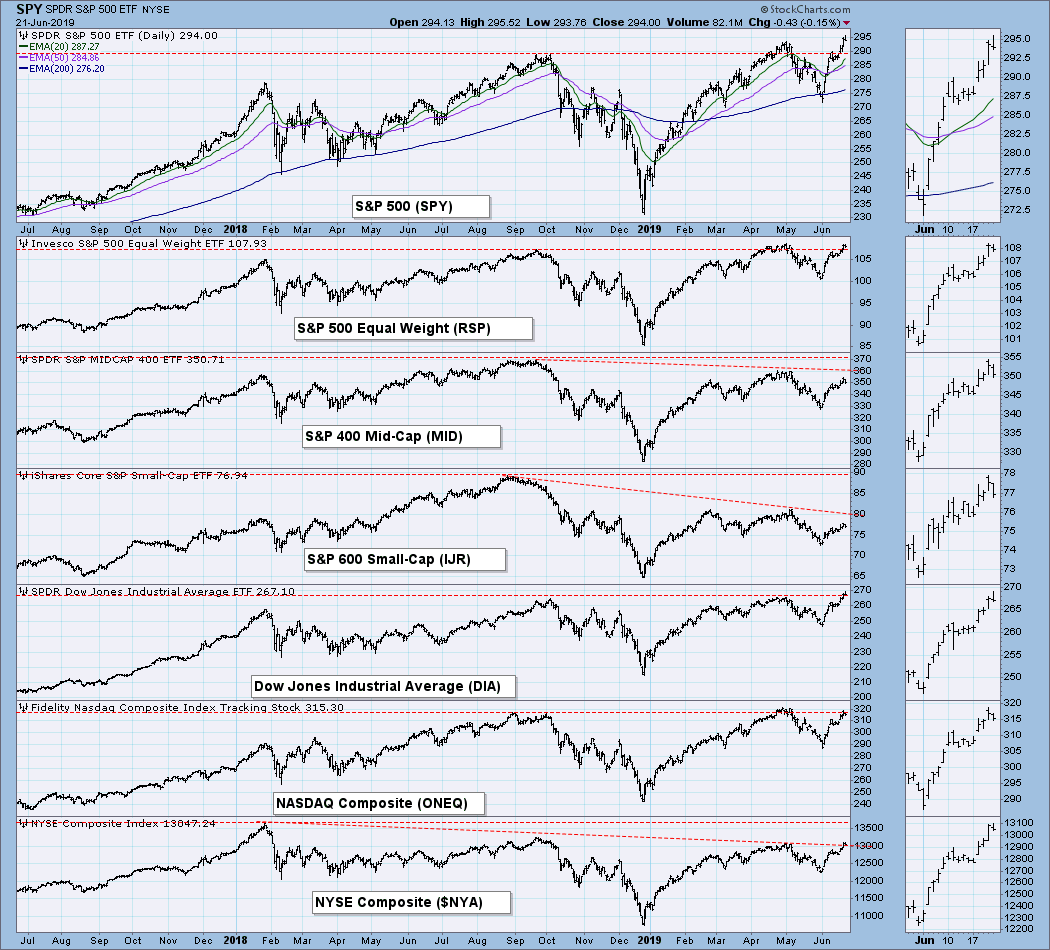
BROAD MARKET INDEXES
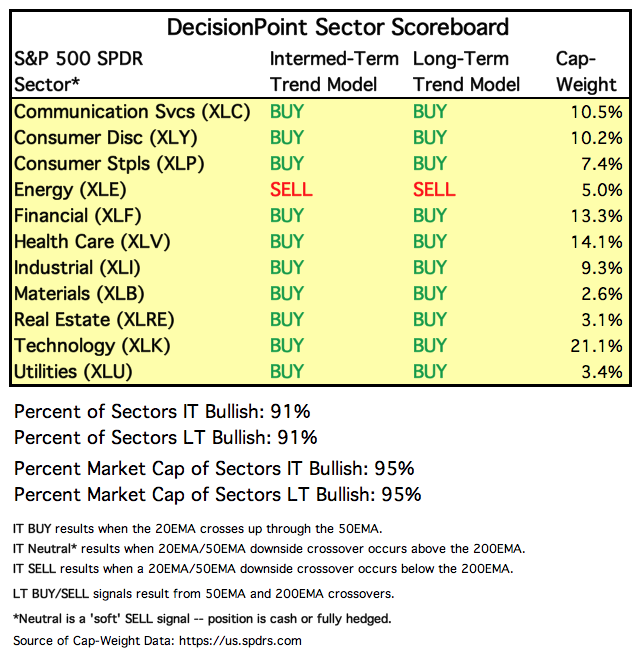
SECTORS
Each S&P 500 Index component stock is assigned to one, and only one, of 11 major sectors. This is a snapshot of the Intermediate-Term and Long-Term Trend Model signal status for those sectors.
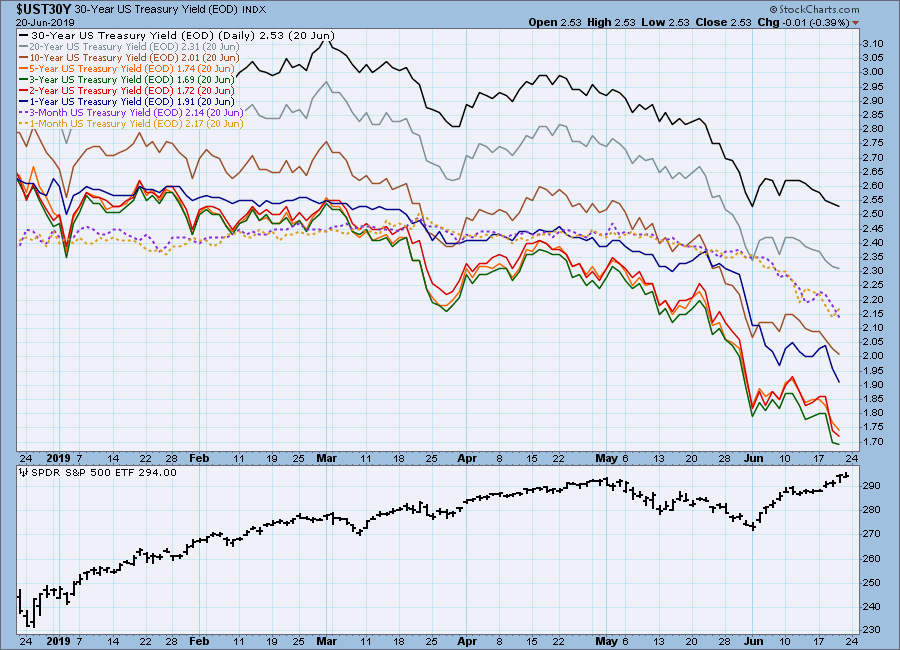
INTEREST RATES
It occurred to me that, because interest rates are currently inverted, it would be a good idea to include a chart to illustrate just what that means. In normal circumstances the longer money is borrowed the higher the interest rate that must be paid. When rates are inverted, the reverse is true. On the chart below, notice that one-month and three month T-Bills (dotted lines) pay a higher interest rate than the one year through the 10-year T-Bonds. Interest rate inversions are considered to be a problem for the stock market.
STOCKS
IT Trend Model: BUY as of 6/11/2019
LT Trend Model: BUY as of 2/26/2019
SPY Daily Chart: Other than what I noted in my comments at the beginning, I also note that SPX Volume was quite low in comparison with the three other EOQ expirations (pink asterisk). Let's keep in mind that the large-cap stocks are carrying the market right now. That is less than ideal, but it can persist for some time.
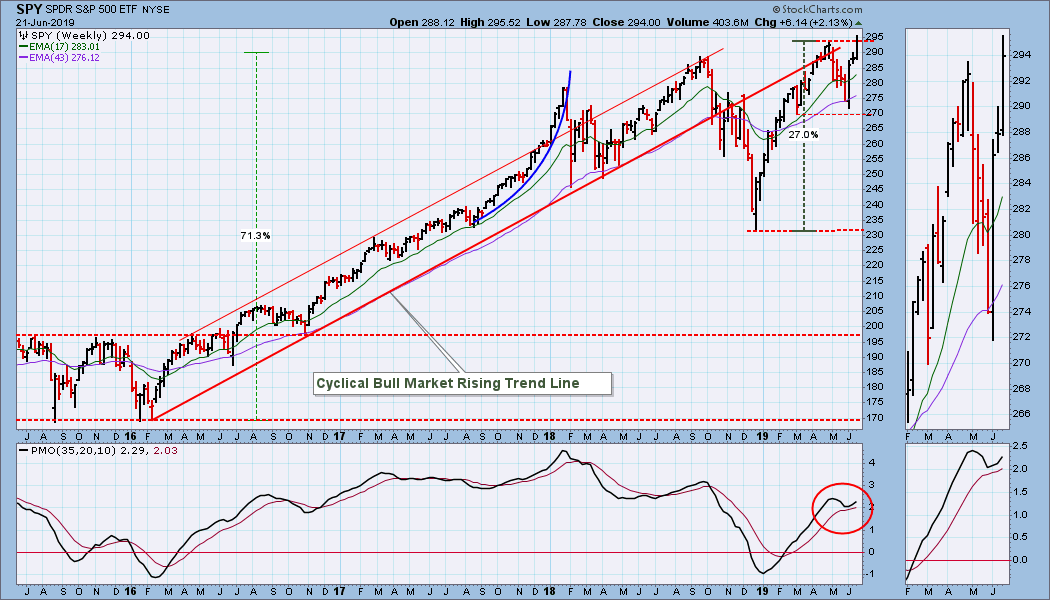
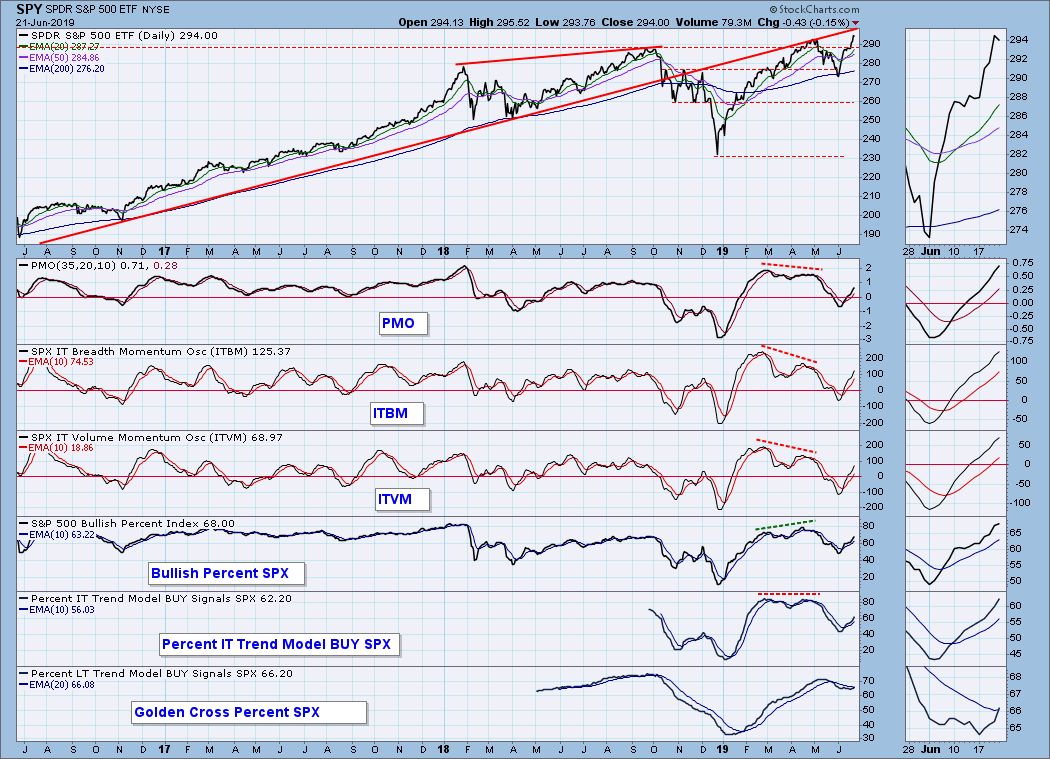
SPY Weekly Chart: With the weekly PMO rising, I'd have to say that this chart is bullish.
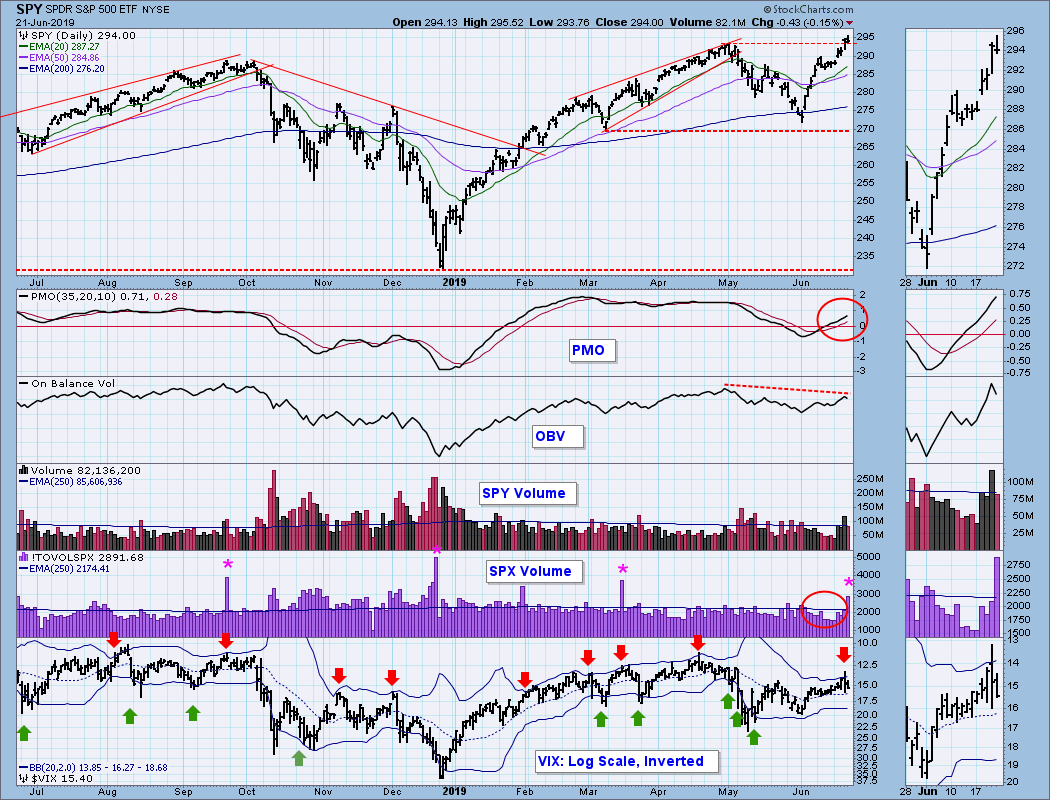
Climactic Market Indicators: I think there was an exhaustion climax on Thursday because of all the indicators except total volume and net volume showing high readings.
Short-Term Market Indicators: The STO-B and STO-V are weak, considering price movement. they look toppy.
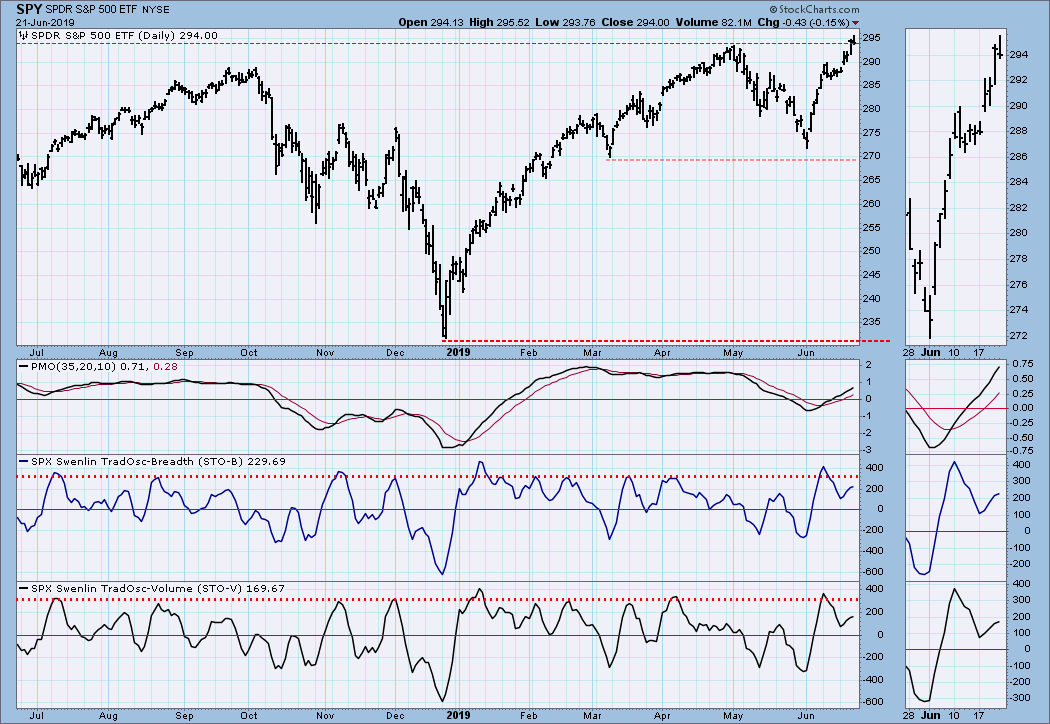
Intermediate-Term Market Indicators: These indicators all look bullish, and there is plenty of room before they become overbought.
CONCLUSION: As I stated at the beginning, the market has some short-term problems, but the intermediate term chart immediately above looks solidly bullish. The trick will be for the market to pull back and clear the short-term issues without messing up the longer-term picture. A pullback is not assured, but that is what I'll be looking for next week.
DOLLAR (UUP)
IT Trend Model: BUY as of 2/7/2019
LT Trend Model: BUY as of 5/25/2018
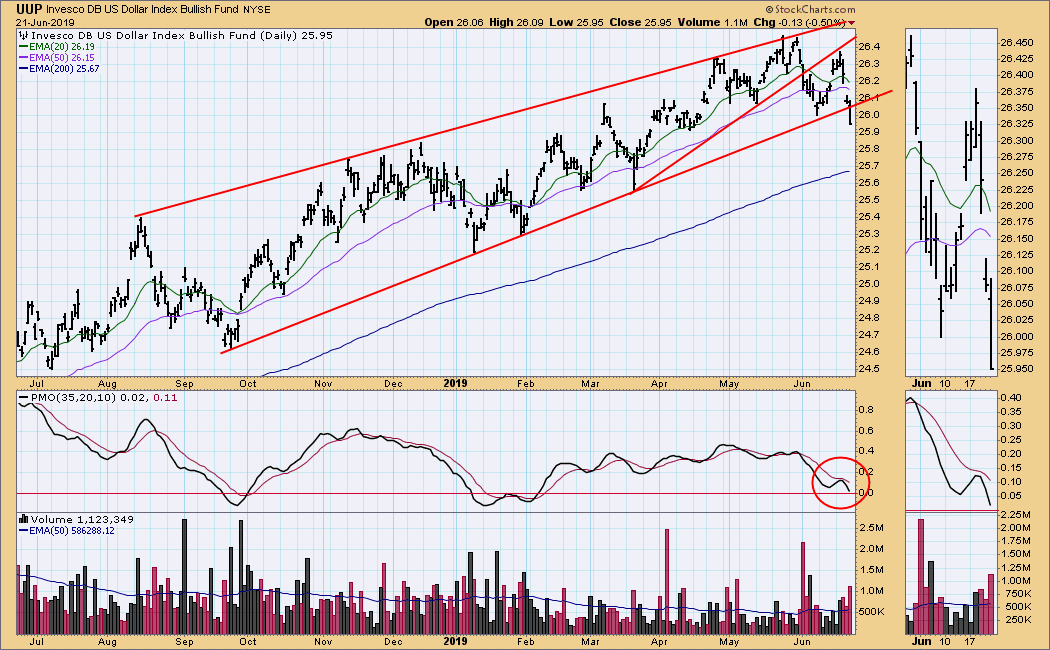
UUP Daily Chart: On Friday UUP finally broke down from a 10-month rising wedge formation. This was the expected resolution. The daily PMO turned down below the signal line, which is bearish.
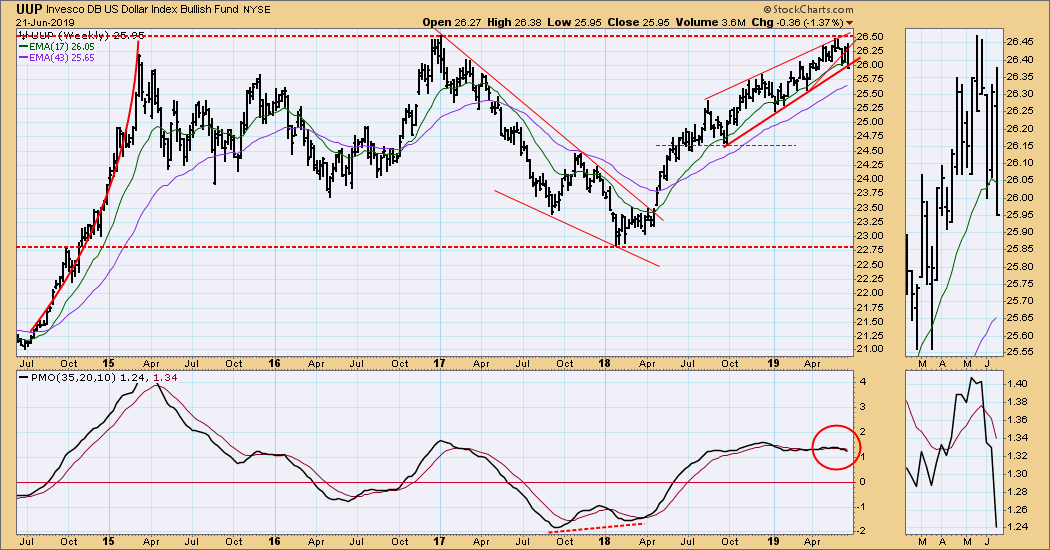
UUP Weekly Chart: We can see that line of long-term resistance has once again turned price back. That line goes back to 2007. The weekly PMO has turned down, but it is within its one-year range.
GOLD
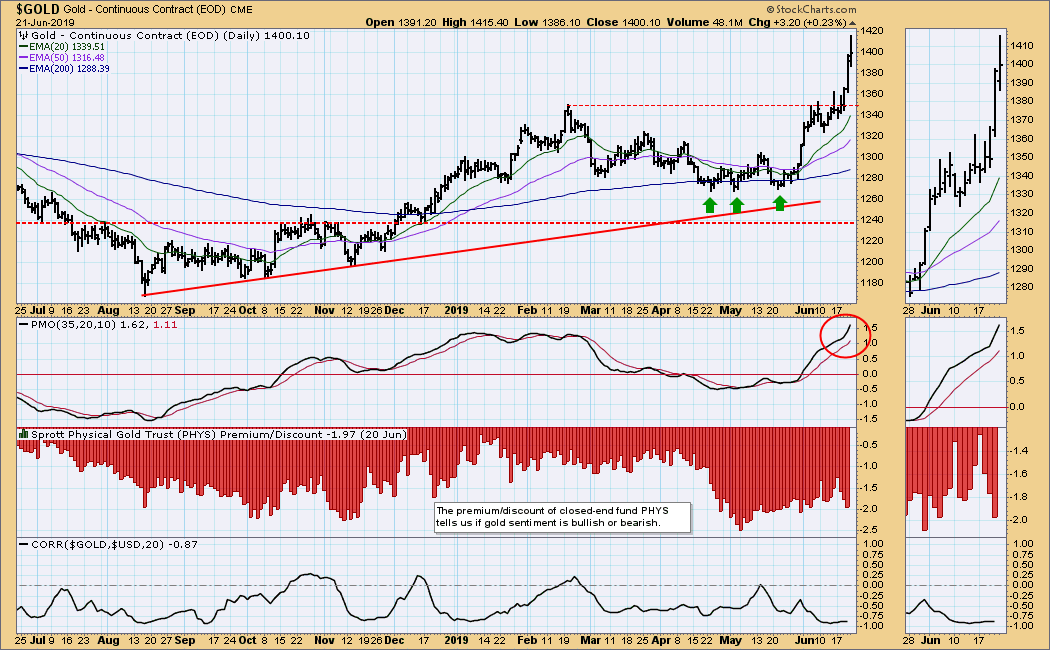
IT Trend Model: BUY as of 6/3/2019
LT Trend Model: BUY as of 1/8/2019
GOLD Daily Chart: Thanks to dollar weakness, gold has broken above the resistance line drawn across the February top. The move is "decisive," meaning that the breakout exceeded +3%, and is not likely to fail on a pullback.
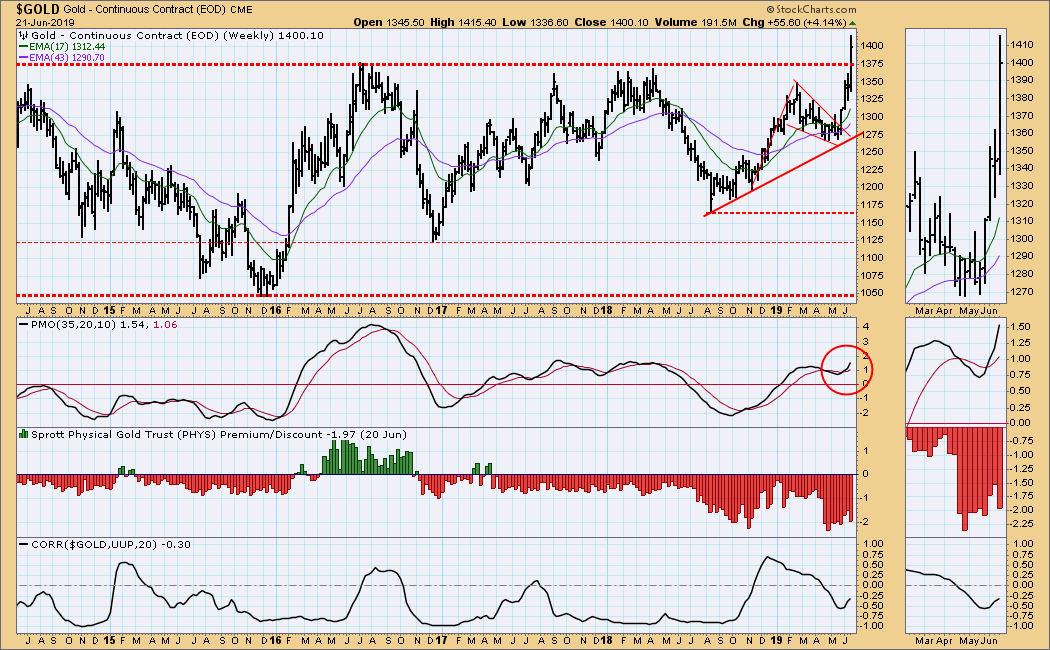
GOLD Weekly Chart: A more important breakout took place in this time frame. Long-term (about five years) resistance at 1375 was finally overcome, but so far the breakout is only about half of what is needed to be decisive.
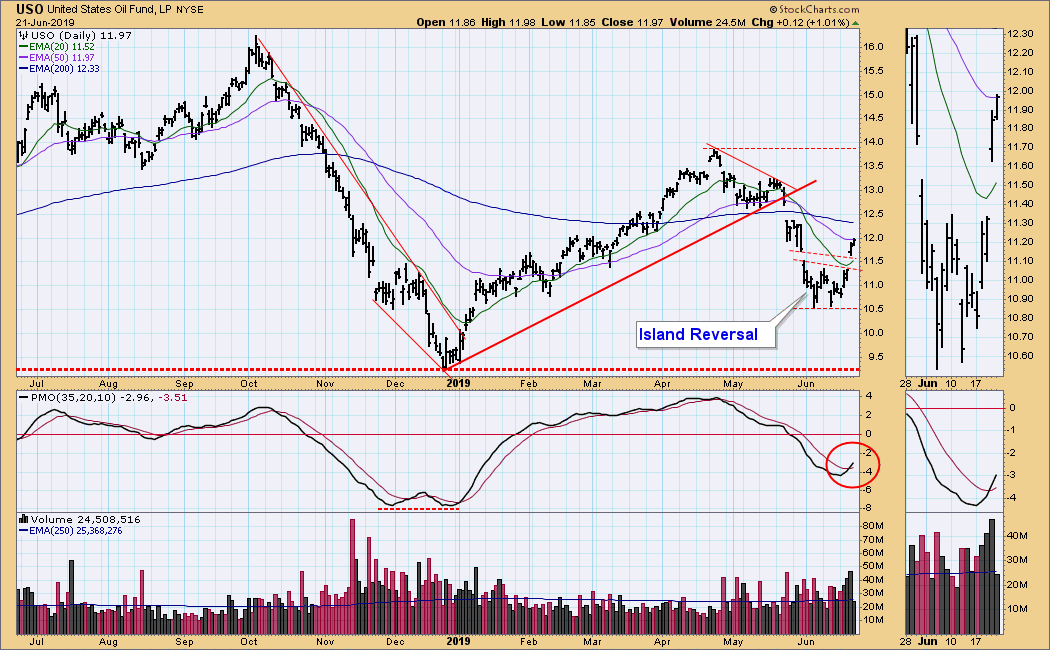
CRUDE OIL (USO)
IT Trend Model: NEUTRAL as of 5/30/2019
LT Trend Model: SELL as of 6/4/2019
USO Daily Chart: An island reversal combined with the PMO BUY signal (PMO has crossed up through the signal line) infer that price will go higher; however, I think that price movement has been rather tame in light of the confrontation with Iran.
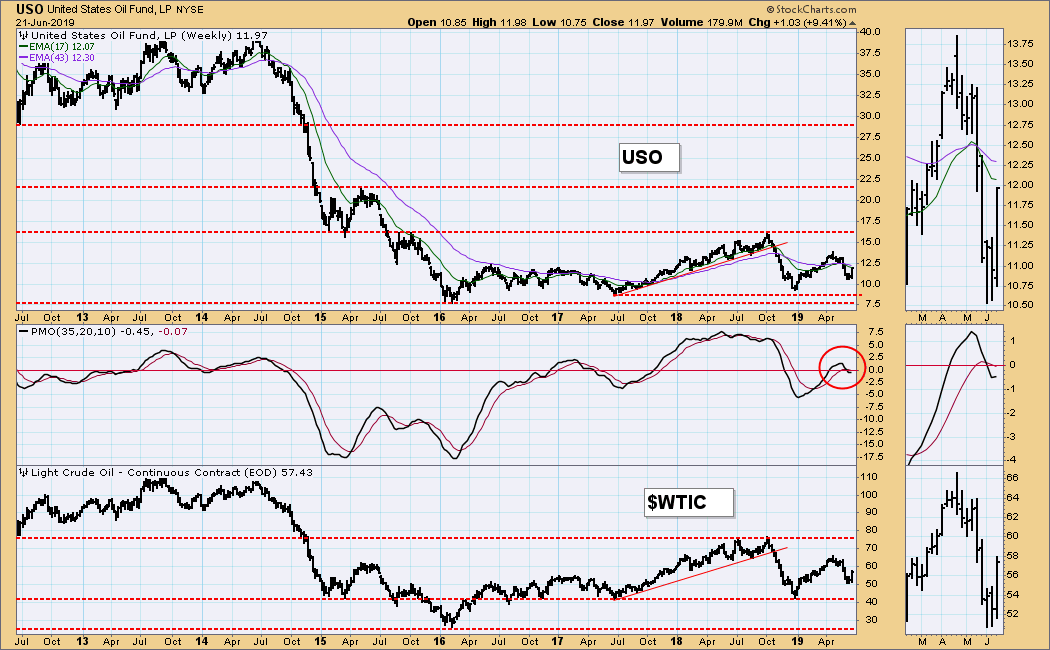
USO/WTIC Weekly Charts: The weekly PMO has turned up, but prices are in the middle of a trading range, and, I think, not likely to break out.
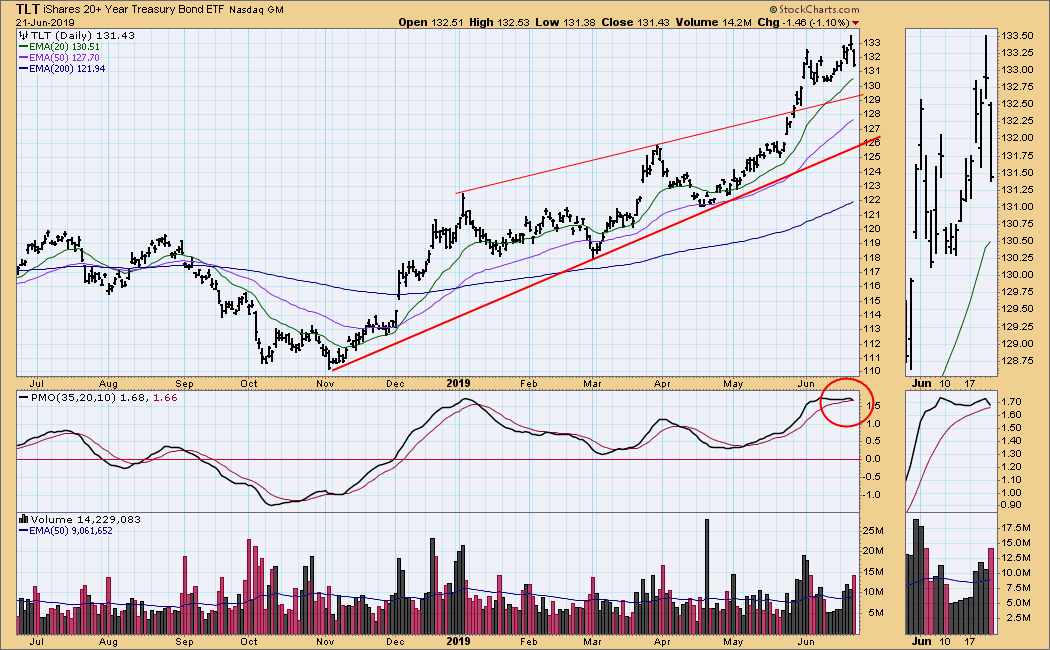
BONDS (TLT)
IT Trend Model: BUY as of 12/6/2018
LT Trend Model: BUY as of 1/2/2019
TLT Daily Chart: The daily PMO has topped and is about to cross down through the signal line, so a new price decline is probably in the cards.
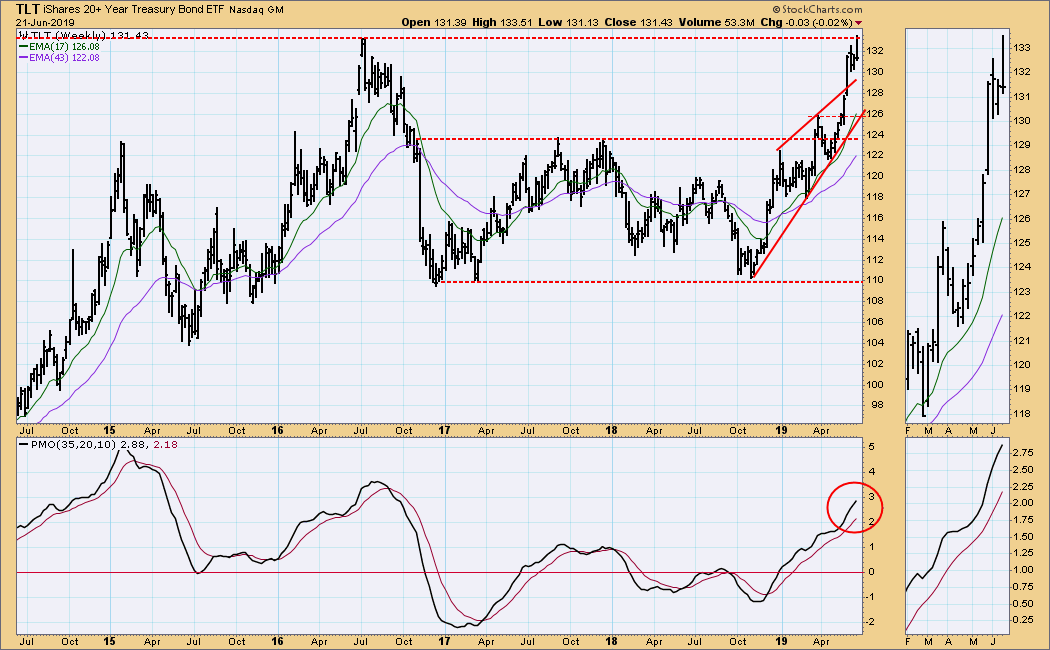
TLT Weekly Chart: This week price hit resistance at the line drawn across the previous all-time high in 2016, but it was turned back and closed near the low for the week. The weekly PMO still looks strong, so another run at resistance may be coming.
**Don't miss any of the DecisionPoint commentaries! Go to the "Notify Me" box toward the end of this blog page to be notified as soon as they are published.**
Technical Analysis is a windsock, not a crystal ball.
Happy Charting!
- Carl
NOTE: The signal status reported herein is based upon mechanical trading model signals, specifically, the DecisionPoint Trend Model. They define the implied bias of the price index based upon moving average relationships, but they do not necessarily call for a specific action. They are information flags that should prompt chart review. Further, they do not call for continuous buying or selling during the life of the signal. For example, a BUY signal will probably (but not necessarily) return the best results if action is taken soon after the signal is generated. Additional opportunities for buying may be found as price zigzags higher, but the trader must look for optimum entry points. Conversely, exit points to preserve gains (or minimize losses) may be evident before the model mechanically closes the signal.
Helpful DecisionPoint Links:
DecisionPoint Shared ChartList and DecisionPoint Chart Gallery
Price Momentum Oscillator (PMO)
Swenlin Trading Oscillators (STO-B and STO-V)
