DecisionPoint July 26, 2019 at 06:50 PM
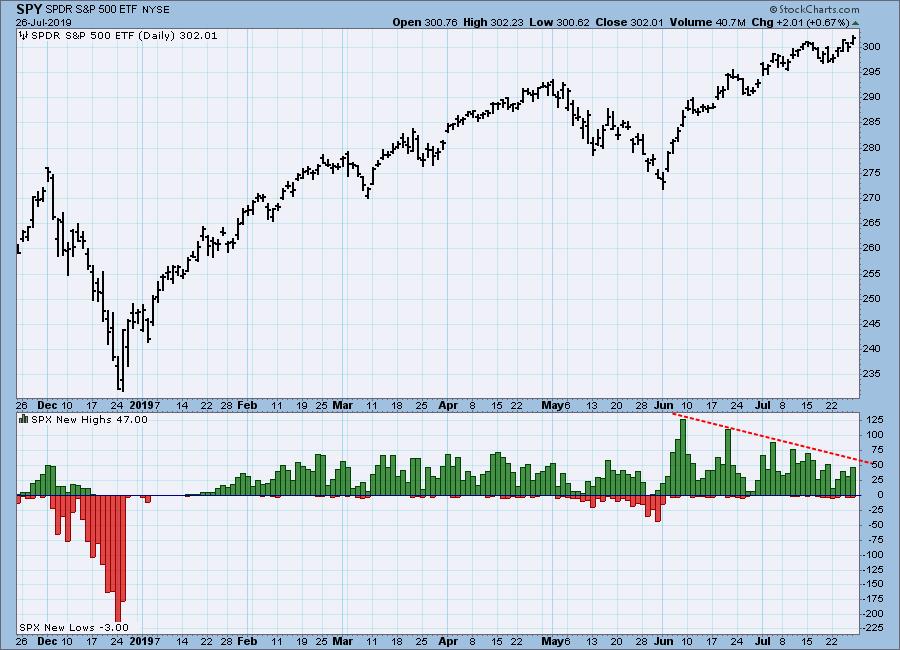
The S&P 500 Index has been making all-time highs for over a month, but new highs for S&P 500 component stocks has been fading since the rally initiation spike in early-June. This indicates that participation is narrowing and that largest-cap stocks are doing most of the work... Read More
DecisionPoint July 24, 2019 at 09:06 PM

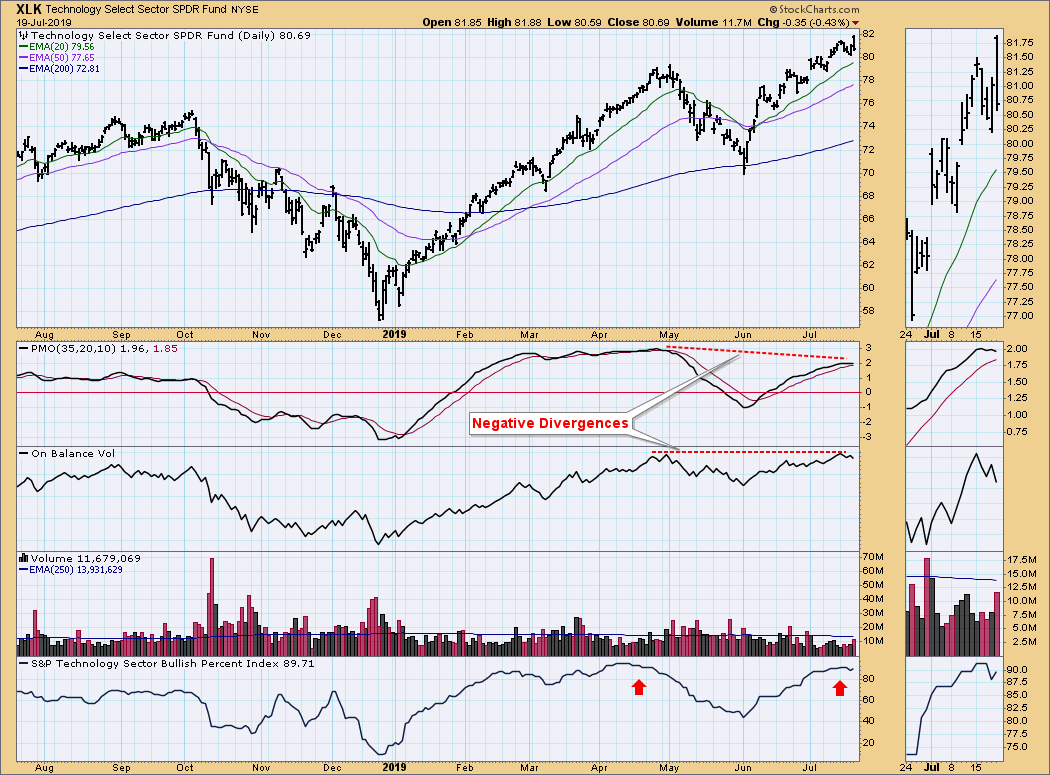
Last week, I wrote about the bearishness of our indicators, excepting our very short-term analysis of breadth and the $VIX, which were pointing to higher prices this week. Well, there's been a character change on our short- and intermediate-term indicators that you should see... Read More
DecisionPoint July 19, 2019 at 06:24 PM
The Bullish Percent Index (BPI) shows the percentage of stocks in a given index with Point and figure BUY signals. Besides having a BPI for the major market indexes, StockCharts... Read More
DecisionPoint July 12, 2019 at 06:13 PM
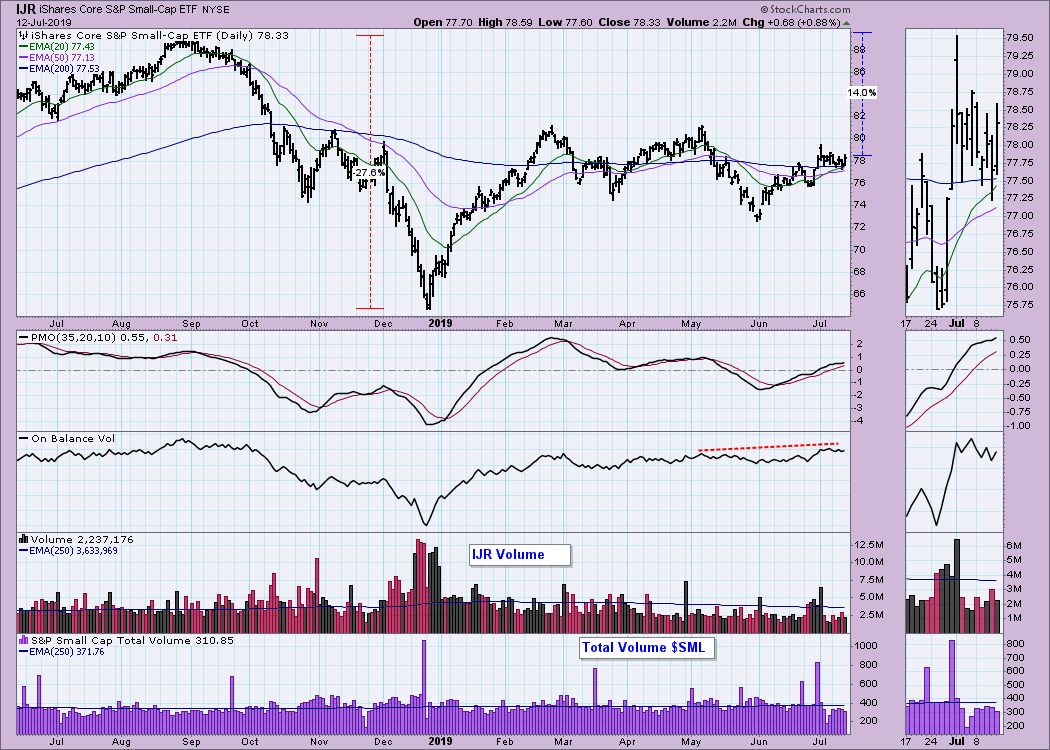
While the broad market indexes are currently making all-time highs, the S&P 600 Small-Cap Index (IJR) is struggling and remains about -14% below its all-time highs. This lack of small-cap participation is a concern, because the large-caps can't carry the market forever... Read More
DecisionPoint July 11, 2019 at 11:39 PM

Sometimes, you get more than you bargained for. That said, you stand a much better chance of finding those successful (and many times parabolic) stocks when you start with a good analysis process. The DecisionPoint Analysis Process does just that... Read More
DecisionPoint July 05, 2019 at 06:57 PM
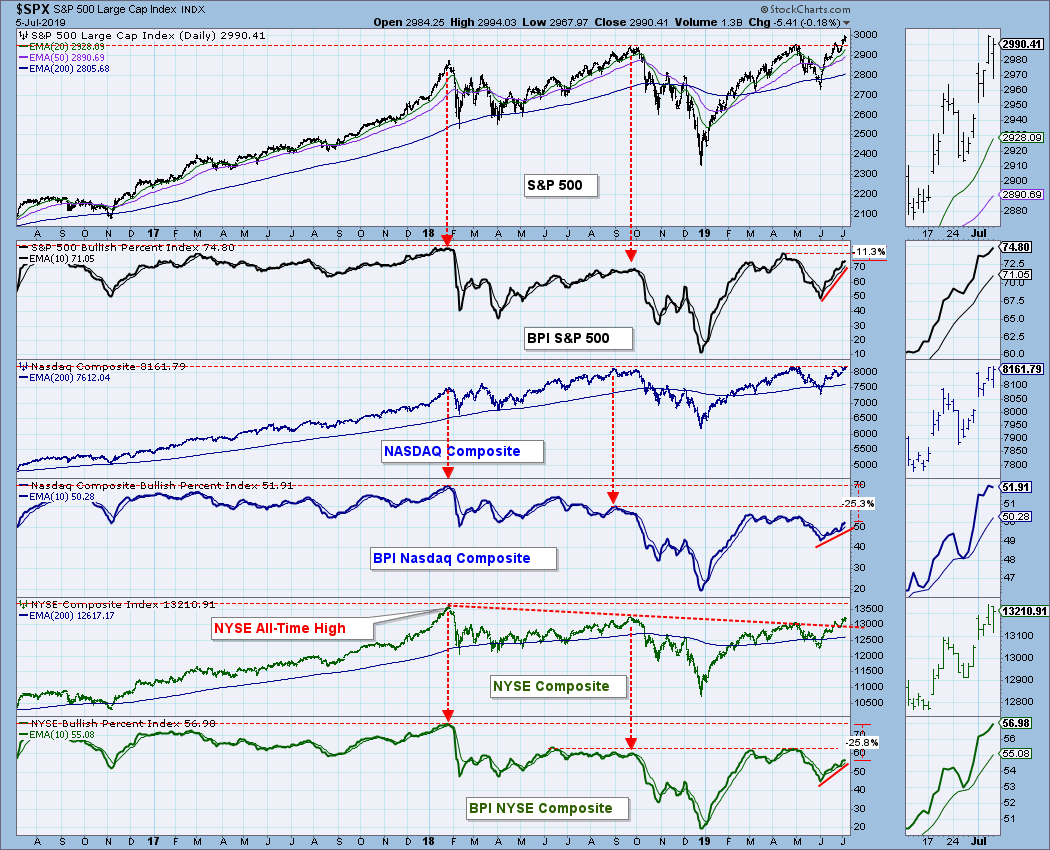
With the S&P 500 and NASDAQ Composite making or equaling all-time highs, it would be appropriate to check the participation behind this up surge. The Bullish Percent Index (BPI) measures the percentage of stocks in a given index that have point & figure BUY signals... Read More