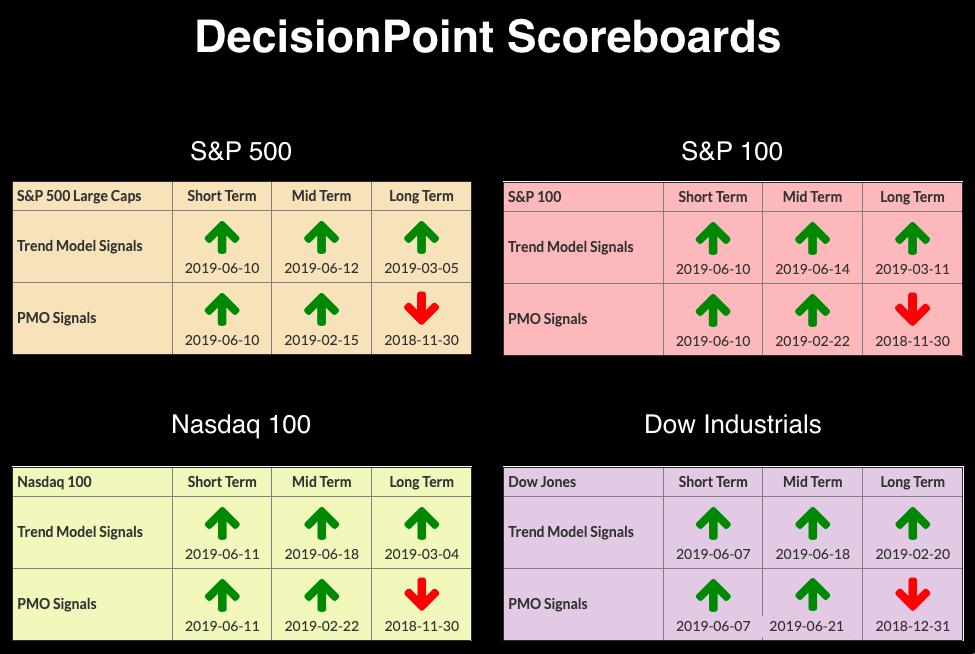
 Last week, I wrote about the bearishness of our indicators, excepting our very short-term analysis of breadth and the $VIX, which were pointing to higher prices this week. Well, there's been a character change on our short- and intermediate-term indicators that you should see. There were no real changes to the DP Scoreboards, but I do want to note that we had a whipsaw PMO SELL signal appear on the $OEX this week. I opted not to change the date of the BUY signal, as the original one is more accurate.
The DecisionPoint Alert presents a mid-week assessment of the trend and condition of the stock market (S&P 500), the U.S. Dollar, Gold, Crude Oil and Bonds.
Watch the latest episode of DecisionPoint on StockCharts TV's YouTube channel here!
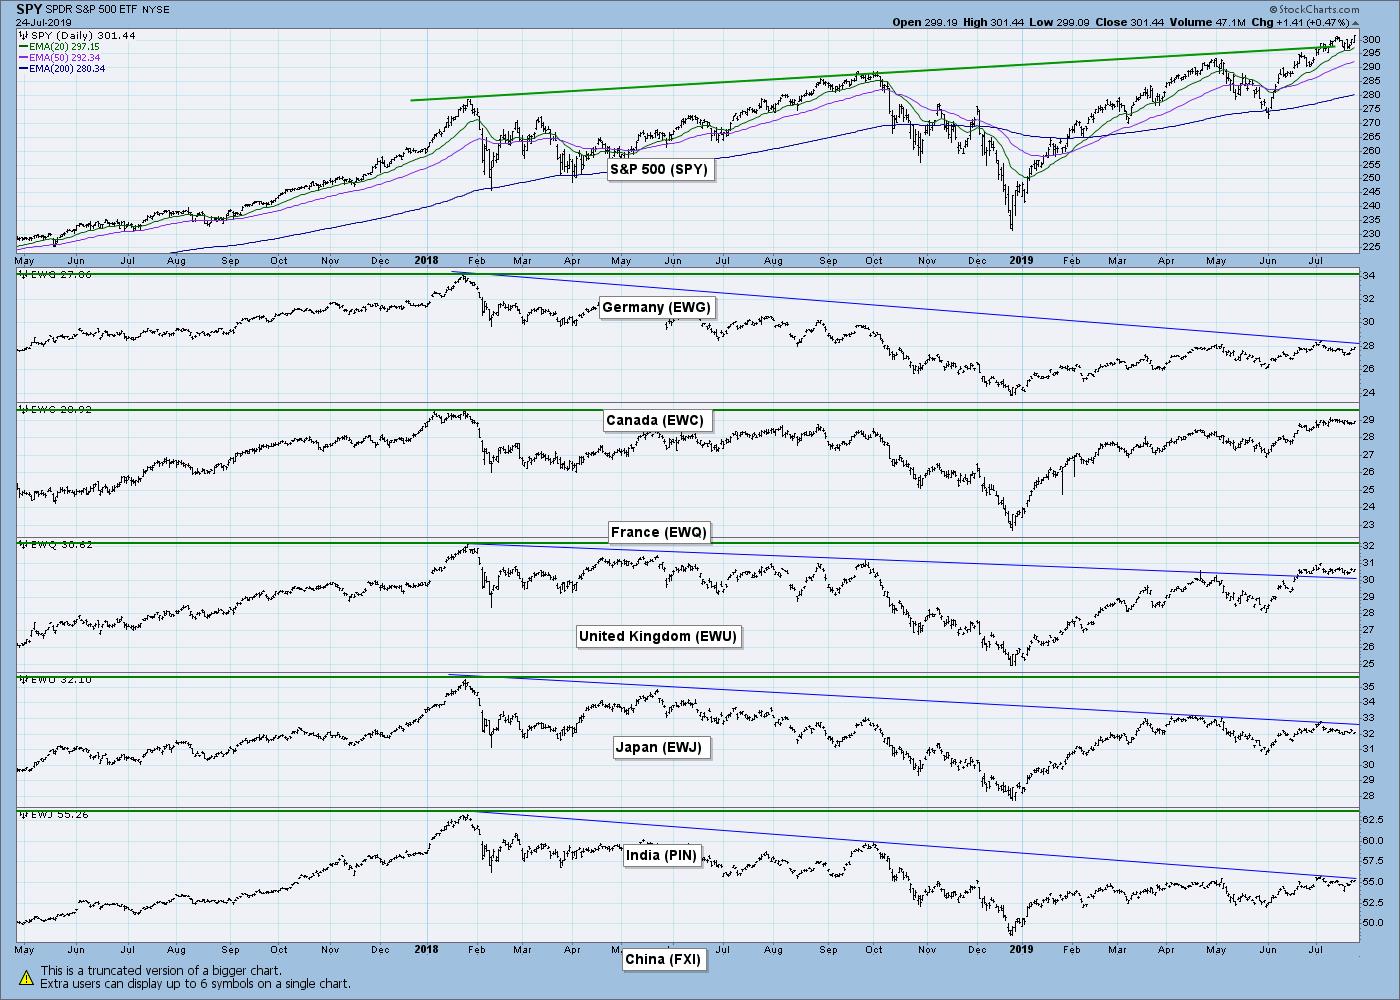
GLOBAL MARKETS
The Global ETF chart is important to note, with the declining trends that have not yet been broken and the all-time highs not yet challenged.
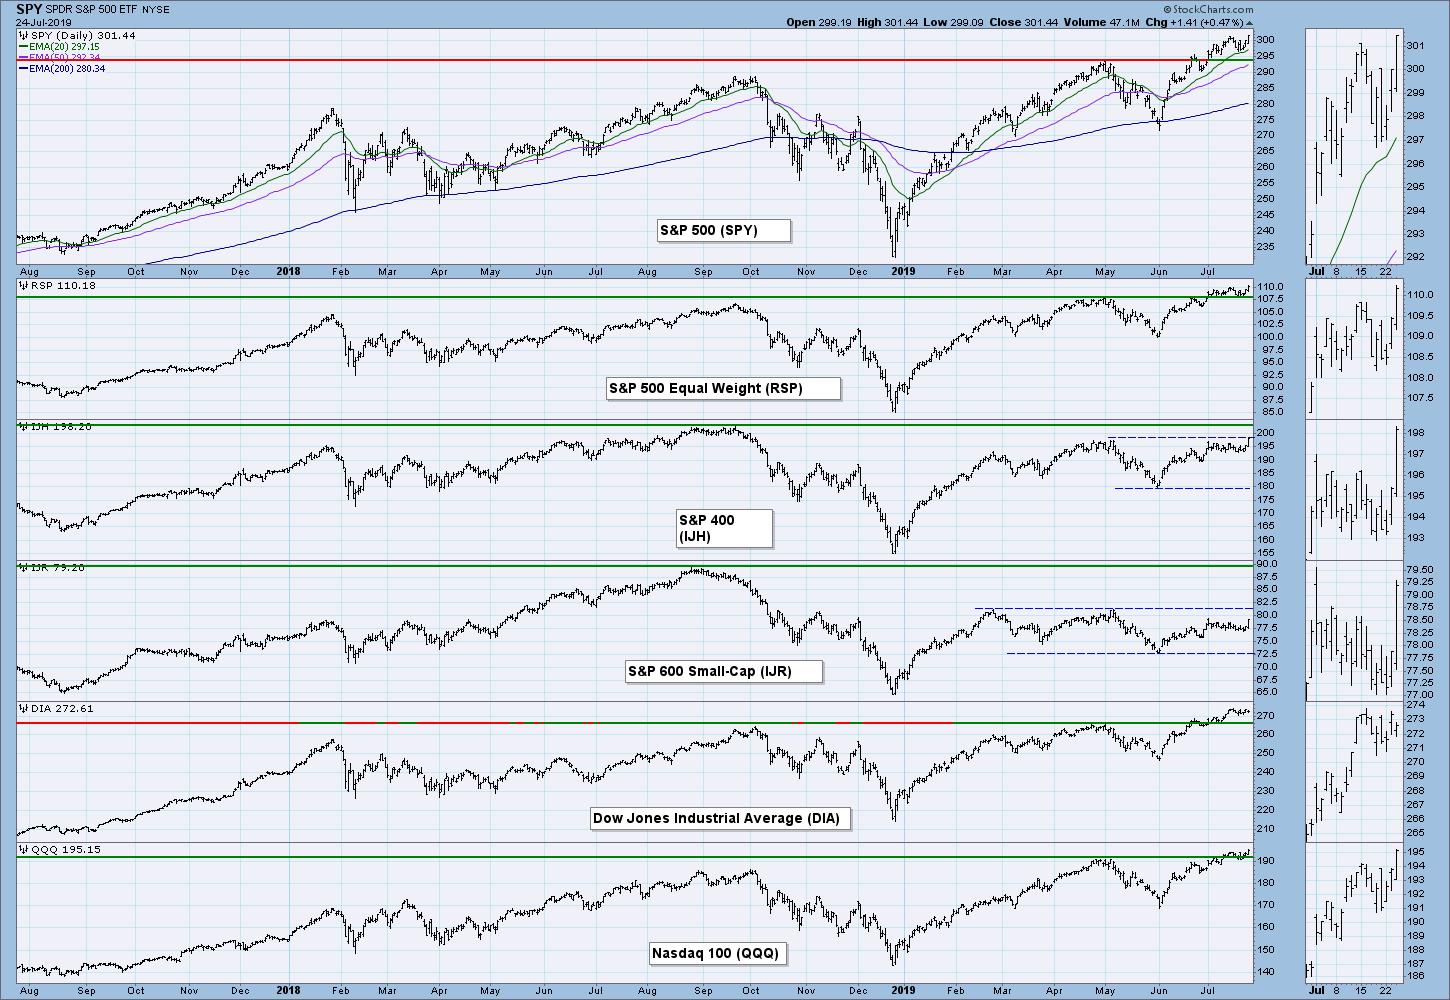
BROAD MARKET INDEXES
It was good see mid-caps and small caps leap higher today. A strong rally will be easier to maintain if these stocks begin to outperform.
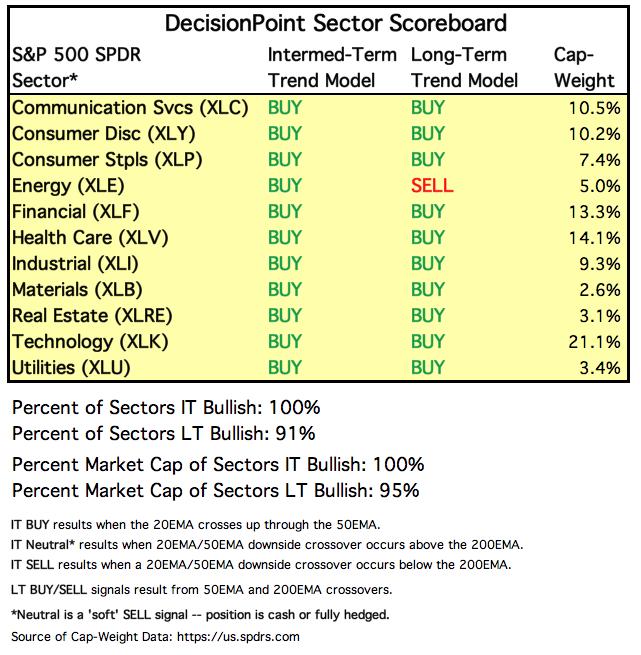
SECTORS
Each S&P 500 Index component stock is assigned to one, and only one, of eleven major sectors. This is a snapshot of the Intermediate-Term and Long-Term Trend Model signal status for those sectors.
STOCKS
IT Trend Model: BUY as of 6/11/2019
LT Trend Model: BUY (SPY) as of 2/26/2019
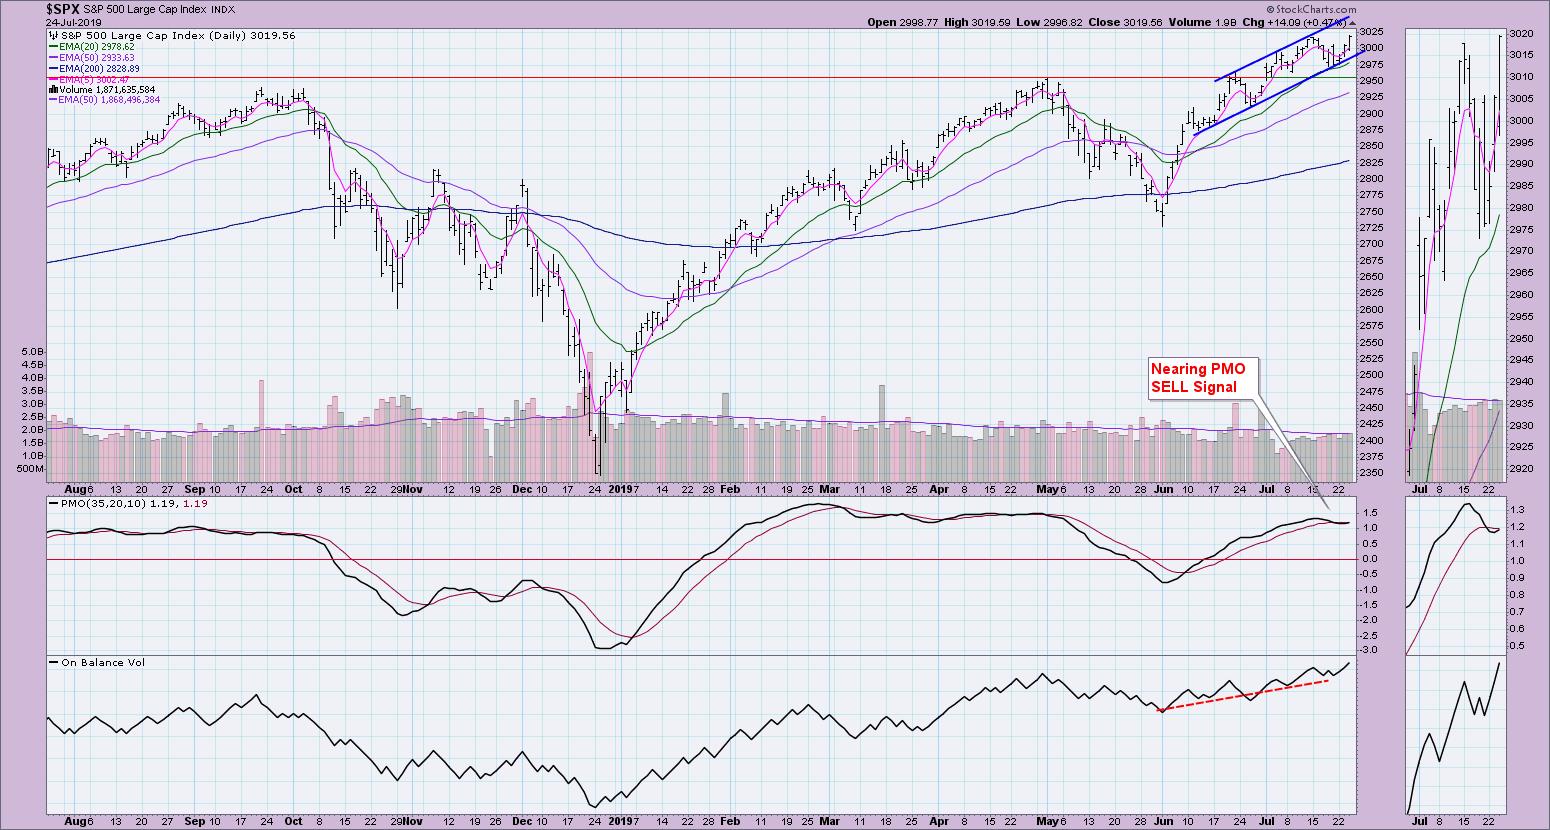
SPX Daily Chart: During Friday's DecisionPoint show, I noted bearish rising wedges on the Dow and NDX. I had one annotated on the SPX as well, but, the more I looked at it, the more I was convinced it was actually a rising trend channel. We also saw a whipsaw PMO SELL signal; again, I decided not to change the date of the original signal to today. However, it is certainly encouraging to see this turnaround. The OBV continues to confirm this rising trend.
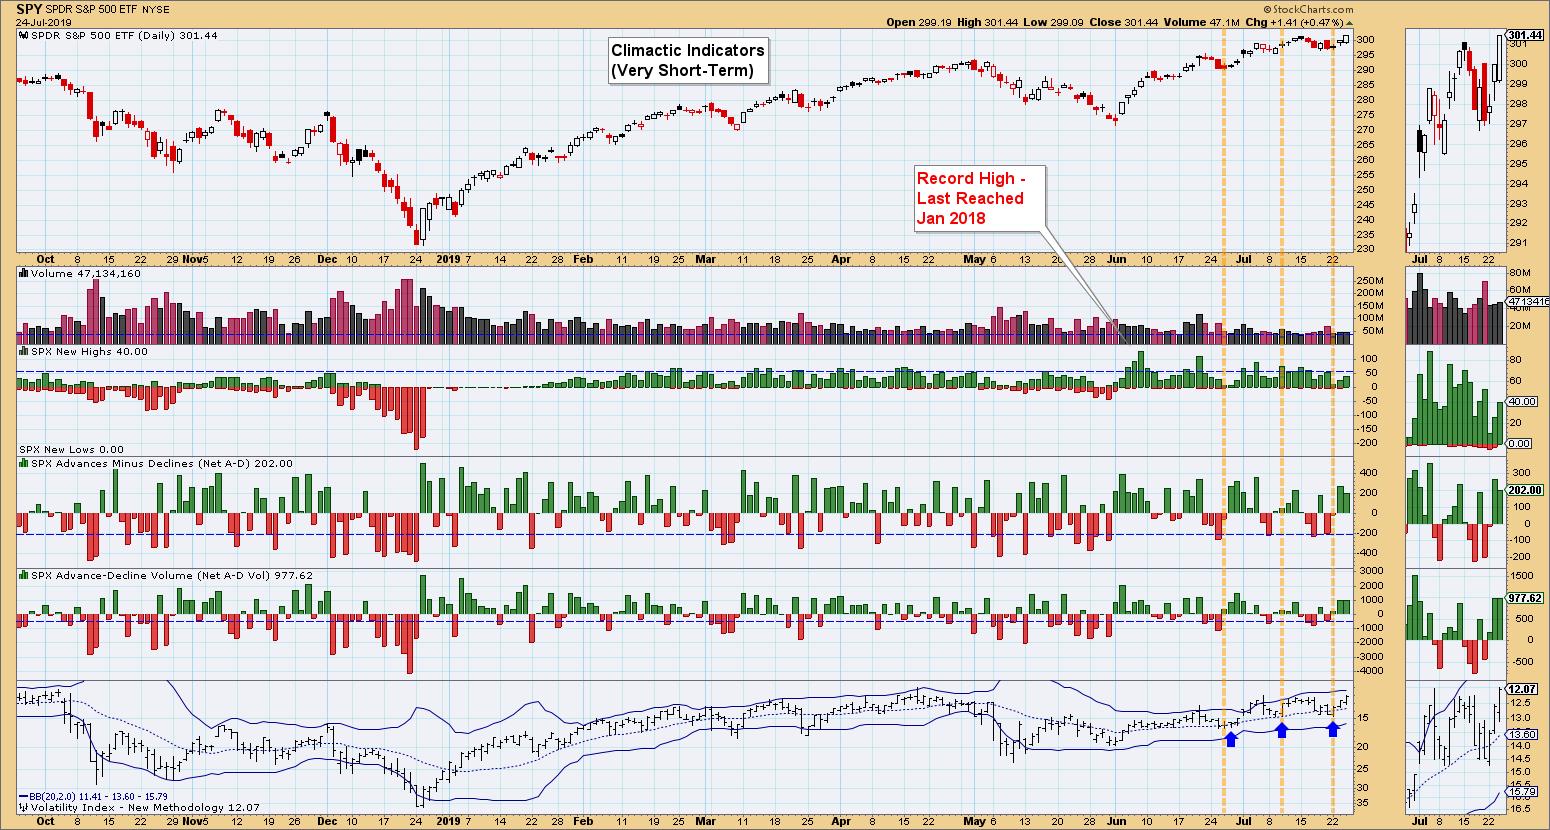
Climactic Market Indicators: Last week, when I wrote the DP Alert, I mentioned that the last few times the VIX has traveled down to its average, it turned right back around and confirmed the rally. There is still plenty of room for it to move toward the upper Bollinger Band, so I'm looking at the high breadth readings in conjunction with the VIX as a "buying initiation." I expect to see higher prices into Friday.
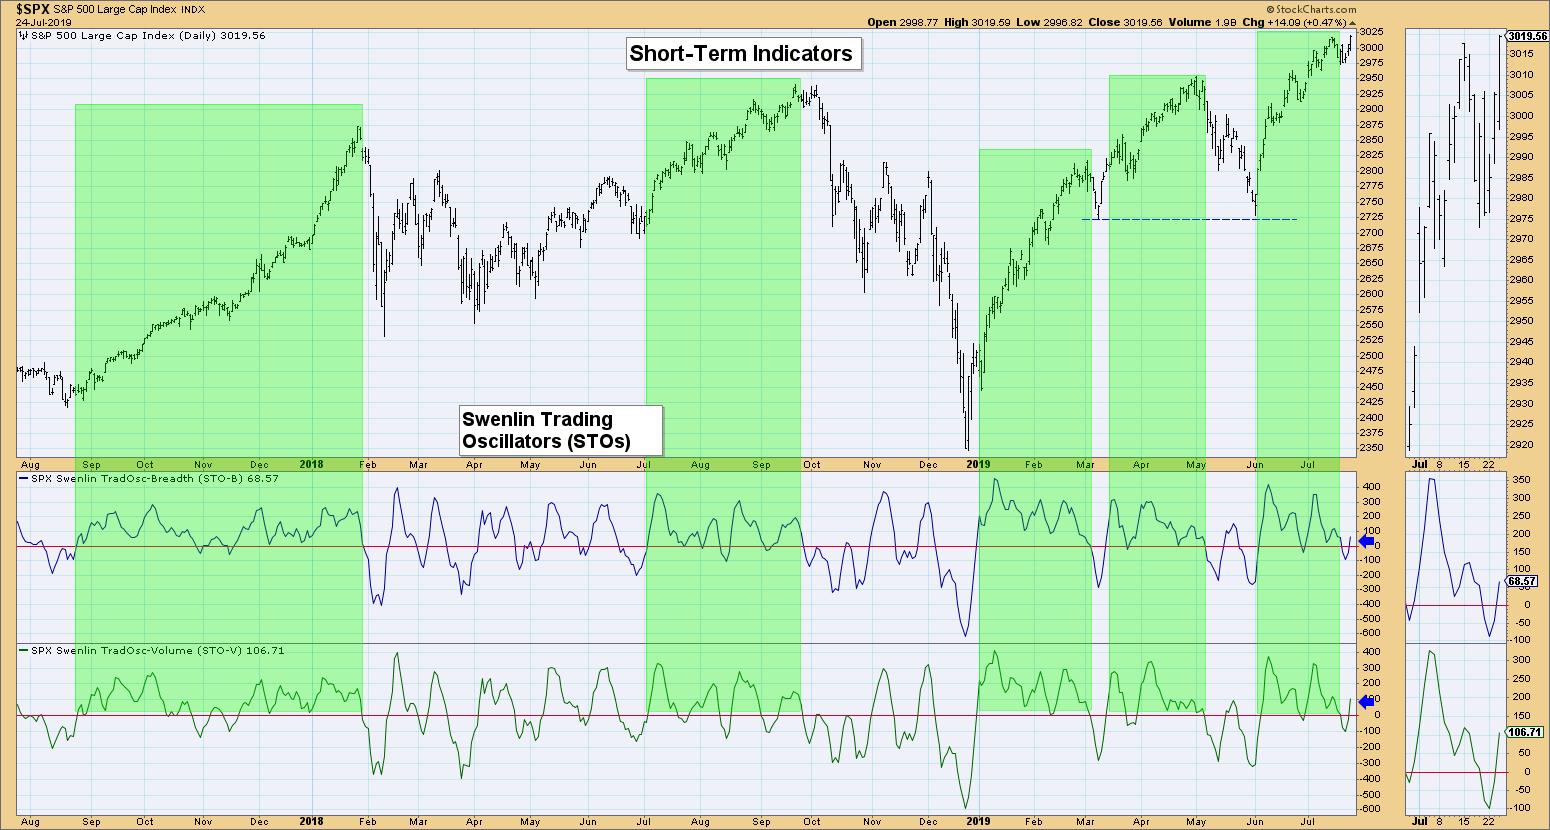
Short-Term Market Indicators: Last week, I was very concerned about these indicators moving below the zero line. As noted by the green boxes, we need this oscillator to remain at or above the zero line. Well, with this short rally and today's very positive action, the Swenlin Trading Oscillators popped back above the zero line and into a bullish configuration.
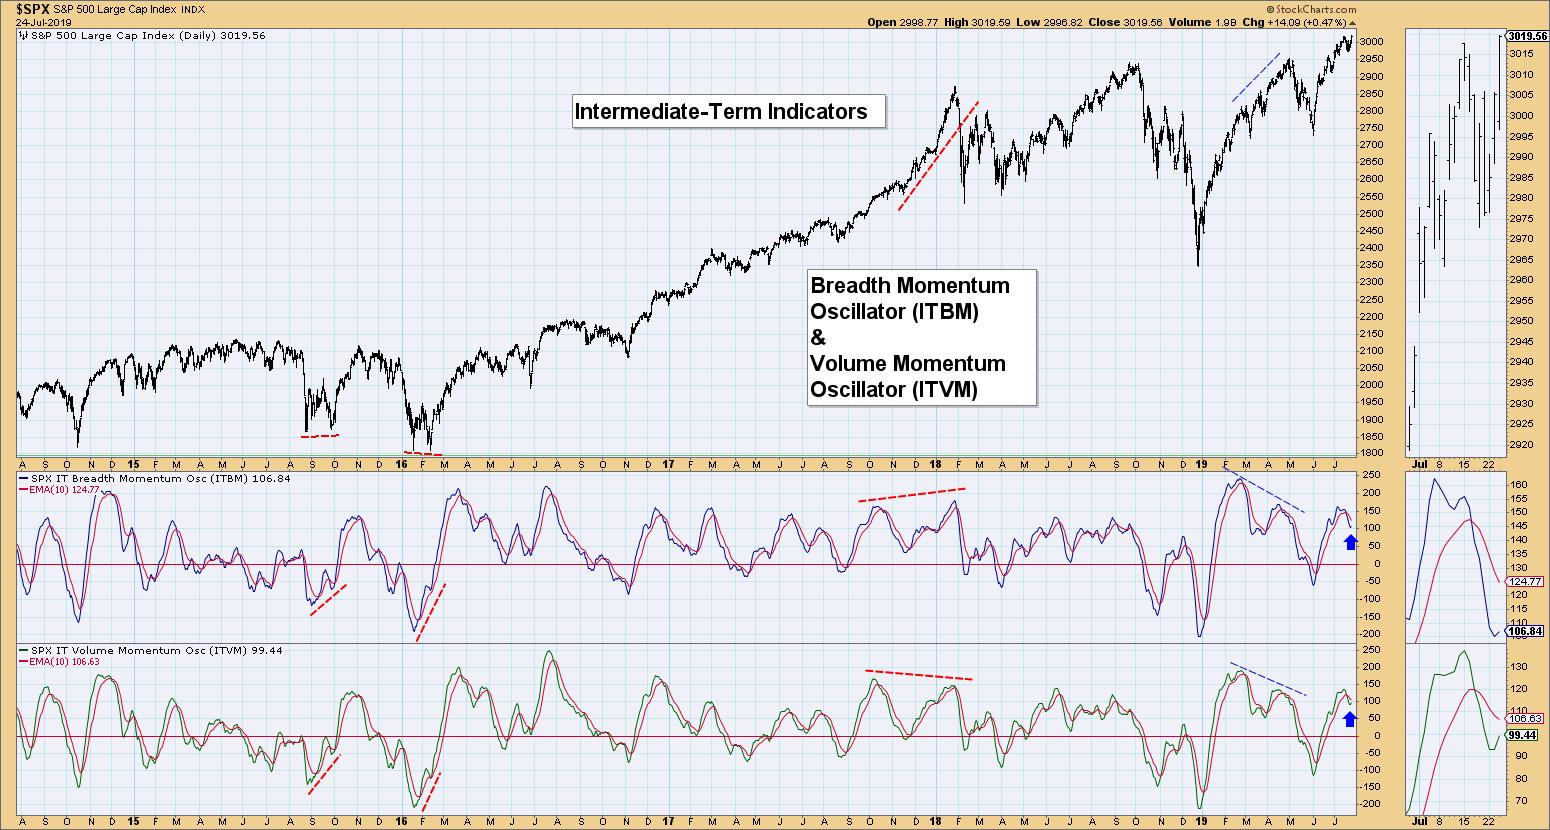
Intermediate-Term Market Indicators: I was also encouraged today when I saw that our intermediate-term indicators popped to the upside. I'll feel even better if they manage a positive crossover above their signal line, and it does appear they are ready to do so.
Conclusion: I am much more bullish going into the rest of this week and into the next. Tom Bowley has been addressing the very positive earnings that keep coming out, which certainly seems to be powering the market to the upside. The Dow suffered a blow today as Catapillar (CAT) and Boeing (BA) didn't impress with their earnings and guidance, falling -4.43% and -3.15% respectively. The big winner today was the Russell 2000, which shot up 1.64%. As I said earlier, we need small-caps to start outperforming, as that usually fuels and sustains strong market rallies.
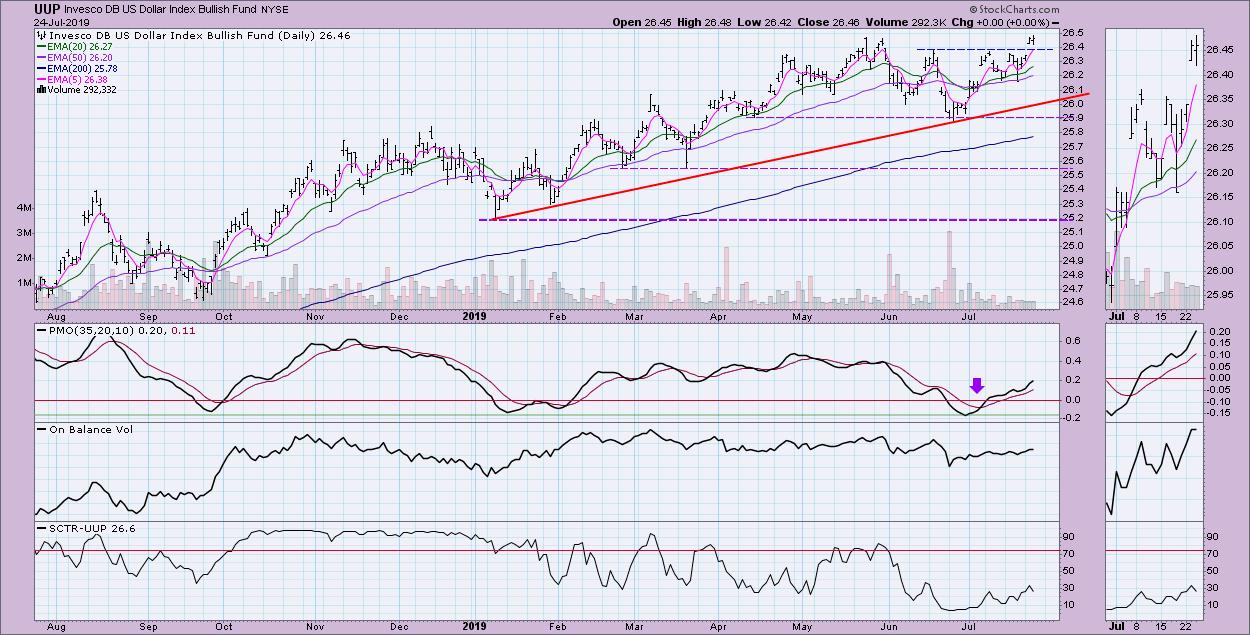
DOLLAR (UUP)
IT Trend Model: BUY as of 2/7/2019
LT Trend Model: BUY as of 5/25/2018
UUP Daily Chart: The Dollar broke out yesterday, but was stopped at overhead resistance at the May top. Given the very positive PMO and OBV, I don't expect this to turn into a reverse island formation. However, I suspect we will see some sideways movement along the support at the previous short-term tops before a breakout at this year's high.
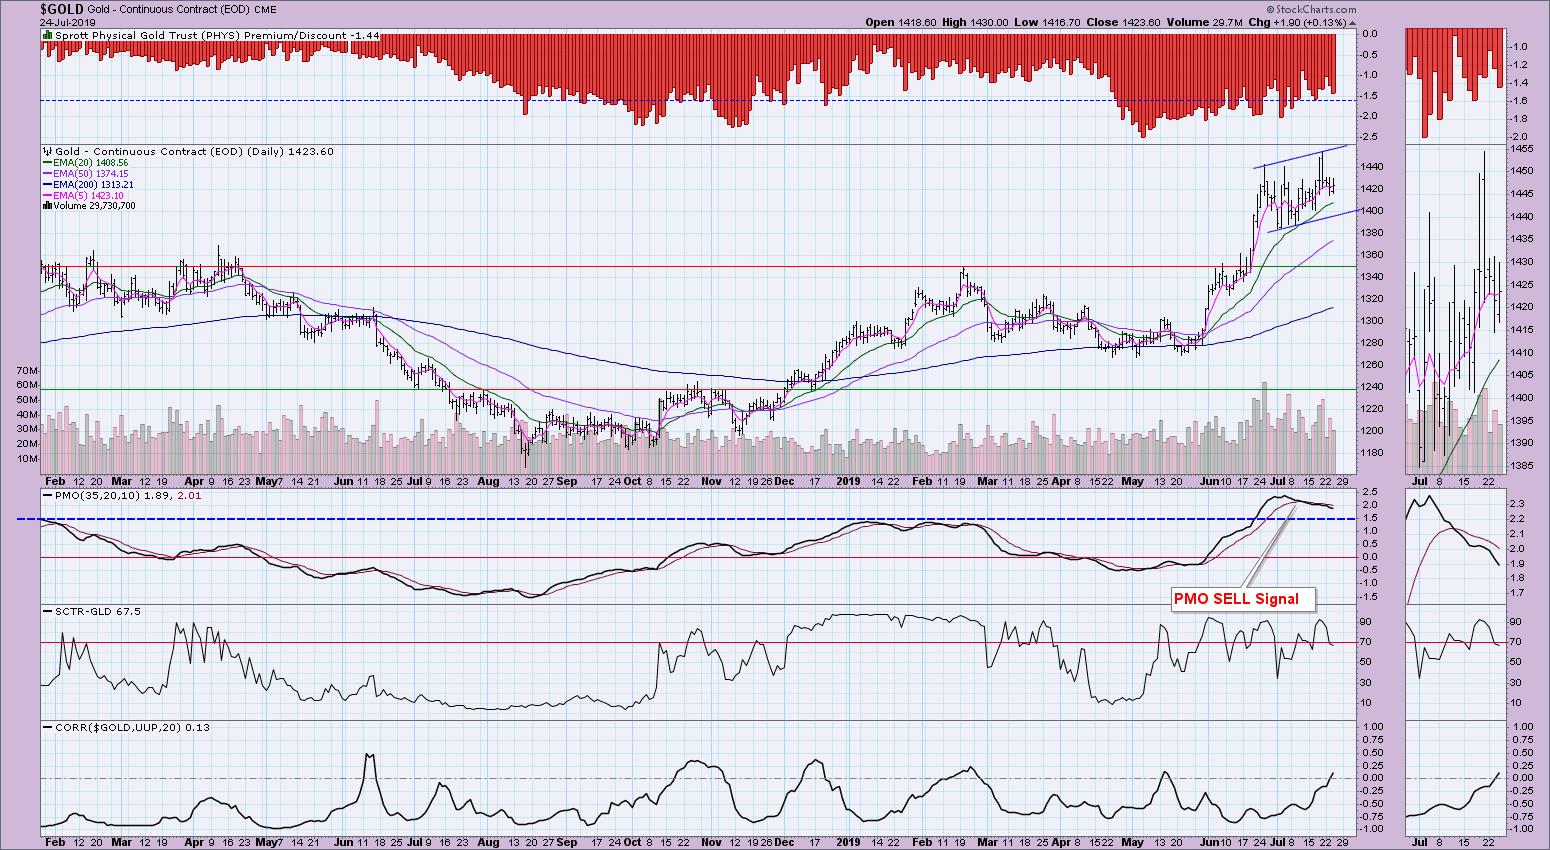
GOLD
IT Trend Model: BUY as of 6/3/2019
LT Trend Model: BUY as of 1/8/2019
GOLD Daily Chart: Gold continues to consolidate in a very wide rising trend channel. Discounts, which measure sentiment, have pulled back, suggesting buyers are getting a bit more bullish. I don't see this as a problem, as the discounts remain on the high side despite a pullback. The PMO is worrisome, but this is its chance to unwind and get out of overbought territory. Price hasn't really deteriorated that much despite the PMO SELL signal, so I remain optimistic on Gold.
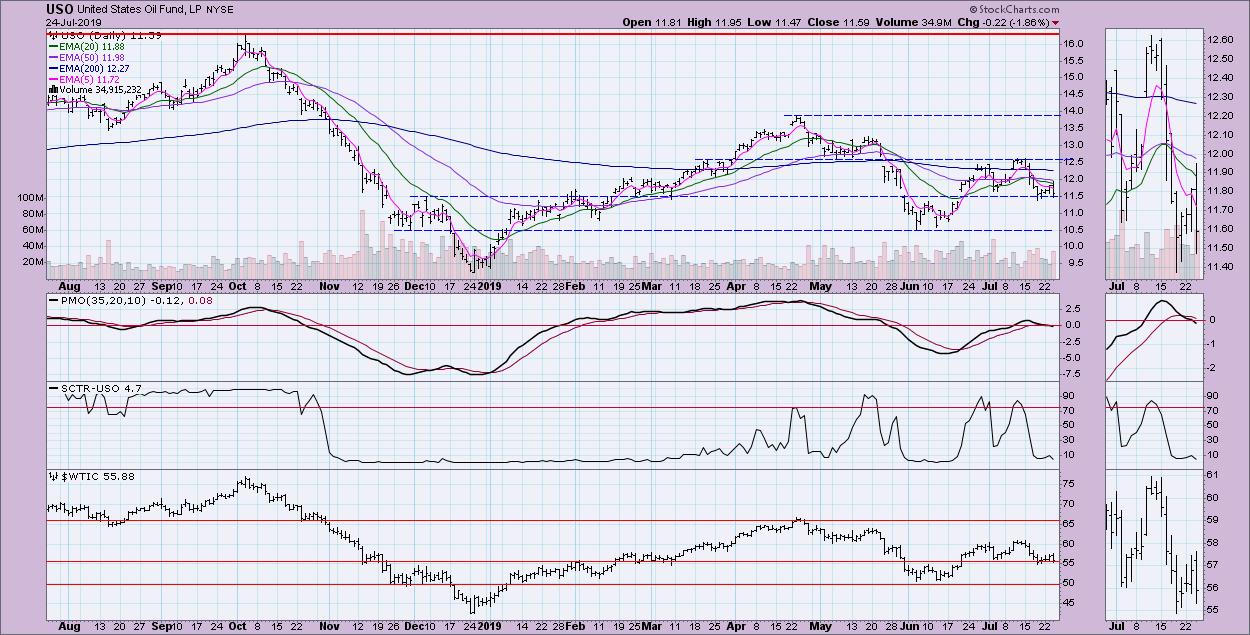
CRUDE OIL (USO)
IT Trend Model: Neutral as of 5/30/2019
LT Trend Model: SELL as of 6/4/2019
USO Daily Chart: USO has become concerning, trying to drop below short-term support. I originally thought we had a double-top in play, but price held up at support. The PMO is very bearish, not only generating a SELL signal but also dropping below the zero line. It needs to hold onto this support level, as a drop below would likely take price down to the June lows.
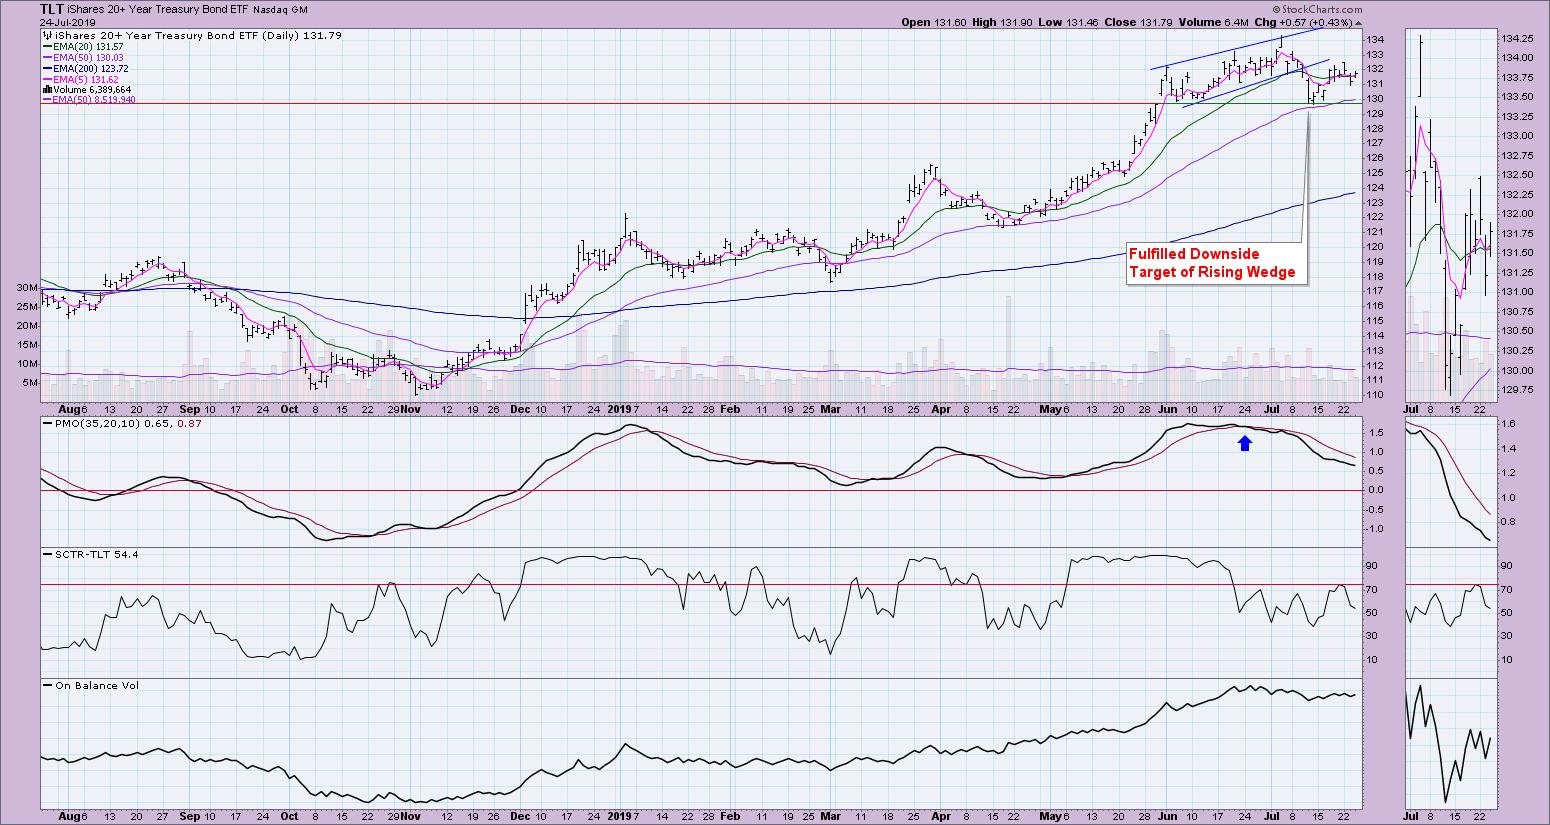
BONDS (TLT)
IT Trend Model: BUY as of 12/6/2018
LT Trend Model: BUY as of 1/2/2019
TLT Daily Chart: The declining wedge executed; price reached the expected downside target just below $130. Now, TLT seems to be struggling with the 20-EMA. The SCTR is falling and the OBV, while not particularly negative, is certainly not positive. I suspect there will be more churning around the 5/20-EMAs.
Technical Analysis is a windsock, not a crystal ball.
Happy Charting! - Erin Swenlin
Email: erinh@stockcharts.com
**Don't miss any of the DecisionPoint commentaries! Go to the "Notify Me" box toward the end of this blog page to be notified as soon as they are published.**
NOTE: The signal status reported herein is based upon mechanical trading model signals, specifically, the DecisionPoint Trend Model. They define the implied bias of the price index based upon moving average relationships, but they do not necessarily call for a specific action. They are information flags that should prompt chart review. Further, they do not call for continuous buying or selling during the life of the signal. For example, a BUY signal will probably (but not necessarily) return the best results if action is taken soon after the signal is generated. Additional opportunities for buying may be found as price zigzags higher, but the trader must look for optimum entry points. Conversely, exit points to preserve gains (or minimize losses) may be evident before the model mechanically closes the signal.
Helpful DecisionPoint Links:
DecisionPoint Shared ChartList and DecisionPoint Chart Gallery
Price Momentum Oscillator (PMO)
Swenlin Trading Oscillators (STO-B and STO-V)
