 The market has been flinging us around a lot this past week. I had been looking for a better bounce off the 200-EMA than we got; usually we use the term "dead cat" bounce, but in this case it was so small that I call it a "dead mouse" bounce. Indicators had looked fairly positive last week, but, by today, they were more pessimistic than optimistic. The drop has caused three of the four DP Scoreboard indexes to switch to Neutral in the intermediate term. Additionally, there is added "red" on the DecisionPoint Sector Scoreboard.
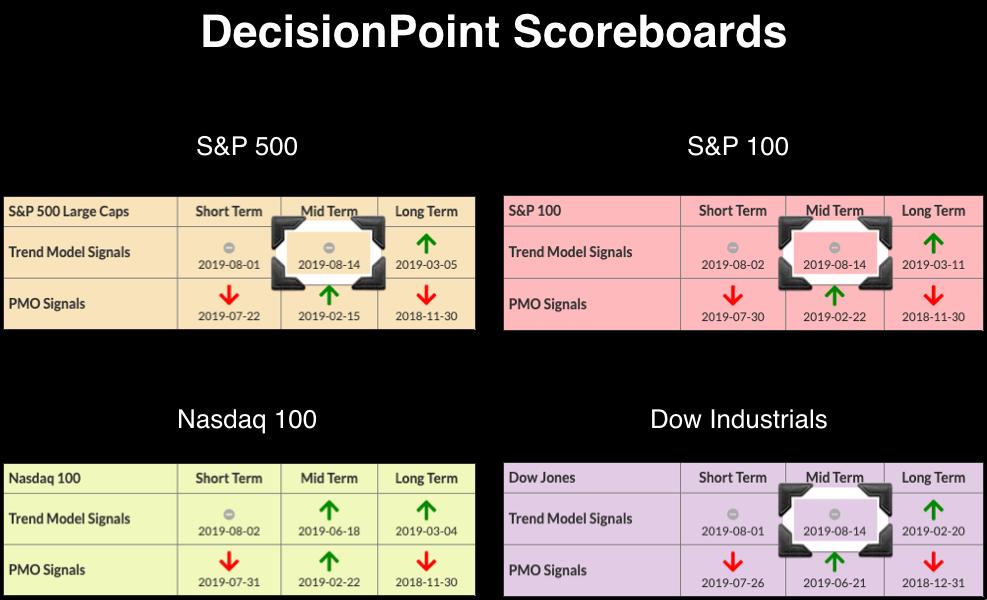
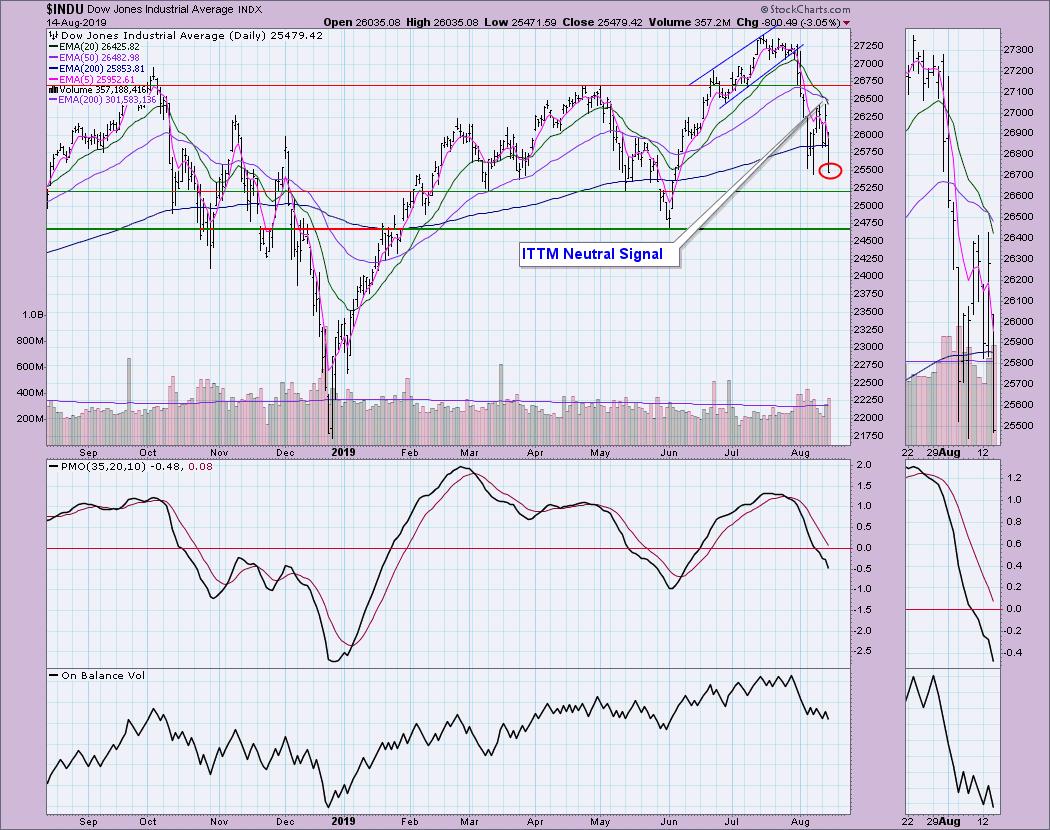
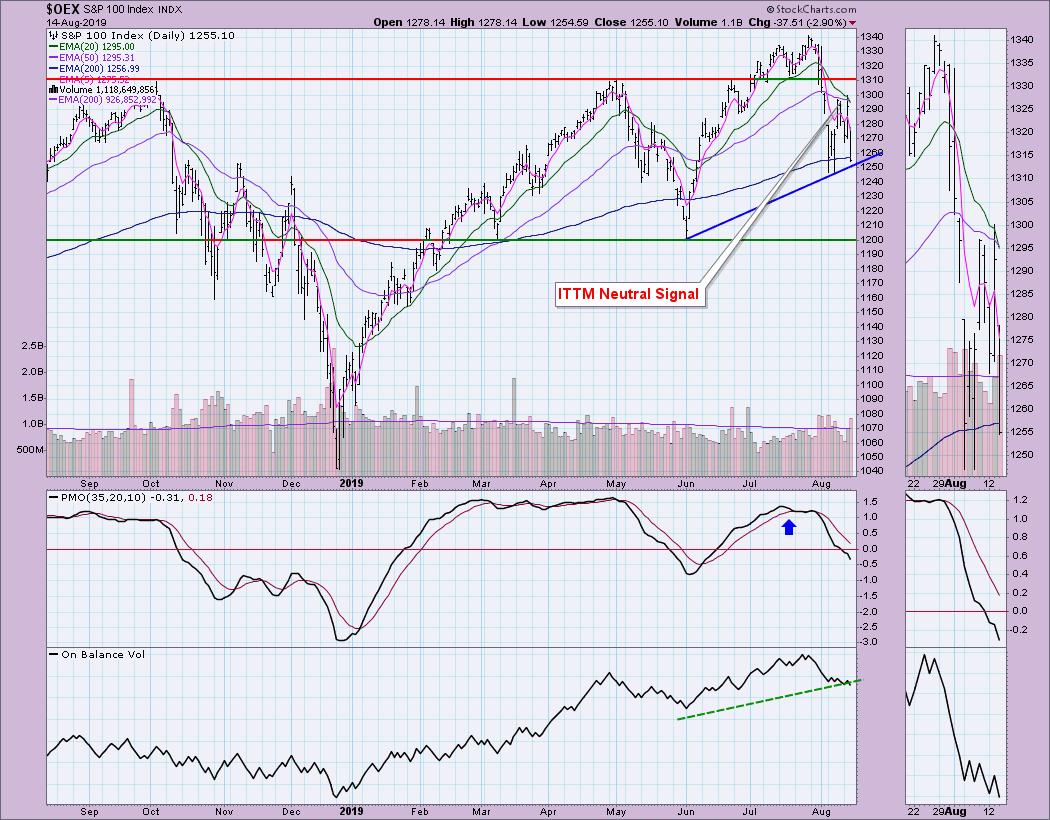
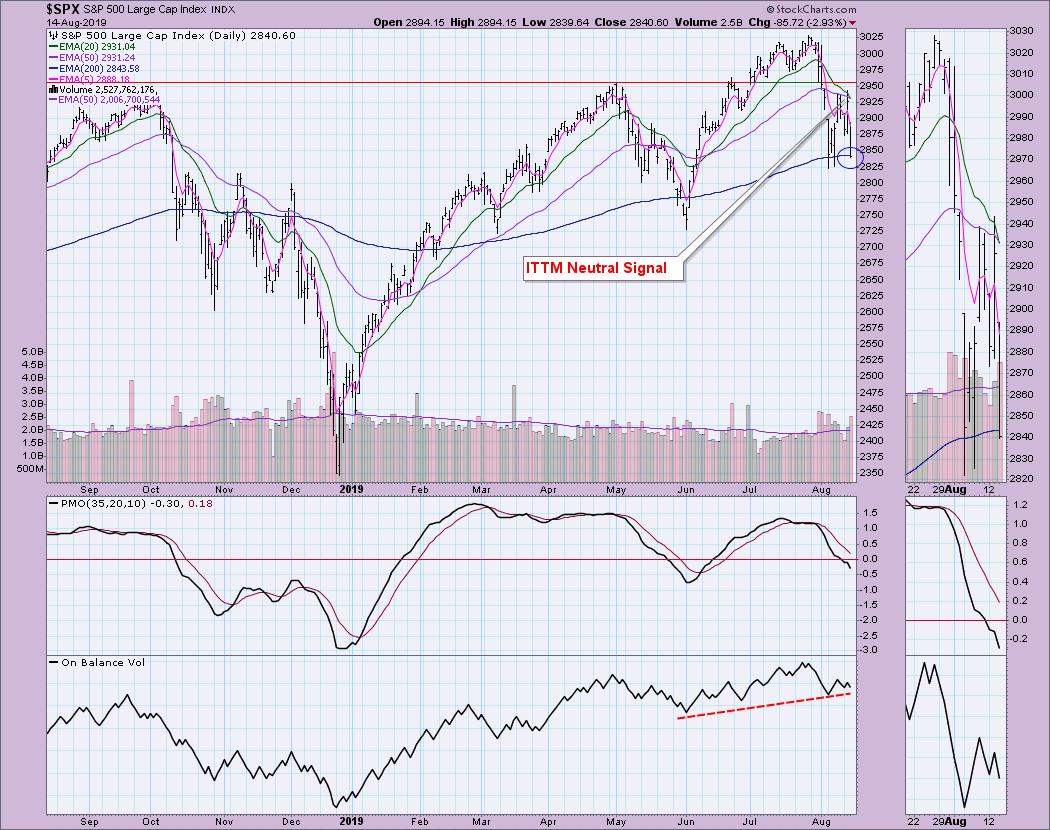
An Intermediate-Term Trend Model Neutral signal is generated when the 20-EMA crosses below the 50-EMA while the 50-EMA is above the 200-EMA. Not only did the major indexes drop below the 200-EMA, they closed well below it. These charts are discouraging, to say the least. The NDX avoided the ITTM Neutral signal for now, but it will follow shortly.
The DecisionPoint Alert presents a mid-week assessment of the trend and condition of the stock market (S&P 500), the U.S. Dollar, Gold, Crude Oil and Bonds.
Watch the latest episode of DecisionPoint on StockCharts TV's YouTube channel here!
GLOBAL MARKETS
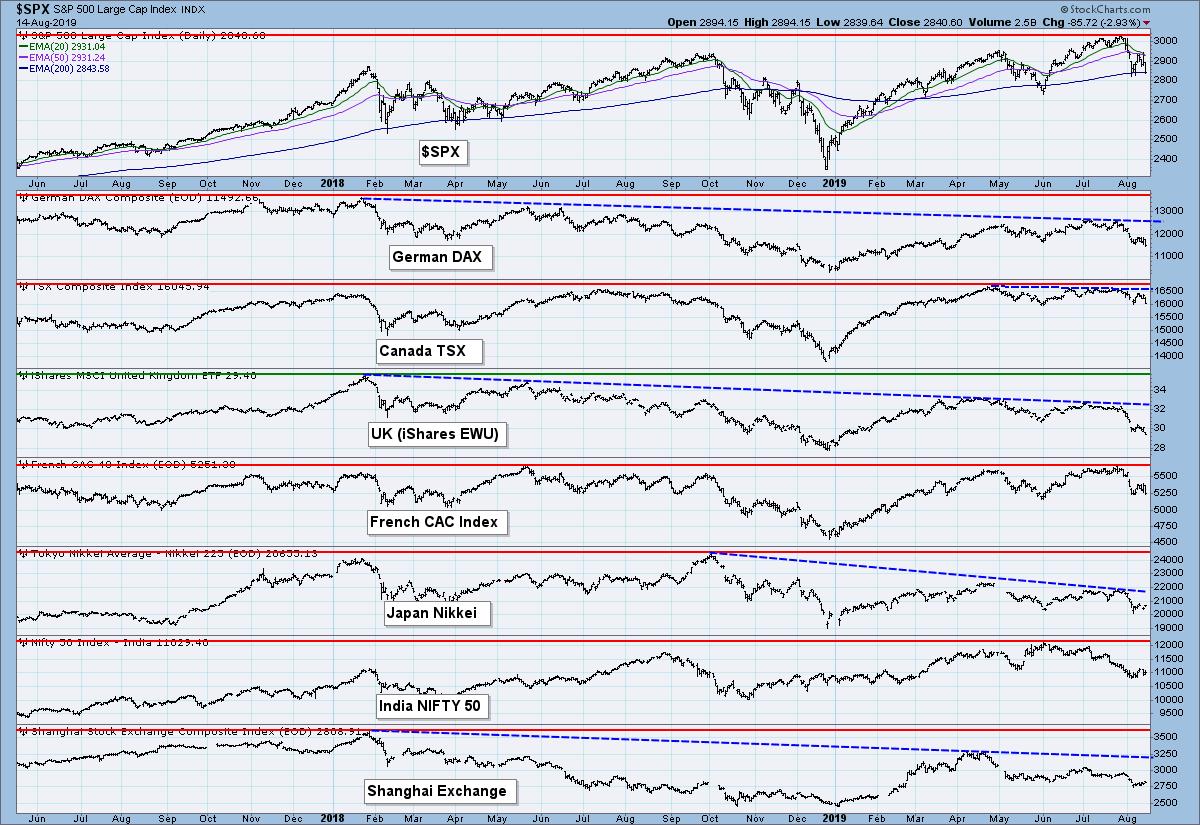
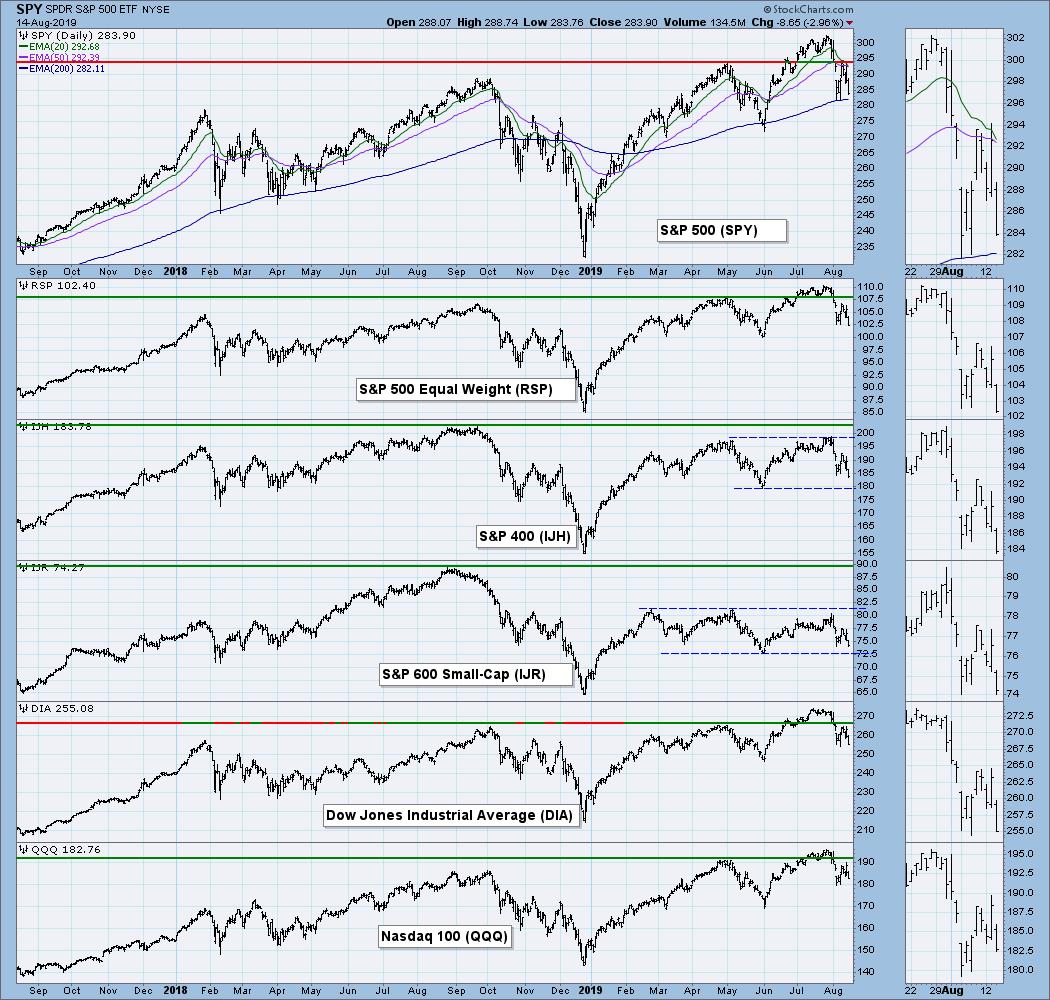
BROAD MARKET INDEXES
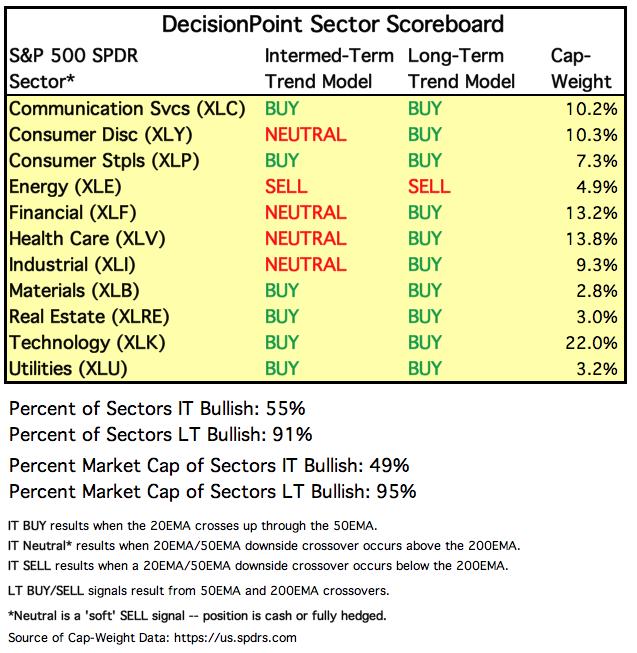
SECTORS
Each S&P 500 Index component stock is assigned to one, and only one, of eleven major sectors. This is a snapshot of the Intermediate-Term and Long-Term Trend Model signal status for those sectors.
STOCKS
IT Trend Model: BUY as of 6/11/2019
LT Trend Model: BUY (SPY) as of 2/26/2019
SPX Daily Chart: The SPX almost avoided that close below the 200-EMA. The PMO has now moved below the zero line. I would normally look for a bottom here, but the indicators below suggest more downside ahead.
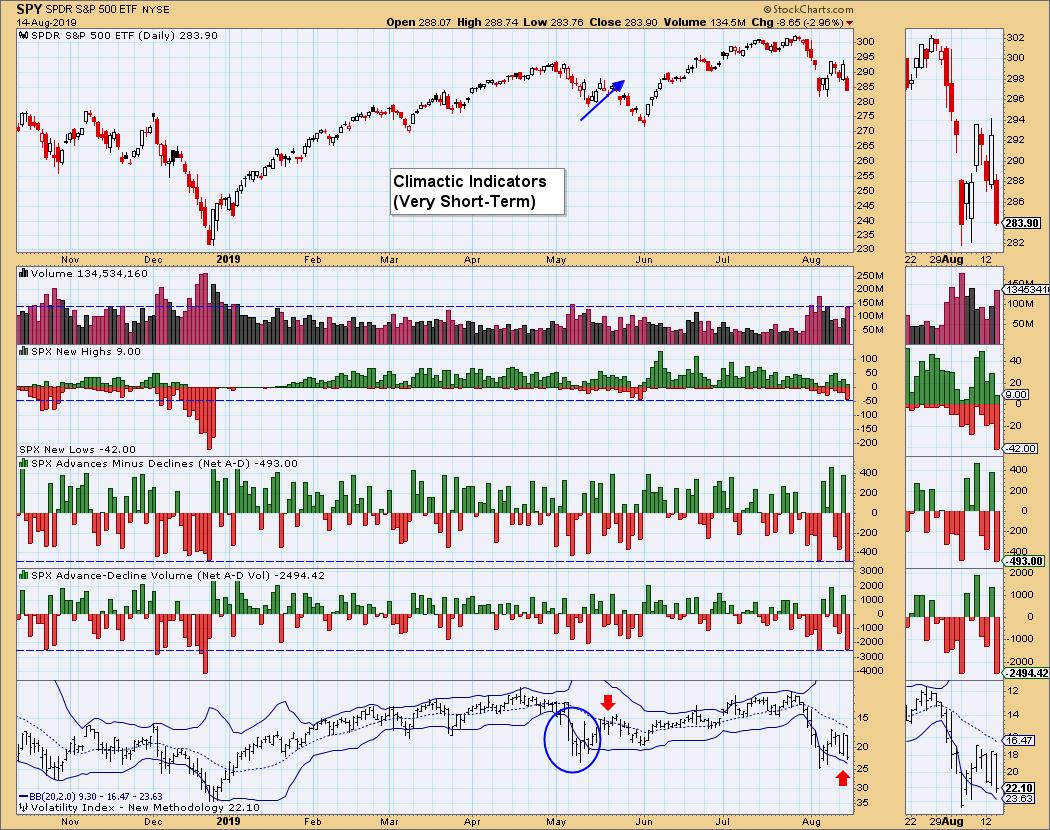
Climactic Market Indicators: We certainly saw very climactic readings today. Breadth readings are among the lowest we've seen all year long. The good news is that, generally, these lead to a market bottom, as they did previously. However, there are problems. The VIX is within the Bollinger Bands and has turned down below the average, but hasn't penetrated the lower band. We don't have enough New Lows yet either. Unfortunately, this tells me these readings are a "selling initiation," especially given yesterday's dead mouse bounce.
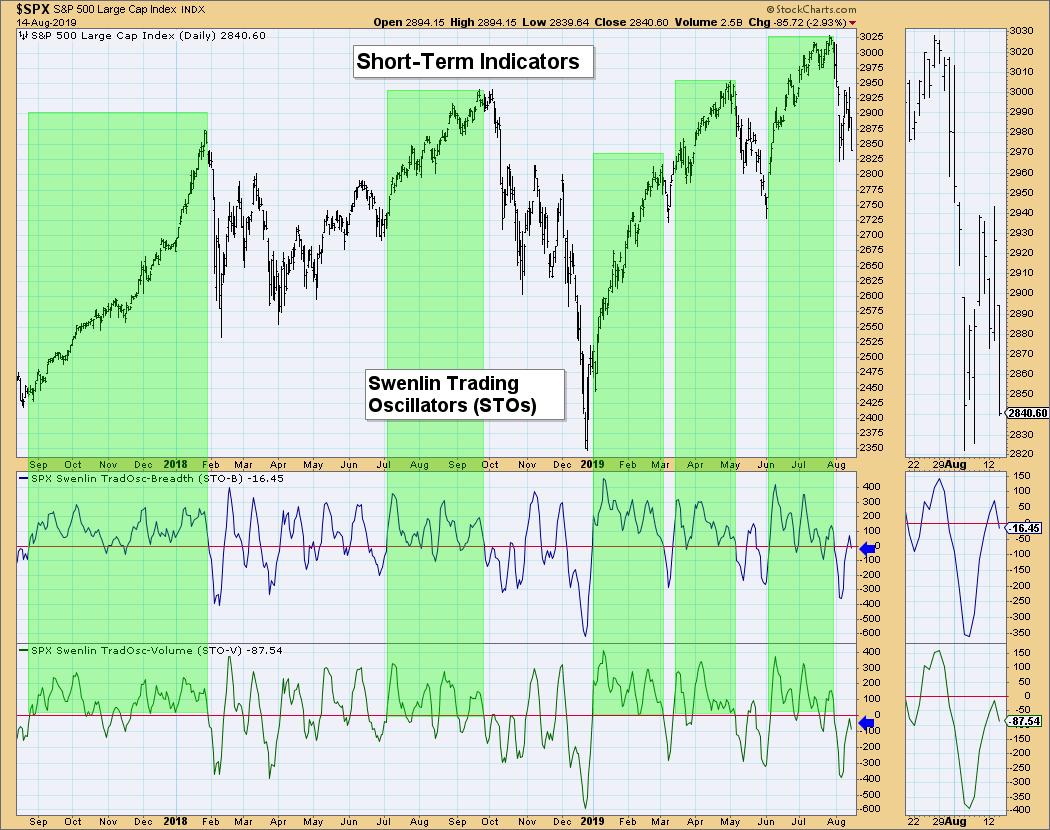
Short-Term Market Indicators: Last week, these indicators looked robust. This week, they've turned back down, with the volume oscillator turning down below the zero line. As noted in green, a rally is sustained when readings stay above the zero line.
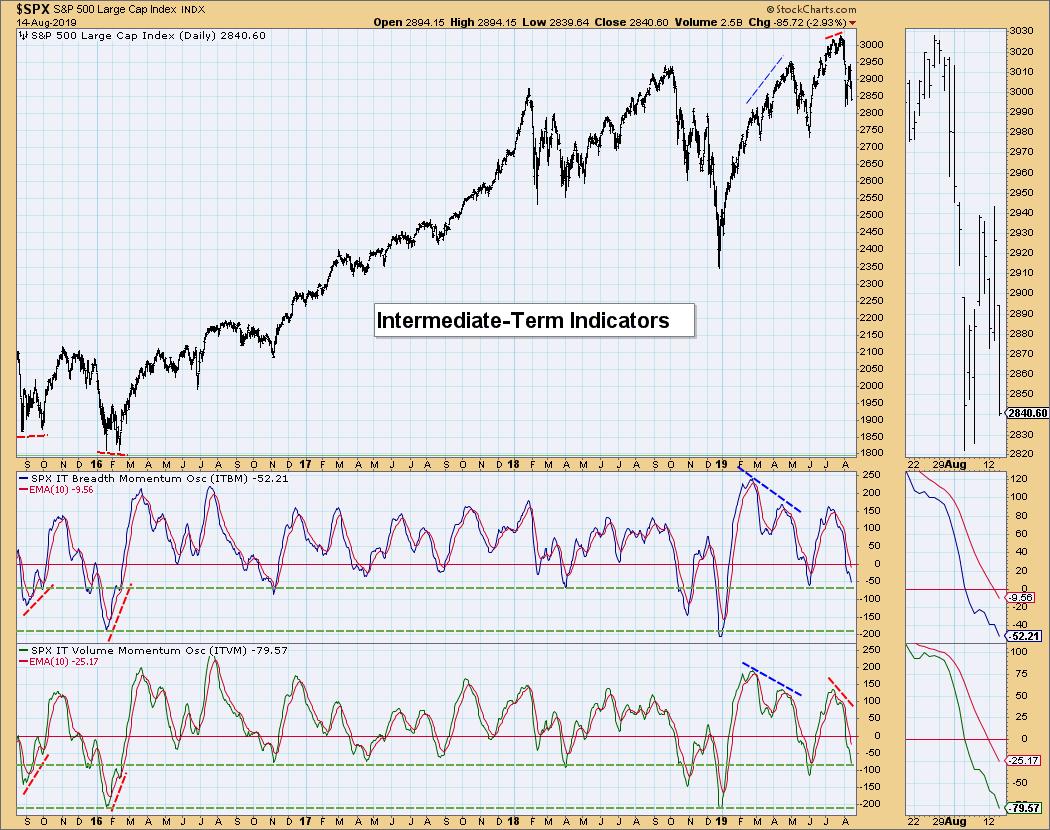
Intermediate-Term Market Indicators: Last week, these indicators were decelerating and trying to turn higher. This week, they have accelerated lower. In bull markets, the readings would be considered oversold. However, given the voracity of the price decline and the previous readings during corrections or cyclical bear markets, I expect them to move lower.
Conclusion: I had expected a rally continuation this week after the first move off the 200-EMA. The rally was very short-lived (dead mouse), providing just enough relief to suck in bulls. The market is oversold, but indicators simply are not. Climactic readings normally would suggest a reversal, but, in this case, I think they are suggesting a bit more downside.
I apologize for the delay in publishing - I'm at the Money Show this week. If you are in San Francisco, drop by the Hilton Union Square. Email me; I'd love to meet with any of my readers that happen by. My presentation with Mary Ellen McGonagle is tomorrow (8/15) at 11:30a during the Women on Wealth panel.
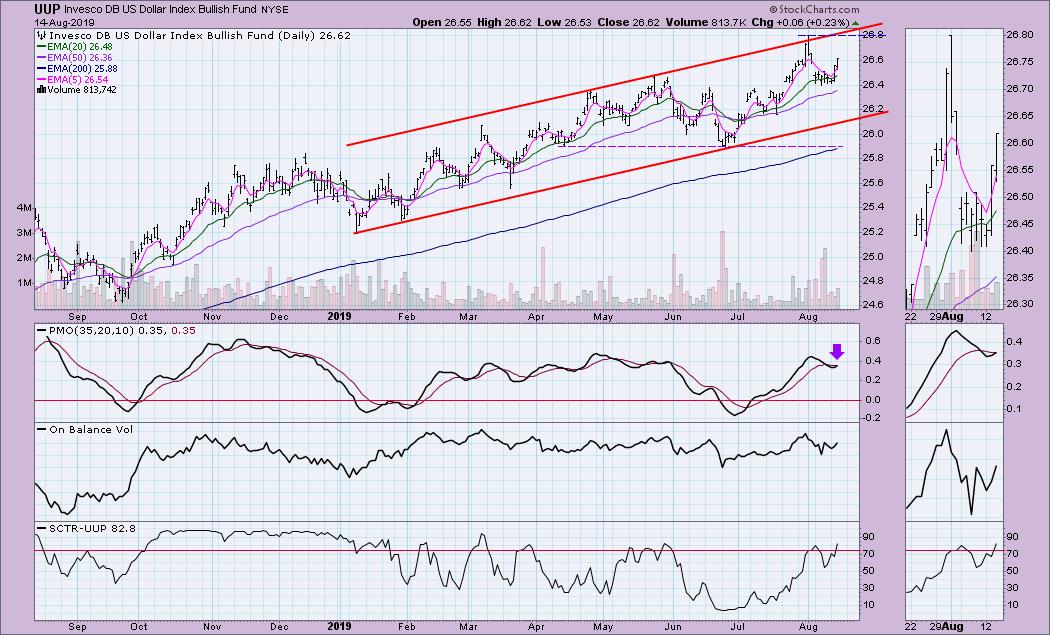
DOLLAR (UUP)
IT Trend Model: BUY as of 2/7/2019
LT Trend Model: BUY as of 5/25/2018
UUP Daily Chart: I had expected the Dollar to test the bottom of the rising trend channel. After all, price had dipped below the 20-EMA and the PMO was retreating from overbought territory. Instead, the PMO reversed and price looks ready to test the previous high.
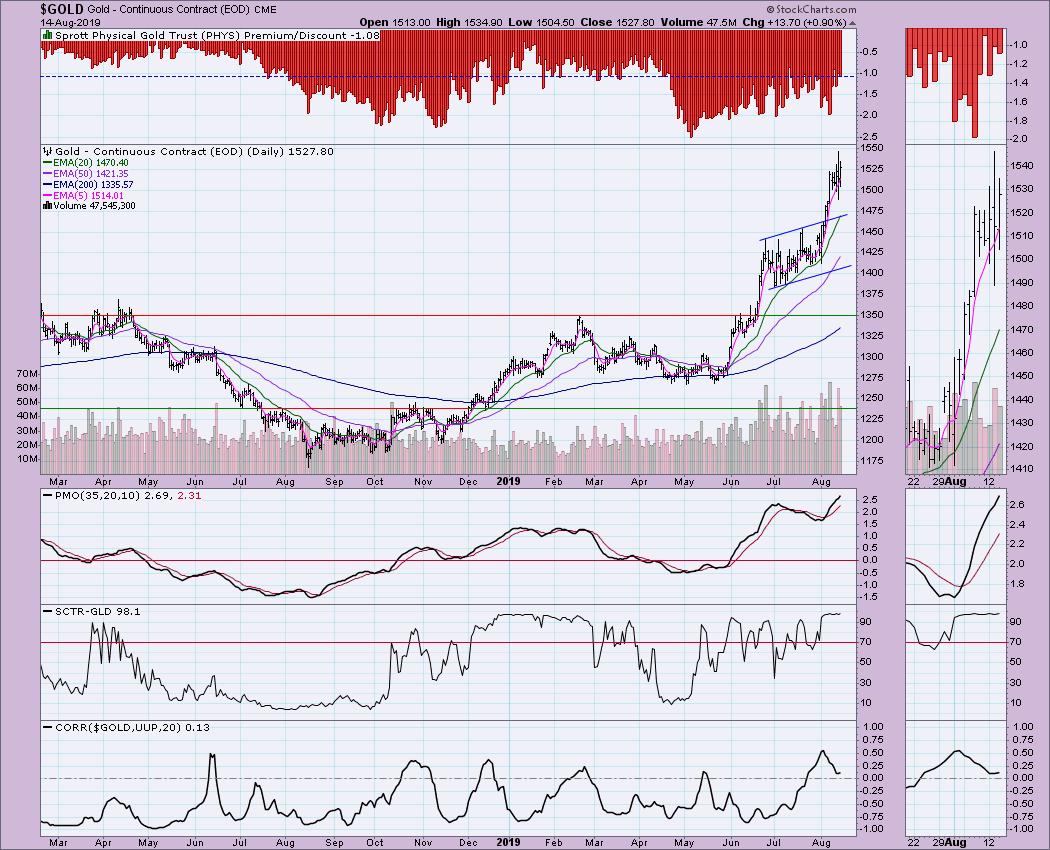
GOLD
IT Trend Model: BUY as of 6/3/2019
LT Trend Model: BUY as of 1/8/2019
GOLD Daily Chart: Generally speaking, when the Dollar rises, Gold declines. With the volatility in the market, there are more buyers, which is what is causing the lack of correlation. With a correlation near zero, what we are seeing is Gold is doing its own thing despite its relationship with the Dollar. The PMO is very overbought, but it doesn't seem at all interested in moving lower. Discounts are still somewhat high, which suggests some bearish sentiment - that's good for Gold.
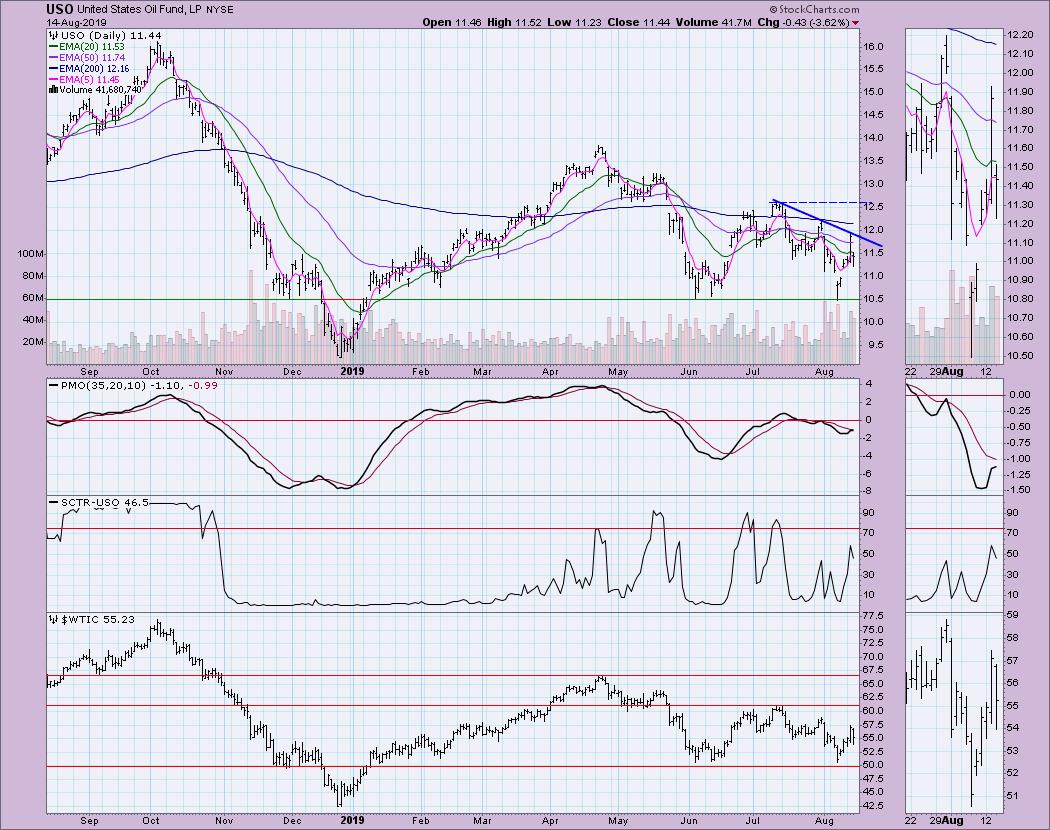
CRUDE OIL (USO)
IT Trend Model: Neutral as of 5/30/2019
LT Trend Model: SELL as of 6/4/2019
USO Daily Chart: A declining tops trend line is holding strongly. We saw an earlier island reversal. If it can hold gap support at $11.10, I'd look for an upside reversal to at least challenge the declining trend.
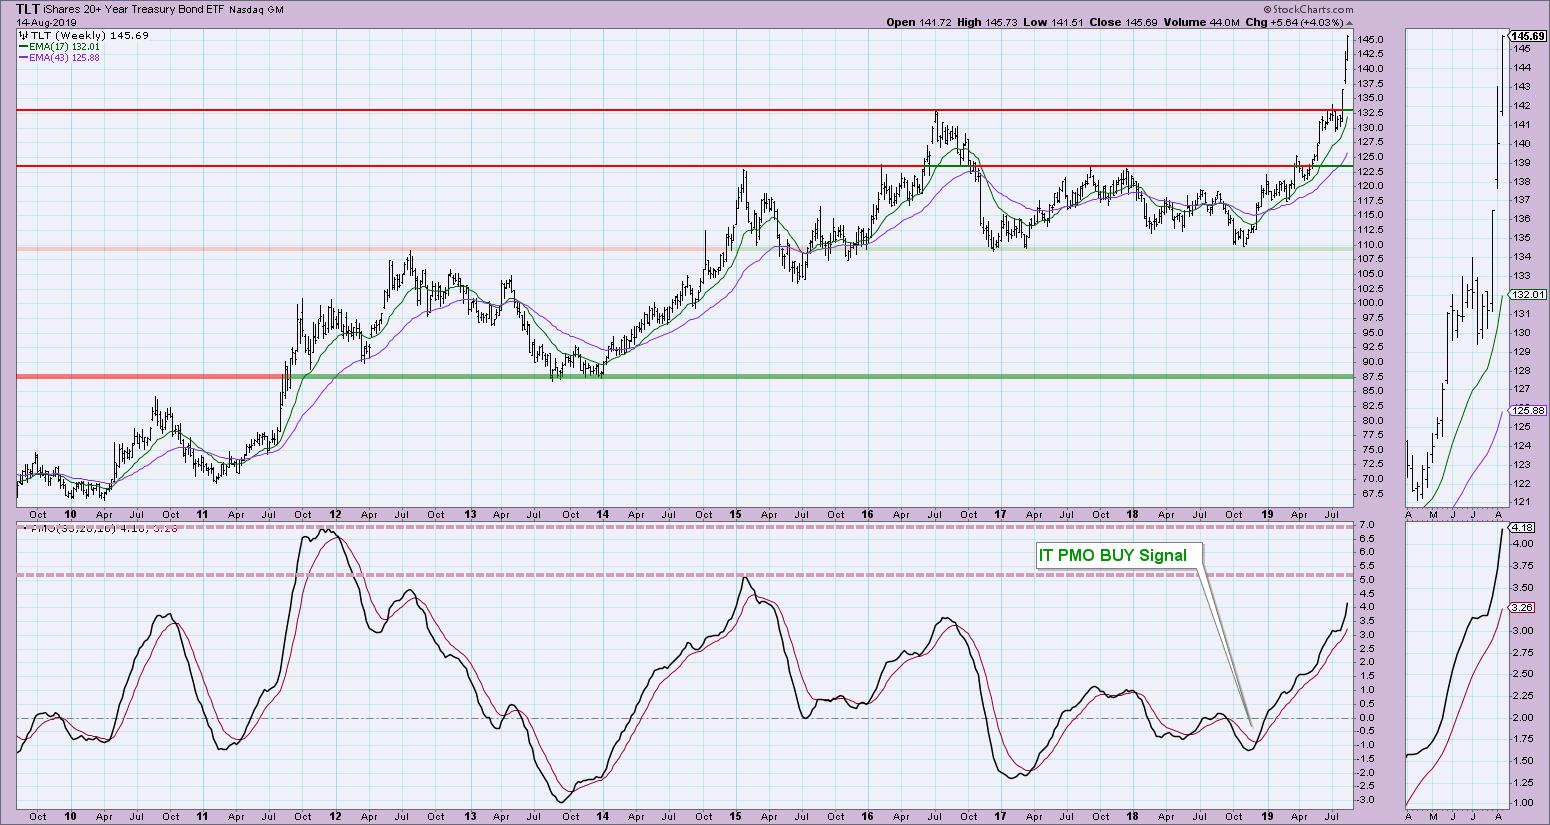
BONDS (TLT)
IT Trend Model: BUY as of 12/6/2018
LT Trend Model: BUY as of 1/2/2019
TLT Daily Chart: Again, I am using a weekly chart for TLT. Price has risen vertically and doesn't look like it will slow down. Like Gold, many move toward Bonds for safety in volatile times. I wouldn't get in now as it would be "chasing." I'd expect a pullback here soon, which might be a good time. That said, the strongly rising PMO is not at all overbought, so it could potentially keep rising.
Technical Analysis is a windsock, not a crystal ball.
Happy Charting! - Erin
Email: erinh@stockcharts.com
**Don't miss any of the DecisionPoint commentaries! Go to the "Notify Me" box toward the end of this blog page to be notified as soon as they are published.**
NOTE: The signal status reported herein is based upon mechanical trading model signals, specifically, the DecisionPoint Trend Model. They define the implied bias of the price index based upon moving average relationships, but they do not necessarily call for a specific action. They are information flags that should prompt chart review. Further, they do not call for continuous buying or selling during the life of the signal. For example, a BUY signal will probably (but not necessarily) return the best results if action is taken soon after the signal is generated. Additional opportunities for buying may be found as price zigzags higher, but the trader must look for optimum entry points. Conversely, exit points to preserve gains (or minimize losses) may be evident before the model mechanically closes the signal.
Helpful DecisionPoint Links:
DecisionPoint Shared ChartList and DecisionPoint Chart Gallery
Price Momentum Oscillator (PMO)
Swenlin Trading Oscillators (STO-B and STO-V)
