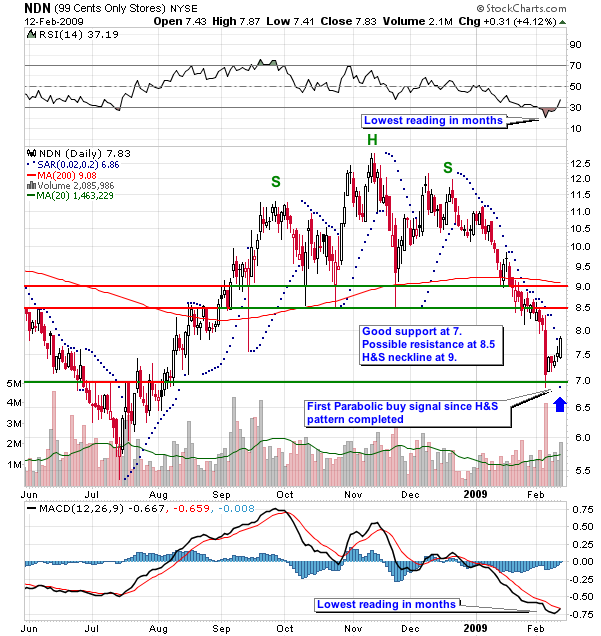
NDN has been falling after completing a classic Head & Shoulders chart pattern back in January. Today was the first set of positive technical signals for the stock in quite a while - a bullish MACD crossover, a rising RSI line and a bullish Parabolic SAR signal. While all of these signals can be premature, when combined with three up days after what looks like an exhaustion sell off, the odds of a turnaround taking hold increase.
While I have no idea what will happen with this particular stock in the coming days, this is a good example of the kind of technical setup that all technical traders search for. Each trader's setup will be different, but most will contain elements of technical indicator crossovers, support and resistance analysis, chart pattern identification and volume study.

About the author:
Chip Anderson is the founder and president of StockCharts.com.
He founded the company after working as a Windows developer and corporate consultant at Microsoft from 1987 to 1997.
Since 1999, Chip has guided the growth and development of StockCharts.com into a trusted financial enterprise and highly-valued resource in the industry.
In this blog, Chip shares his tips and tricks on how to maximize the tools and resources available at StockCharts.com, and provides updates about new features or additions to the site.
Learn More