Don't Ignore This Chart! June 30, 2009 at 02:26 PM
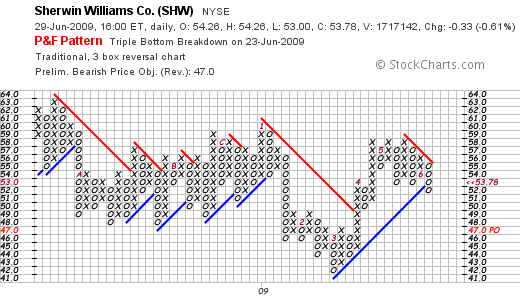
From the PnF scans comes Sherwin Williams (SHW) with a clear break below the May lows. On the PnF chart, you can see the number 5 to denote the start of May and then two reaction lows... Read More
Don't Ignore This Chart! June 29, 2009 at 05:53 PM
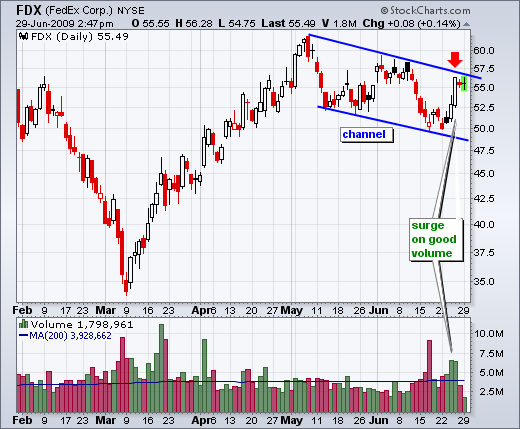
After surging on good volume, FedEx (FDX) hit channel resistance around 57. Notice that FDX peaked in early May and then worked its way lower the last eight weeks. This series of lower lows and lower highs defines the channel, which is also an 8-week downtrend... Read More
Don't Ignore This Chart! June 26, 2009 at 12:33 PM
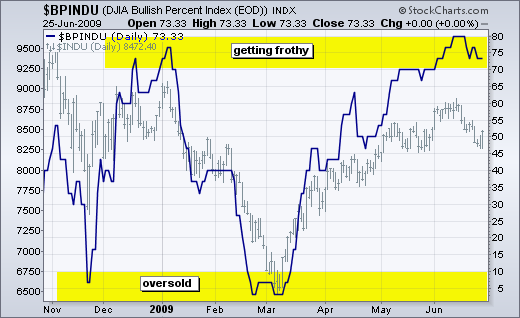
The DJIA Bullish Percent Index ($BPINDU) moved above 70% in June and remains at lofty levels. Mid December and early January were the last two occasions above 70%. Currently, 73% of the Dow stocks (30) are on Point & Figure buy signals... Read More
Don't Ignore This Chart! June 25, 2009 at 01:08 PM
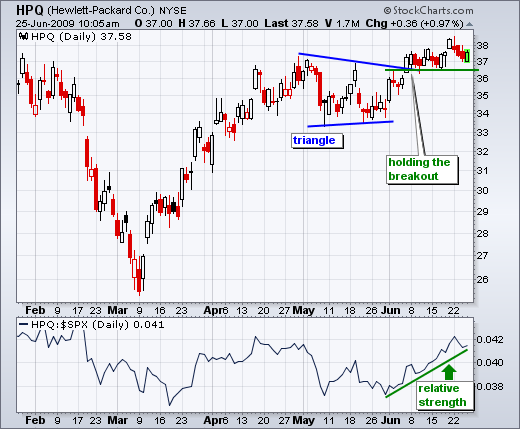
While the S&P 500 took a hit in June, Hewlett-Packard (HPQ) managed to hold its breakout and stay relatively strong. HP broke triangle resistance in early June. Broken resistance then turned into support the last three weeks... Read More
Don't Ignore This Chart! June 24, 2009 at 04:45 PM
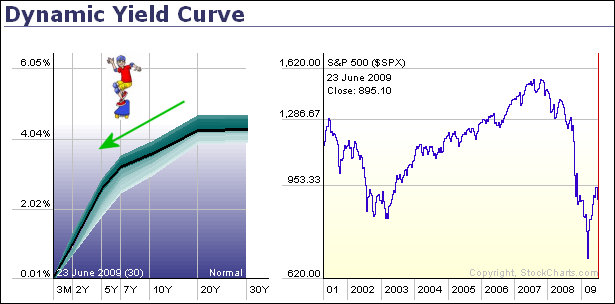
A static shot of the dynamic yield curve reveals a curve steep enough to temp a skateboarder. As this curve shows, interest rates start low at the short end and rise as the maturities lengthen... Read More
Don't Ignore This Chart! June 23, 2009 at 07:30 PM
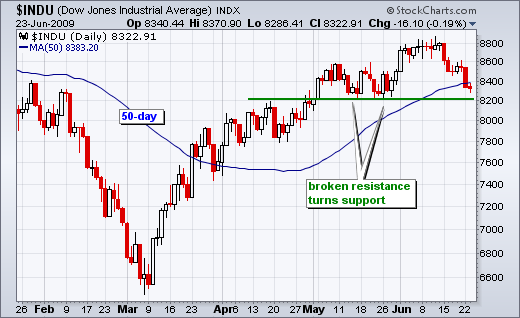
The Dow Industrials is testing support around 8200. A key tenet of technical analysis is that broken resistance turns into support. After breaking 8200 in early May and this level turned into support twice in May... Read More
Don't Ignore This Chart! June 22, 2009 at 04:45 PM
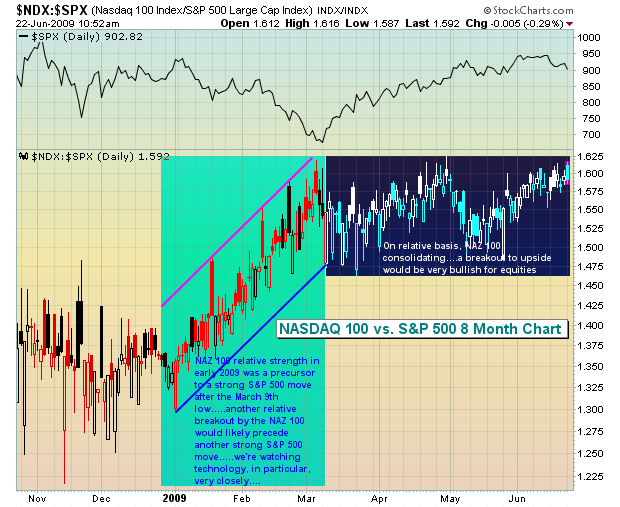
The tech-laden NASDAQ 100 showed considerable relative strength prior to the market bottom in March 2009. Should the NDX:SPX relative ratio break above 1.625, I believe it could lead to additional market strength. -Tom Bowley Join Tom and the Invested Central Team at www... Read More
Don't Ignore This Chart! June 22, 2009 at 02:25 PM
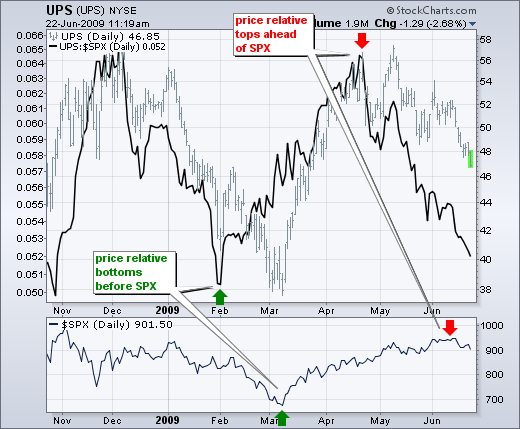
UPS is a key part of the Dow Transports and perhaps a leading indicator for the stock market. Notice how the price relative (UPS:$SPX ratio) bottomed ahead of the stock market in March. UPS started showing relative strength before the actual market bottom... Read More
Don't Ignore This Chart! June 19, 2009 at 12:51 PM
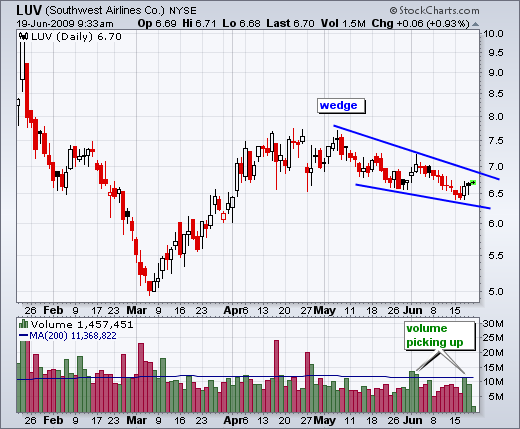
After surging in March-April, SW Airlines (LUV) went into corrective mode with a falling wedge in May-June. This wedge is still falling, but volume on up days is starting to increase... Read More
Don't Ignore This Chart! June 18, 2009 at 08:09 PM
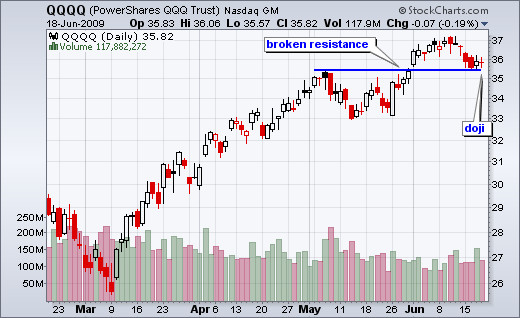
The Nasdaq 100 ETF (QQQQ) formed a doji on Thursday to signal indecision at support. Doji look like plus signs because there is little change from open to close. In addition, notice that QQQQ closed in the middle of its high-low range... Read More
Don't Ignore This Chart! June 17, 2009 at 06:56 PM
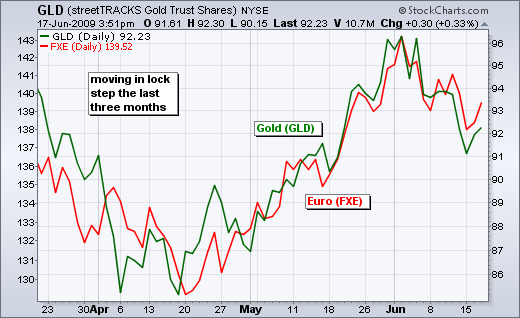
The Euro ETF (FXE) and the Gold ETF (GLD) have been moving step-for-step over the last three months... Read More
Don't Ignore This Chart! June 16, 2009 at 01:50 PM
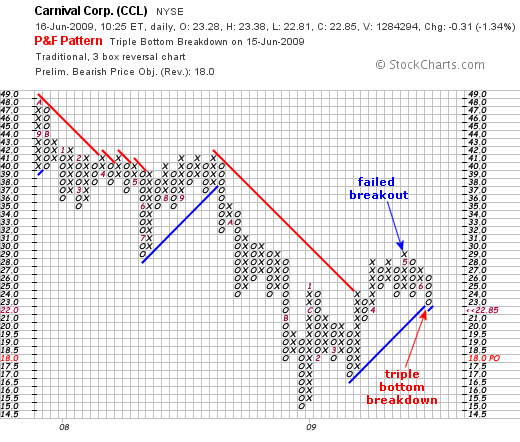
Carnival Corp (CCL) came up on the Triple Bottom Breakdown scan. After failing to hold its May breakout (blue arrow), the stock broke support with a sharp decline in June. You can probably see some other patterns at work here as well... Read More
Don't Ignore This Chart! June 12, 2009 at 02:16 PM
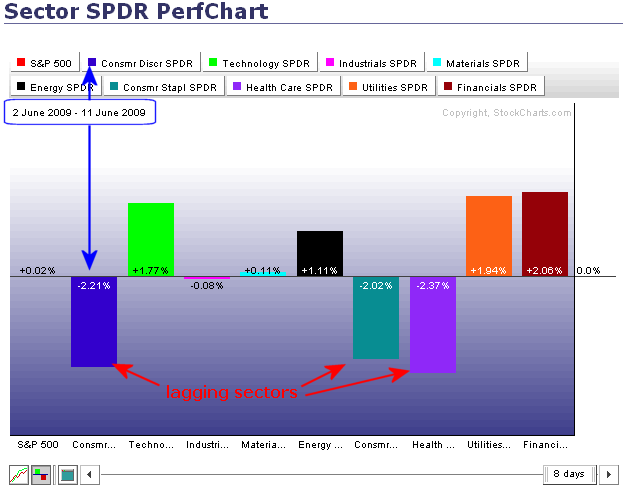
The S&P Sector PerfChart from 2-June until 11-June shows the consumer staples, healthcare and consumer discretionary sectors lagging the broader market. Each is down over 2%, while the S&P 500 is up .02% (a fraction) over this timeframe... Read More
Don't Ignore This Chart! June 11, 2009 at 07:52 PM
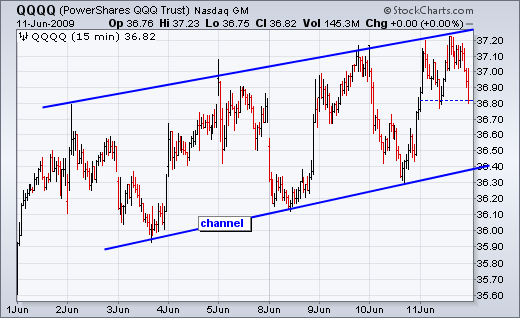
June has been one choppy month, but the Nasdaq 100 ETF (QQQQ) continues to work its way higher within a rising channel... Read More
Don't Ignore This Chart! June 10, 2009 at 04:57 PM

The semiconductor group has been very influential during the recent rally. In fact, the SOX has been outperforming the S&P 500 since late in 2008. A key relative resistance area has been approached, however... Read More
Don't Ignore This Chart! June 10, 2009 at 12:35 PM
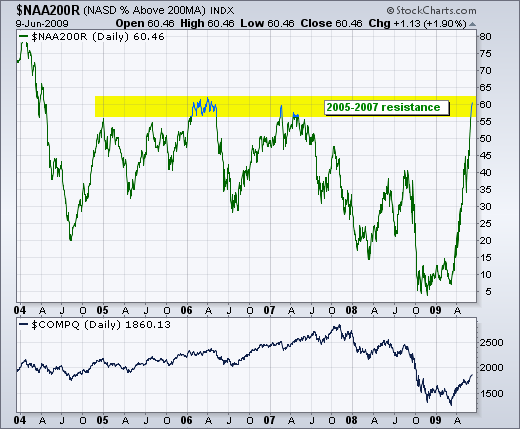
The percentage of Nasdaq stocks that are trading above their 200-day moving average reached its highest level since early 2006. As the chart below shows, fewer than 10% of Nasdaq stocks were trading above their 200-day moving average in March. With the March-June rally, 60... Read More
Don't Ignore This Chart! June 09, 2009 at 12:34 PM
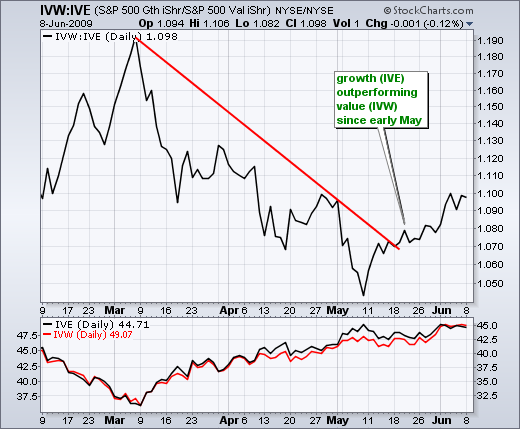
As the price relative below shows, the S&P 500 Growth ETF (IVW) is outperforming the S&P 500 Value ETF (IVE). The price relative is simply a plot of the IVW:IVE ratio (enter IVW:IVE for the symbol)... Read More
Don't Ignore This Chart! June 08, 2009 at 05:22 PM
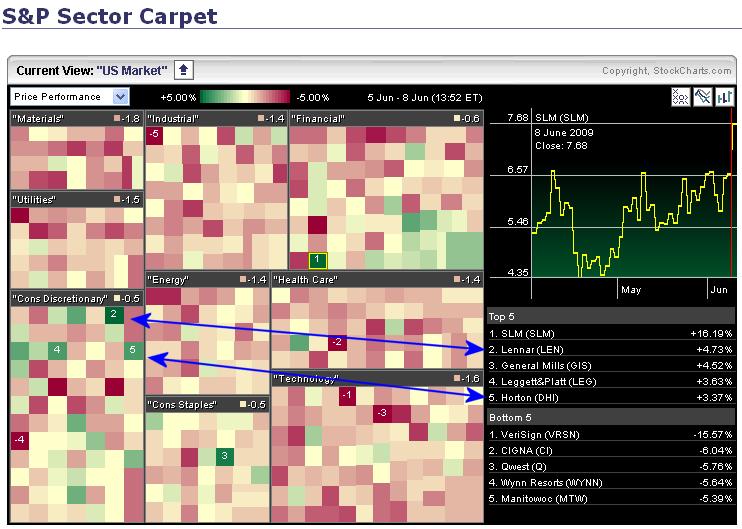
Even though the major stock indices were trading sharply lower on Monday afternoon, a few of the homebuilders showed nice gains. The gainers are easy to spot using the S&P Sector Carpet... Read More
Don't Ignore This Chart! June 05, 2009 at 12:00 PM
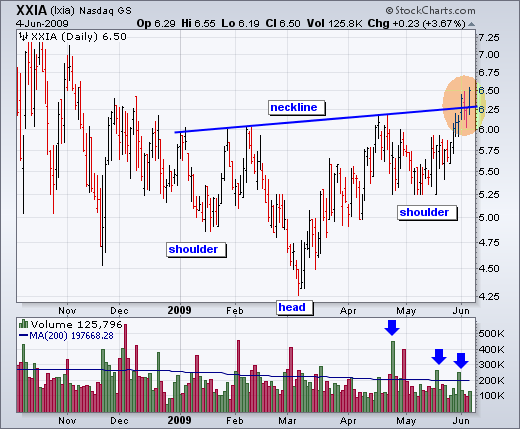
As its name implies, an inverse head-and-shoulders is an upside down version of the normal head-and-shoulders. Ixia (XXIA) has a one such pattern with a neckline breakout this week... Read More
Don't Ignore This Chart! June 04, 2009 at 01:17 PM
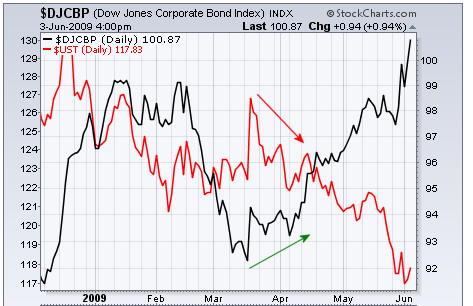
Investors are showing a clear preference for corporate bonds over treasury bonds. The chart below shows the 10-Year US Treasury Note ($UST) and the DJ Corporate Bond Index ($DJCBP) going their separate ways since March... Read More
Don't Ignore This Chart! June 03, 2009 at 08:55 AM
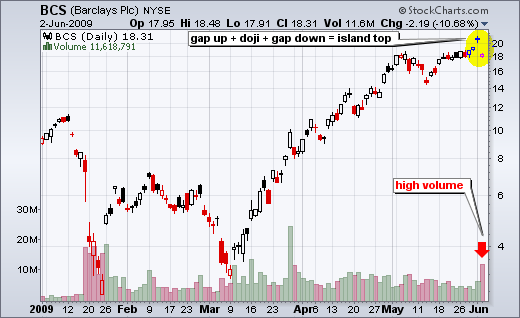
Barclays Plc (BCS) came across the island top scan from Tuesday's close. Notice how the stock gapped up, held the gap for one day with a doji and then gapped down with high volume on Tuesday. The doji represents an island where buyers are now trapped with a loss... Read More
Don't Ignore This Chart! June 02, 2009 at 02:06 PM
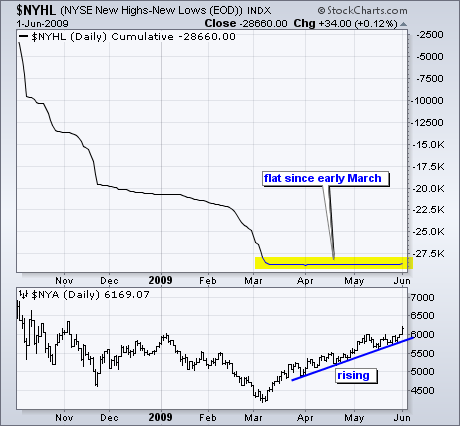
Even though stocks have been rising since early March, the cumulative Net New Highs indicator has been flat since early March. This shows a virtual stalemate between new 52-week highs and new 52-week lows. Obviously, the market can rally with a stalemate... Read More
Don't Ignore This Chart! June 01, 2009 at 06:59 PM
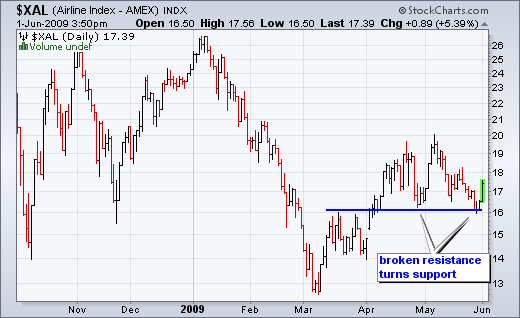
The Amex Airline Index ($XAL) surged around 5% with a big move off support on Monday. Notice how broken resistance around 16 turned into support in late April and again in May... Read More