Don't Ignore This Chart! September 30, 2009 at 01:18 PM
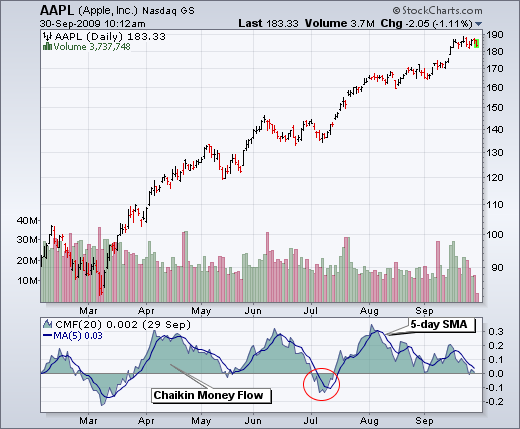
Chaikin Money Flow for Apple (AAPL) has been positive from mid July to late September. There was a brief dip into negative territory last week, but Chaikin Money Flow recovered on Monday... Read More
Don't Ignore This Chart! September 29, 2009 at 09:05 PM
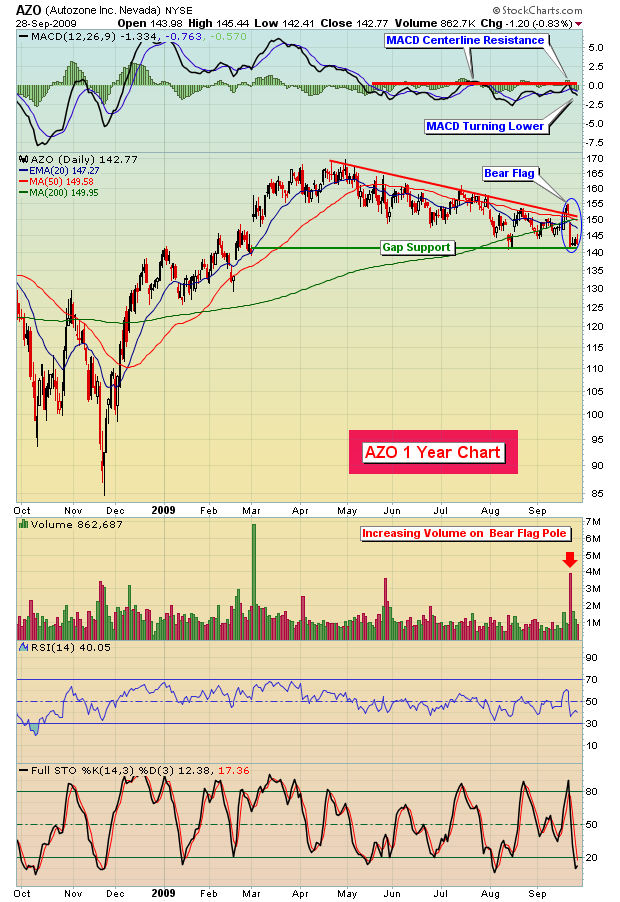
Autozone (AZO) is setting up rather bearishly in a bear flag formation. Divergences on the MACD within the retail space are weak at best and AZO has been a relative underperformer with its MACD unable to climb above the centerline, one of the few stocks having that difficulty... Read More
Don't Ignore This Chart! September 29, 2009 at 12:18 PM
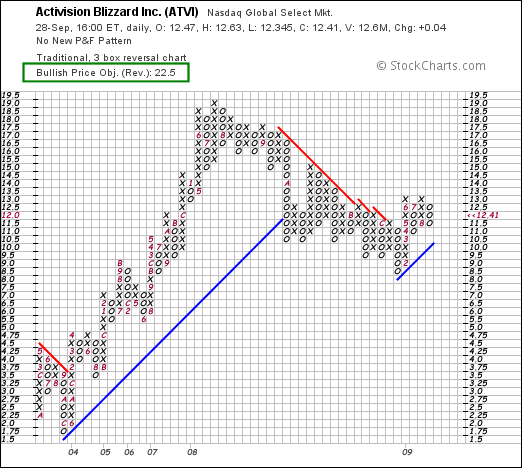
This long-term PnF chart for Activision extends back to 2003 when the stock was trading in the low single digits. After rising above 19, the stock went into corrective mode in 2008 and broke out in 2009... Read More
Don't Ignore This Chart! September 28, 2009 at 09:03 PM
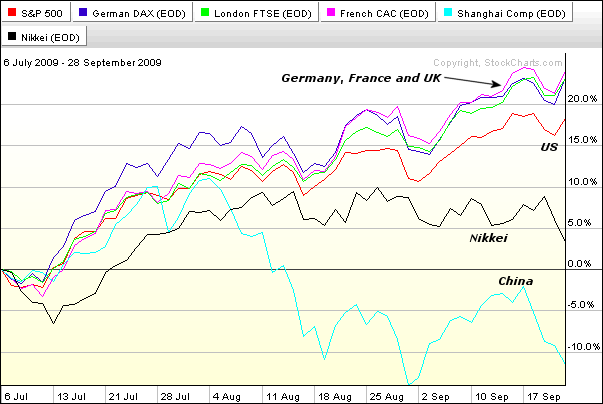
Since early July, the Shanghai Composite ($SSEC) and the Nikkei 225 ($NIKK) have been lagging western European stock markets and the US. The PerfChart below shows the Shanghai Composite is actually down since July and the Nikkei is barely positive... Read More
Don't Ignore This Chart! September 25, 2009 at 01:05 PM
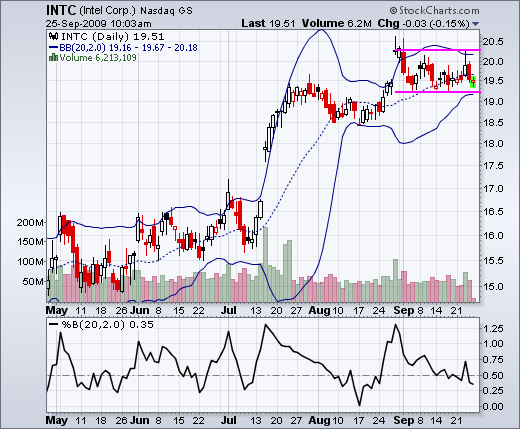
Bollinger Bands have been contracting as Intel (INTC) consolidates over the last few weeks. The theory behind Bollinger Bands is that volatility contractions often give way to volatility expansions. Look for a range break to trigger the next directional signal... Read More
Don't Ignore This Chart! September 24, 2009 at 09:10 AM
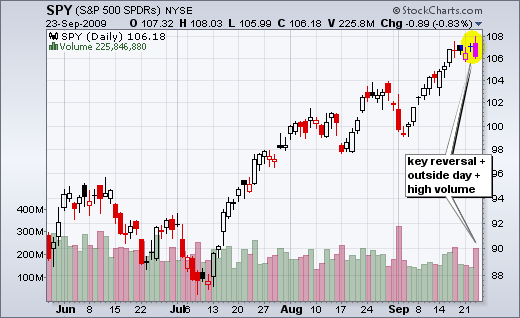
The bears were given something to chew on with an outside reversal day for SPY. First, a reversal formed when Wednesday's high was above Tuesday's high and Wednesday's close was below Tuesday's close... Read More
Don't Ignore This Chart! September 23, 2009 at 01:16 PM
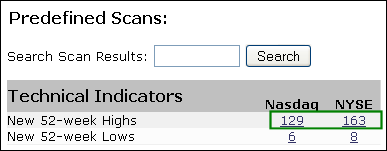
The predefined scan page provides a quick glimpse of underlying strength or weakness in the stock market. At the top of this page, new 52-week highs are comfortably outpacing new 52-week lows. Click the number (129 Nasdaq and 163 NYSE) to see a list of market leading stocks... Read More
Don't Ignore This Chart! September 22, 2009 at 01:42 PM
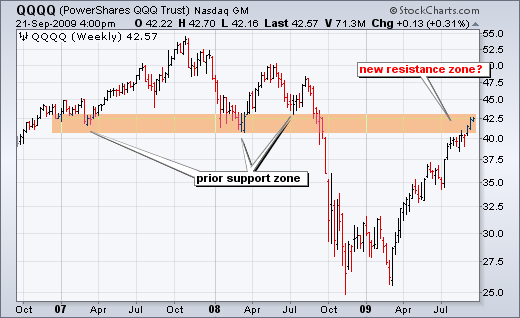
Broken support turns into resistance. This basic tenet of technical analysis will be getting a test as the Nasdaq 100 ETF (QQQQ) reached broken support. For now, I would consider this "potential" resistance because the trend since March is clearly up... Read More
Don't Ignore This Chart! September 21, 2009 at 12:41 PM
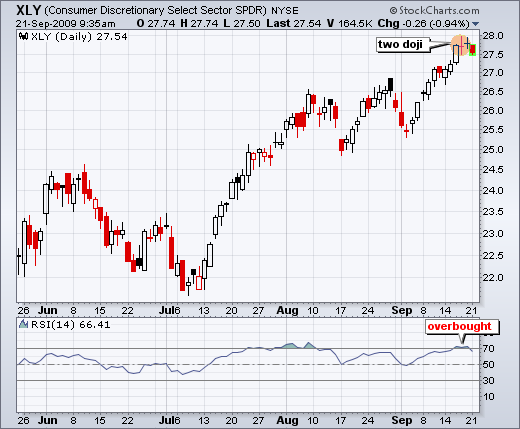
The Consumer Discretionary SPDR (XLY) surged over 10% this month and then stalled with two doji at the end of last week. These candlesticks signal indecision that can foreshadow a short-term pullback... Read More
Don't Ignore This Chart! September 18, 2009 at 11:45 AM
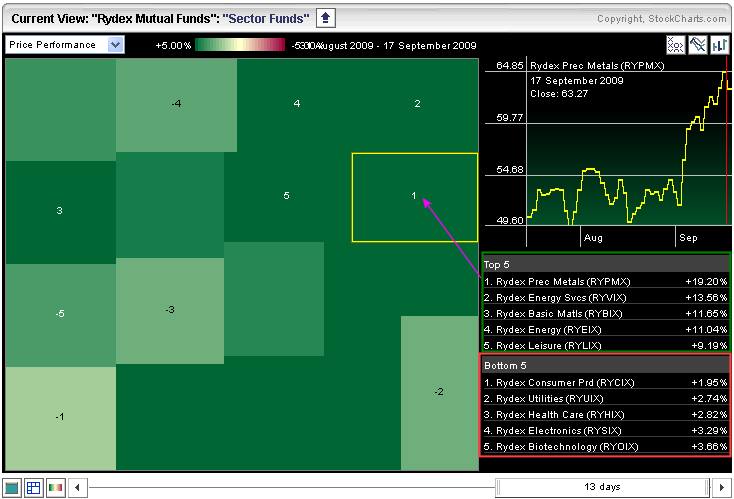
The Rydex Mutual Funds Market Carpet focuses on the 17 sector funds. September is all about hard assets. The leading sector funds are precious metals, energy services, basic materials and energy. Consumer produces, utilities and healthcare show the smallest gains... Read More
Don't Ignore This Chart! September 17, 2009 at 01:47 PM
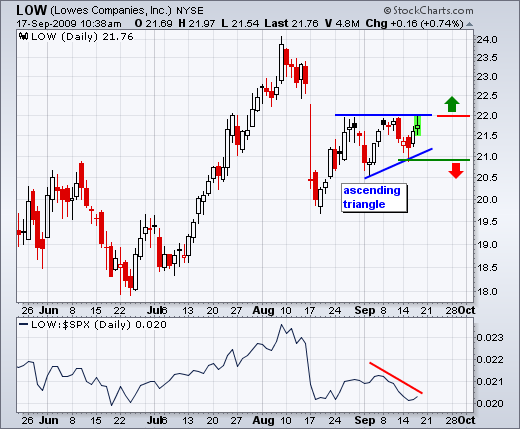
While the stock market moved higher the last two weeks, Lowe's (LOW) failed to break above resistance at 22 and showed relative weakness. A potentially bullish ascending triangle is taking shape, but a breakout is needed for confirmation... Read More
Don't Ignore This Chart! September 16, 2009 at 02:41 PM
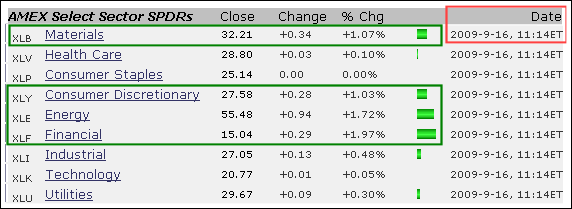
A look at the Market Summary page on Wednesday, September 16th, at 11:14AM ET shows a bullish start for some key sector SPDRs. The Materials SPDR (XLB), Consumer Discretionary SPDR (XLY), Energy SPDR (XLE) and Financials SPDR (XLF) are all up over 1% in early trading... Read More
Don't Ignore This Chart! September 15, 2009 at 02:06 PM
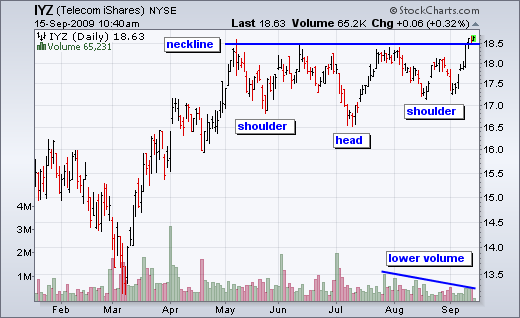
The iShares Telecom ETF (IYZ) is challenging neckline resistance of an inverse head-and-shoulders pattern. The head-and-shoulders represents a big consolidation and the break to new highs is positive. However, declining volume on the Aug-Sep advance is a concern... Read More
Don't Ignore This Chart! September 14, 2009 at 05:34 PM
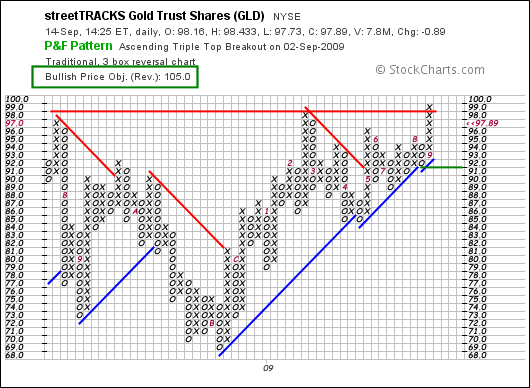
The Point&Figure chart for the Gold ETF (GLD) is bullish with an upside target at 105. PnF Charts at Stockcharts.com show bullish or bearish price objectives above the chart on the left. GLD broke above its prior highs and clearly shows strength... Read More
Don't Ignore This Chart! September 11, 2009 at 11:52 AM
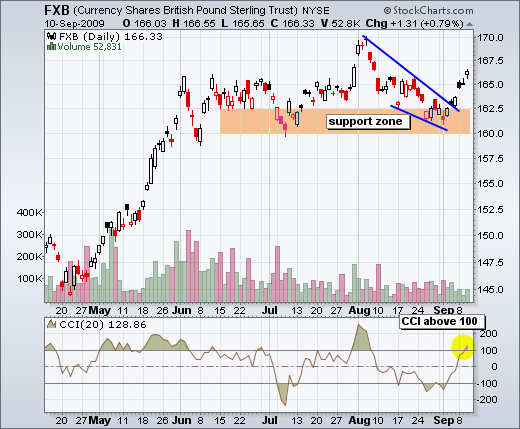
The British Pound ETF (FXB) came across the Commodity Channel Index scan as the indicator surged above 100. While some may consider CCI overbought when above 100, it is also a show of strength when CCI moved from -100 to +100 in less than two weeks... Read More
Don't Ignore This Chart! September 10, 2009 at 12:54 PM
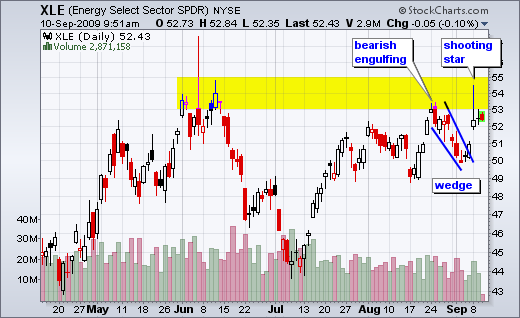
The Energy SPDR (XLE) broke above wedge resistance with a big gap on Tuesday, but formed a shooting star candlestick on the day. Notice the spike and failure to hold above 54 intraday. Resistance in the 53-55 area is also confirmed by a bearish engulfing in late August... Read More
Don't Ignore This Chart! September 09, 2009 at 11:31 AM
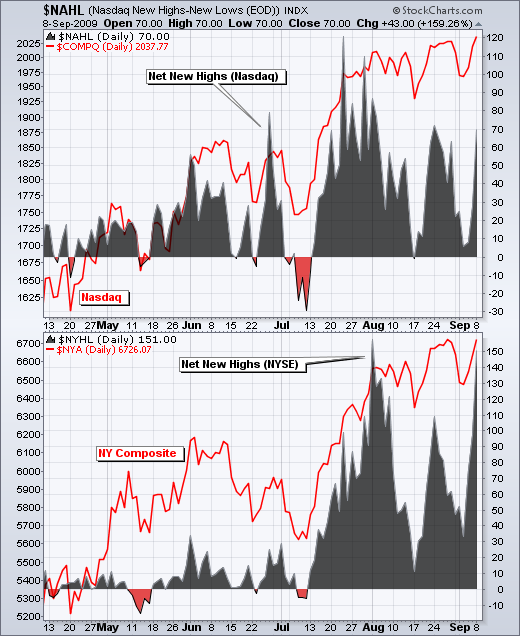
Net New Highs for both the Nasdaq and the NYSE remain positive. Net New Highs equals new 52-week highs less new 52-week lows. The last dip into negative territory occurred in early July... Read More
Don't Ignore This Chart! September 08, 2009 at 08:04 PM
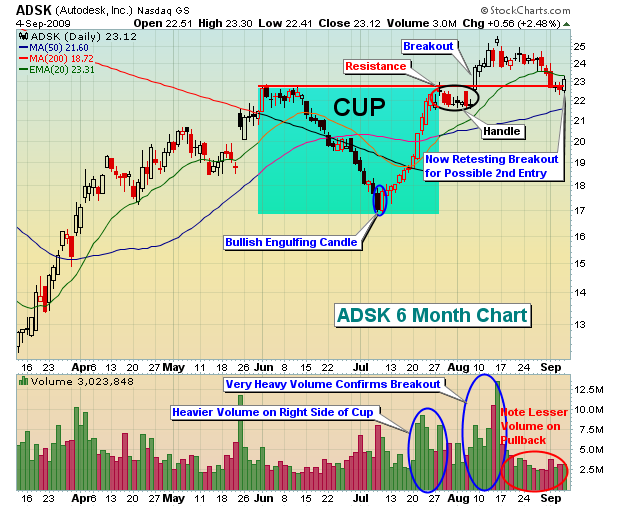
The cup with handle formation is a powerful continuation pattern. A prior uptrend must exist in order to rely on the cup with handle pattern. Below are two examples of cup with handle patterns that show the cup formation and the powerful breakout moves... Read More
Don't Ignore This Chart! September 08, 2009 at 12:15 PM
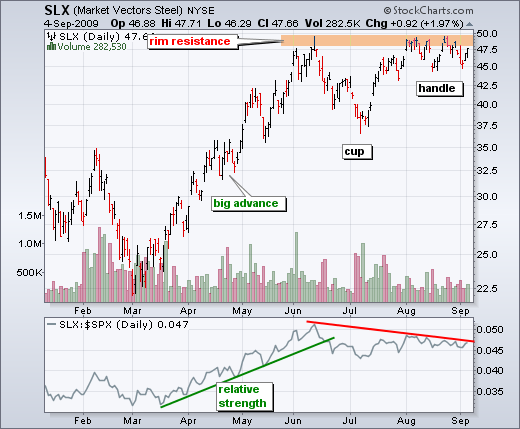
After a big advance from March to June, the Market Vectors Steel ETF (SLX) formed a classic cup-with-handle pattern. This is a bullish continuation pattern that would be confirmed with a break above rim resistance... Read More
Don't Ignore This Chart! September 04, 2009 at 12:28 PM
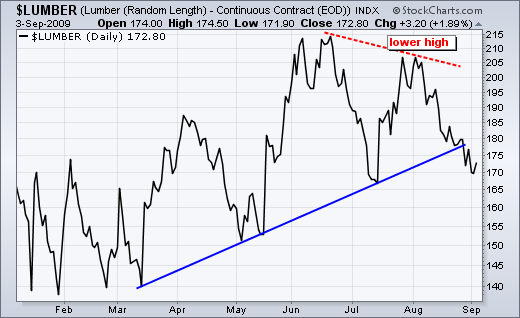
Lumber Continuous Futures ($LUMBER) did not have a good August. Lumber formed a lower high in early August and moved lower throughout the month. As a key component in housing, lumber should be watched for clues on the homebuilders and the economy... Read More
Don't Ignore This Chart! September 03, 2009 at 01:24 PM
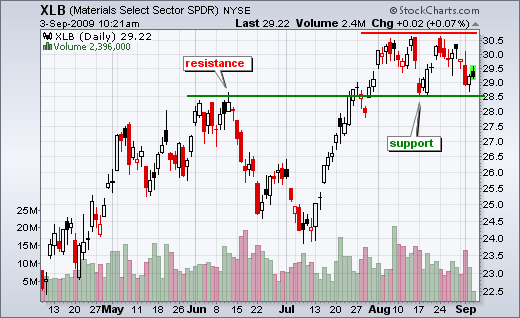
After breaking above resistance in July, the Materials SPDR (XLB) moved into a holding pattern as broken resistance turned into support. Notice how the ETF bounced off 28.5 in mid August and is testing this level again in early September. A move below support would show weakness... Read More
Don't Ignore This Chart! September 02, 2009 at 05:19 PM
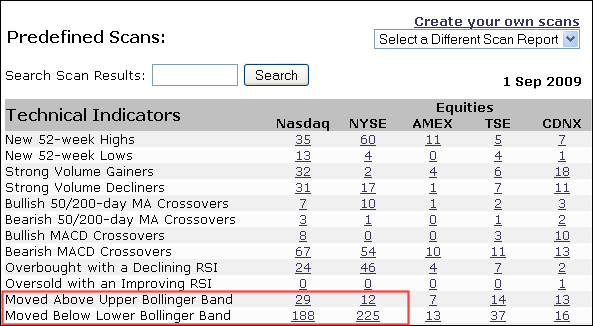
Stockcharts.com provides a number of pre-defined scans using classic indicators. In particular, I always keep an eye on the Bollinger Band scan that shows stocks moving above their upper band and stocks moving below their lower band... Read More
Don't Ignore This Chart! September 01, 2009 at 02:19 PM
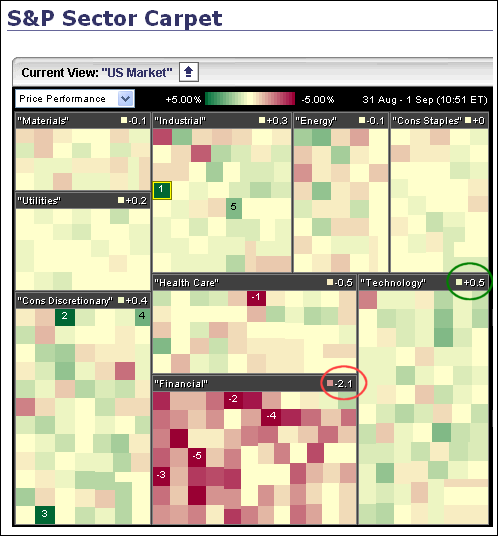
A look at the Market Carpet on Tuesday (11AM ET) shows the finance sector with the most red. In addition, four of the top five losers in the S&P 500 come from the finance sector. Notice the numbered red squares (2-5)... Read More