Don't Ignore This Chart! April 30, 2010 at 07:02 AM
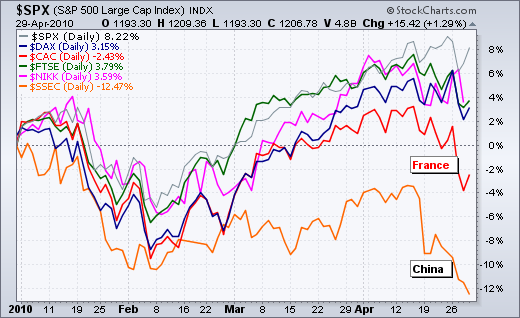
The French CAC 40 ($CAC) and the Shanghai Composite ($SSEC) are down year-to-date and lagging other world indices. In contrast, the Nikkei 225 ($NIKK) is up 3.59% this year and the S&P 500 is leading with a 8.22% gain this year... Read More
Don't Ignore This Chart! April 29, 2010 at 02:34 PM
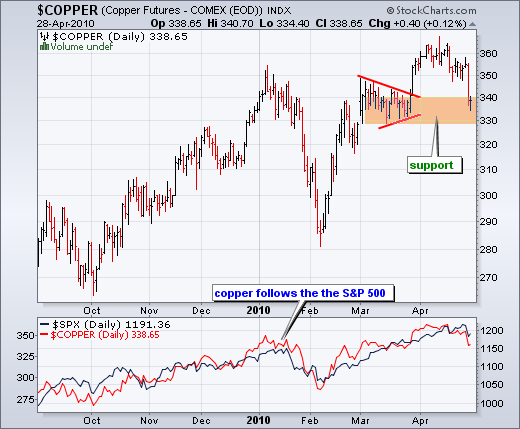
Copper ($COPPER) fell with the stock market over the last two weeks. And like the stock market, copper firmed on Wednesday with a support zone around 330-340. The indicator window shows copper with the S&P 500... Read More
Don't Ignore This Chart! April 28, 2010 at 08:35 PM
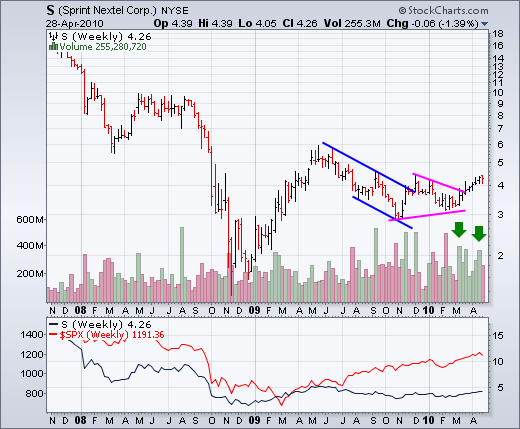
Sprint (S) advanced the last seven weeks and broke triangle resistance in the process. This is the longest weekly string in over 2 1/2 years. Volume has been pretty impressive too... Read More
Don't Ignore This Chart! April 27, 2010 at 07:22 AM
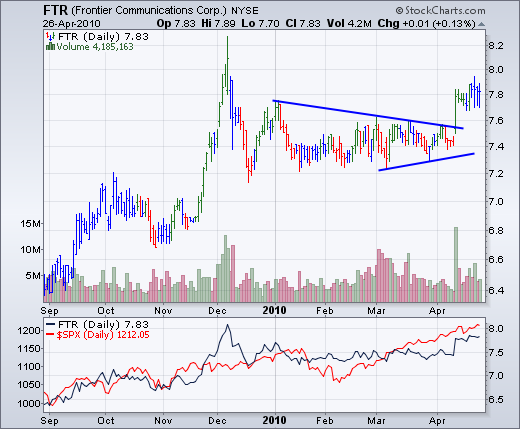
Frontier Communications (FTR) broke consolidation resistance with a surge above 7.6 in early April. Notice that this surge occurred with a green price bar, which indicates an upturn in the Elder Impulse System. The bars are currently blue as the stock consolidates... Read More
Don't Ignore This Chart! April 26, 2010 at 08:48 PM
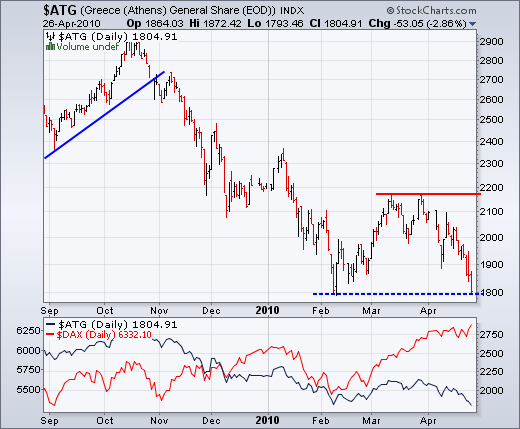
Despite a potential rescue package from the EU and IMF, the Athens General Index ($ATG) fell rather sharply over the last three days and is testing its February low. Greek equities are not impressed... Read More
Don't Ignore This Chart! April 23, 2010 at 06:52 PM
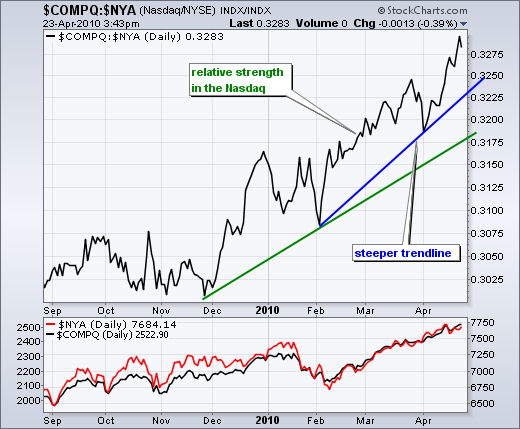
The Nasdaq has been outperforming the NY Composite since December and outperformance is accelerating. The green trendline defines the first rate of outperformance. The blue trendline, which is steeper, defines the second rate of outperformance... Read More
Don't Ignore This Chart! April 22, 2010 at 05:18 PM
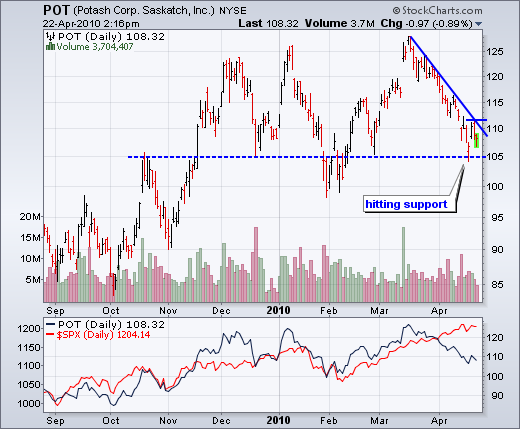
After a sharp decline the last five weeks, Potash (POT) hit support last week and bounced this week. A nice three candlestick reversal formed Thursday-Friday-Monday, but the stock fell back on Tuesday-Wednesday... Read More
Don't Ignore This Chart! April 21, 2010 at 04:02 PM
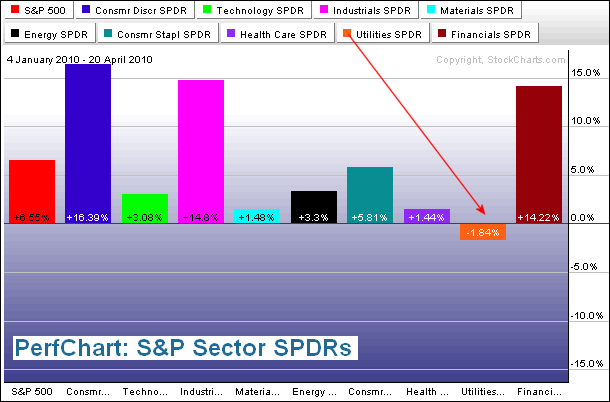
The Utilities SPDR (XLU) is not partaking in the 2010 market advance. While the S&P 500 is up over 6% year-to-date, the defensive oriented XLU is down almost 2%. It is the only sector sporting a loss this year... Read More
Don't Ignore This Chart! April 20, 2010 at 05:15 PM
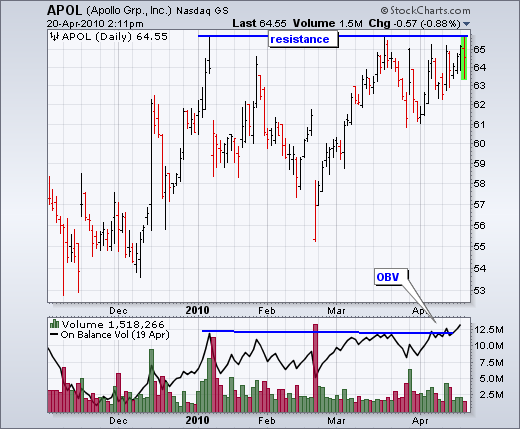
The chart for Apollo Group (APOL) sports a consolidation pattern that looks like an inverse head-and-shoulders. Resistance in the 65-66 area stems from reaction highs in January-March as well as the consolidation in April. A break above these highs would be bullish... Read More
Don't Ignore This Chart! April 19, 2010 at 07:01 PM
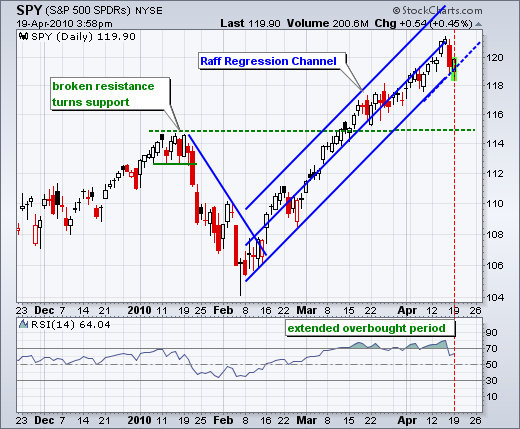
After a sharp decline on Friday and further weakness early Monday, the S&P 500 ETF (SPY) recovered and managed to firm at the Raff Regression Channel. This channel defines the current advance and a break below would call for a re-evaluation of this uptrend... Read More
Don't Ignore This Chart! April 16, 2010 at 01:10 PM
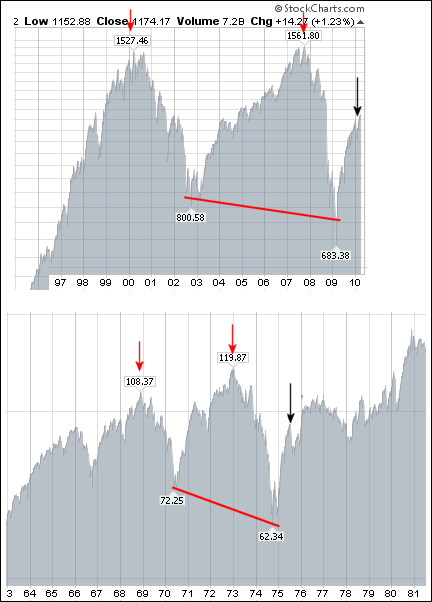
From the historical charts at Stockcharts.com, we have cutouts of two large trading ranges. The S&P 500 was largely range bound from the mid 60s to the late 70s (~15 years) and from the late 90s until the present (~13 years)... Read More
Don't Ignore This Chart! April 15, 2010 at 12:52 PM
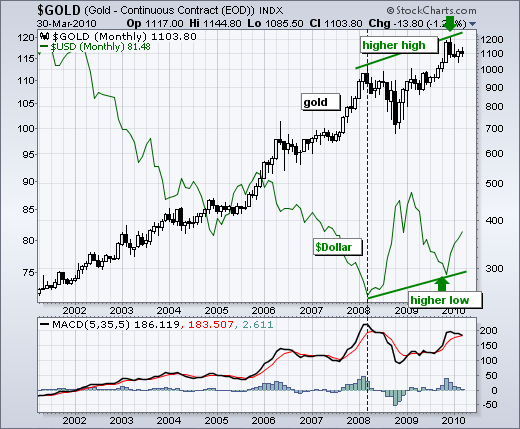
The nine year chart for the US Dollar Index ($USD) and Gold-Continuous Futures ($GOLD) shows a clear inverse relationship from 2002 until 2007. Gold advanced as the Dollar declined... Read More
Don't Ignore This Chart! April 14, 2010 at 12:37 PM
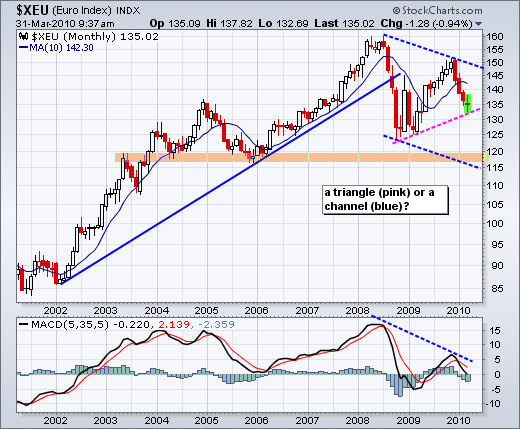
The Euro Index ($XEU) appears to be in a long-term downtrend with the next support zone around 117-120. With a lower high in December, a falling channel is taking shape. The lower trendline extends to 115 and there is support around 117-120 from the 2004-2005 lows... Read More
Don't Ignore This Chart! April 13, 2010 at 12:27 PM
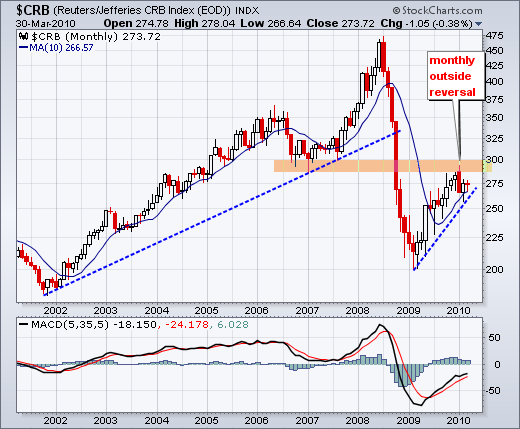
The CRB Index ($CRB) advanced with the stock market in 2009, but hit resistance from broken support and formed a monthly outside reversal. This is also known as a bearish engulfing. The combination of resistance and reversal could cap this rally... Read More
Don't Ignore This Chart! April 12, 2010 at 12:18 PM
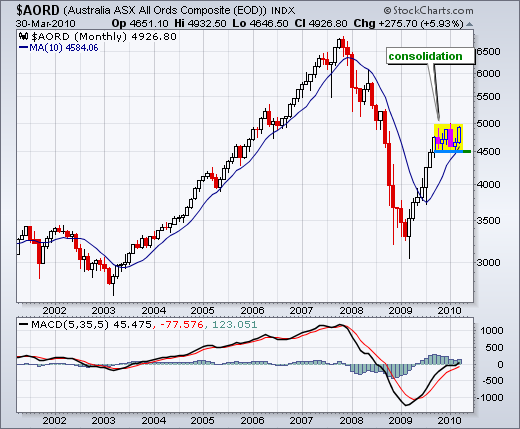
The Australian All Ords Composite ($AORDS) has been rallying with the rest of the world over the last 14 months. With a stall around 4500-5000 the last six months, the index established support at 4500. "No worries" for the bulls as long as this support level holds... Read More
Don't Ignore This Chart! April 09, 2010 at 12:15 PM
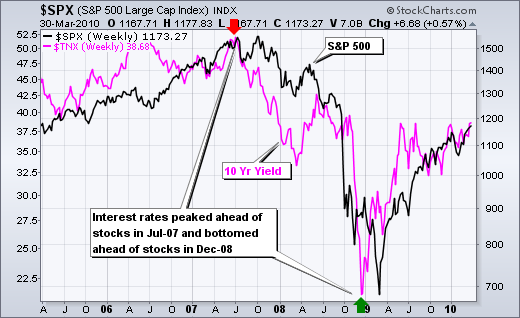
Are rising rates bullish or bearish for the stock market? Those answering bearish may want to consider the chart below. Over the last five years, there appears to be a positive correlation between the 10-Year Treasury Yield ($TNX) and the S&P 500. Both rise and fall together... Read More
Don't Ignore This Chart! April 08, 2010 at 12:13 PM
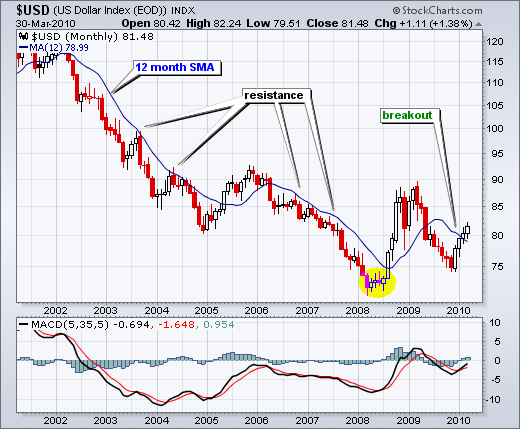
The 12-month SMA provides a pretty good clue on the overall direction for the US Dollar Index ($USD). There have been six crosses since 2002. Downside breaks captured long downtrends in 2002-2004 and 2006-2007... Read More
Don't Ignore This Chart! April 07, 2010 at 12:10 PM
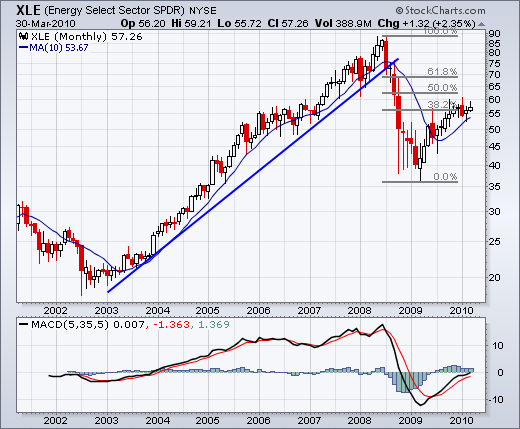
With the advance over the last 13 months, the Energy SPDR (XLE) and the Utilities SPDR (XLU) retraced less than 50% of the prior declines... Read More
Don't Ignore This Chart! April 06, 2010 at 12:07 PM
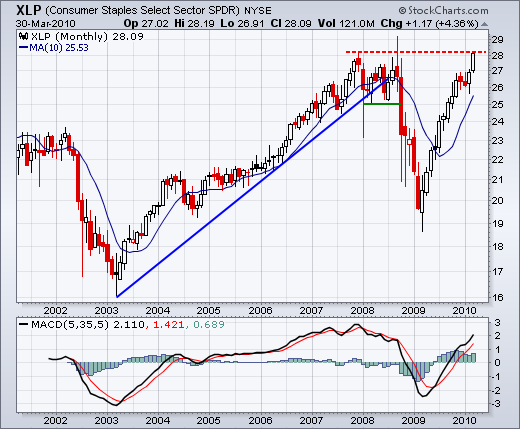
The Consumer Staples SPDR (XLP) is the only one of the nine sector SPDRs challenging its 2007 high. The other 8 sector SPDRs are not even close... Read More
Don't Ignore This Chart! April 05, 2010 at 12:05 PM
With the massive rally over the last 13 months, the Russell 2000 ETF (IWM) hit levels note seen since Lehman brothers dominated the news. IWM was trading in the 63-75 range just before the Lehman bankruptcy and is nearing 70. This area could mark resistance... Read More
Don't Ignore This Chart! April 01, 2010 at 02:40 PM
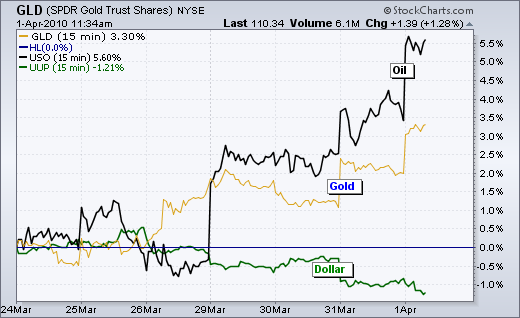
Weakness in the Dollar over the last few days spurred buying in gold and oil. The chart below shows the Gold ETF (GLD), US Oil Fund ETF (USO) and DB Dollar Bullish ETF (UUP) over the last seven days. Gold took off first with a move on March 26th... Read More
Don't Ignore This Chart! March 31, 2010 at 08:16 PM
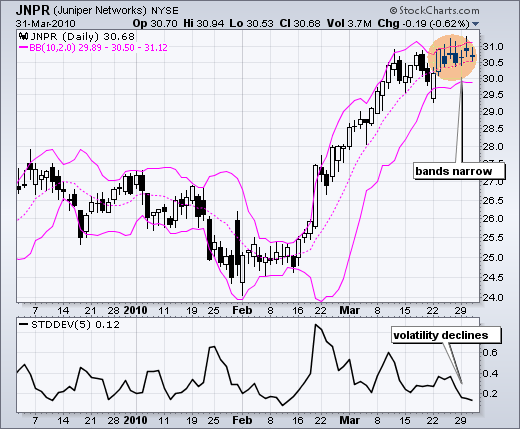
After surging above 30 in early March, Juniper slowed to a crawl the last six days. Notice that Bollinger Bands (10,2) are contracting and the Standard Deviation is at its lowest point since early February, which is when the surge started... Read More