Don't Ignore This Chart! May 28, 2010 at 09:23 AM
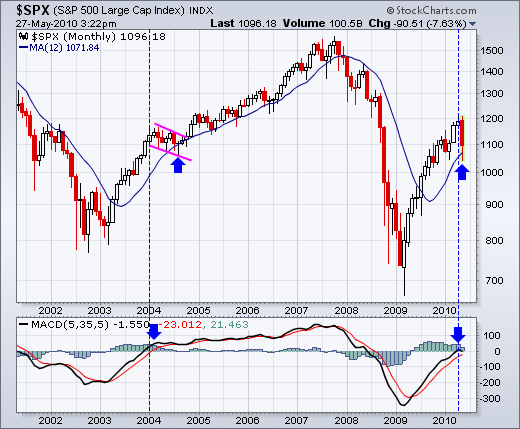
With the May decline, the S&P 500 tested the rising 12-month moving average for the first time since breaking above in July. Also notice that MACD (5,35,5) turned positive for the first time since the first half of 2008... Read More
Don't Ignore This Chart! May 27, 2010 at 07:07 AM
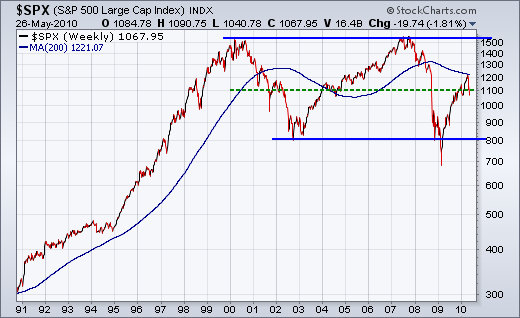
Talk about the lost decade. With the May decline, the S&P 500 is trading in the middle of its 10 year range. Note that this is a semi-log scale that reflects percentage change. We are looking at the mother of all consolidations... Read More
Don't Ignore This Chart! May 26, 2010 at 09:02 PM
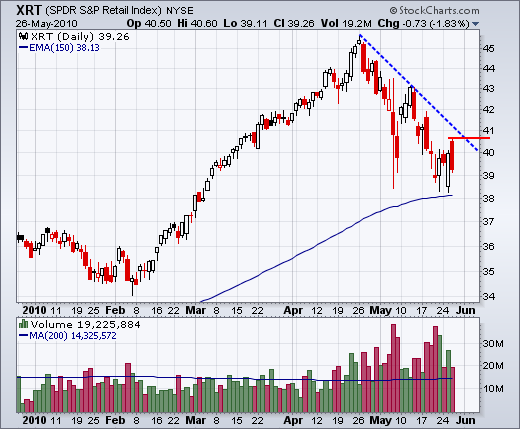
The Retail SPDR (XRT) is finding support just above the rising 150-day EMA with two white candlesticks in the last four days. There was a follow through attempt on Wednesday, but the ETF closed weak to establish resistance instead... Read More
Don't Ignore This Chart! May 26, 2010 at 01:15 PM
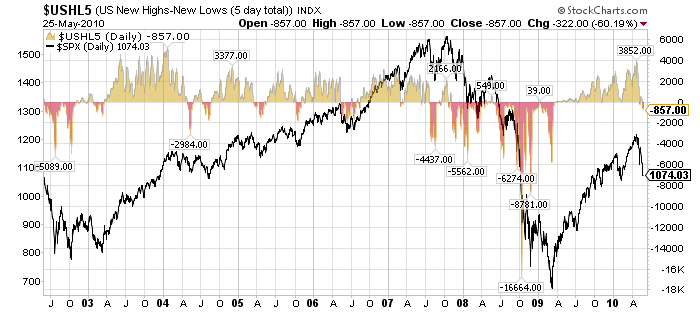
Here's a 8 year look at a new market indicator that we just added to the website - the "Weekly New High - New Low Index" popularized by Dr. Alexander Elder in his books. Click here for a live version of this chart... Read More
Don't Ignore This Chart! May 24, 2010 at 08:36 PM
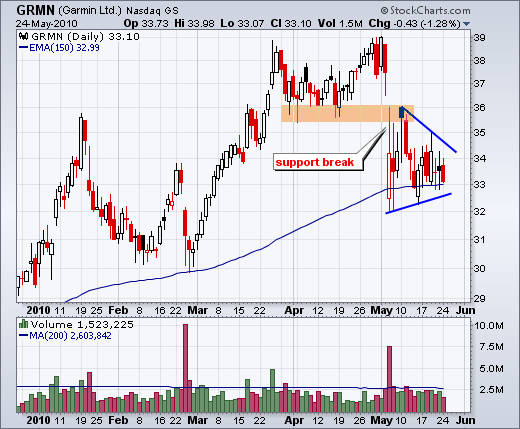
After a gap down and sharp decline in early May, Garmin (GRMN) formed a triangle consolidation the last few weeks. The gap and support break around 36 are bearish. A break below triangle support would signal a continuation of this decline... Read More
Don't Ignore This Chart! May 21, 2010 at 09:02 AM
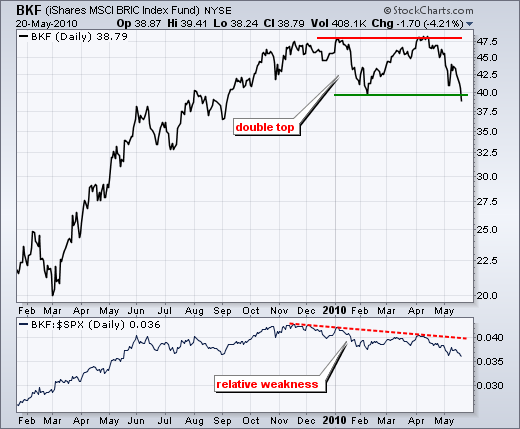
The BRIC ETF (BKF) has a large double top working over the last 6-9 months. With the April-May decline, the ETF broke support from the February low to confirm this pattern. Based on traditional technical analysis, the projected decline is to the low 30s... Read More
Don't Ignore This Chart! May 20, 2010 at 02:27 PM
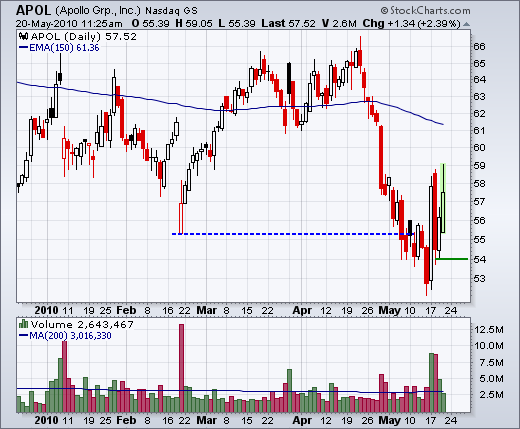
With the stock market down sharply in early trading on Thursday, Apollo Group (APOL) sticks out a like a sore thumb with a 2+ percent gain. The stock appeared to break support last week, but recovered with a high volume surge on Monday... Read More
Don't Ignore This Chart! May 19, 2010 at 08:18 PM
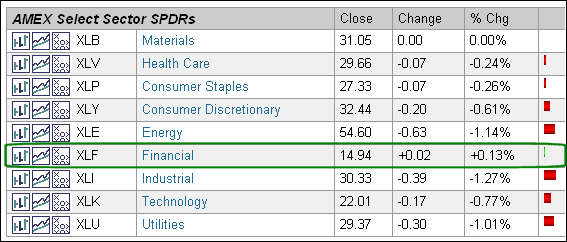
Stocks were mostly lower on Wednesday, but the Financials SPDR (XLF) managed a small gain. A snapshot from the Market Summary page shows the nine sector SPDRs. XLF is the only gainer as the ETF test the early May lows... Read More
Don't Ignore This Chart! May 18, 2010 at 04:44 PM
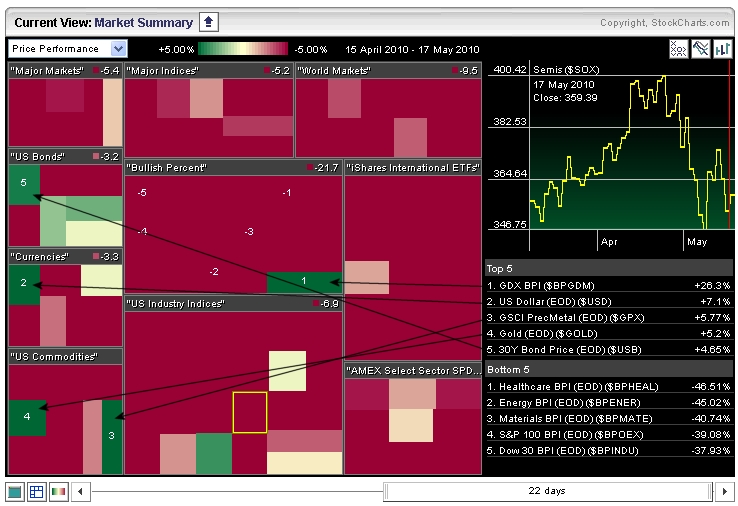
The Market Summary can be viewed as a web page or as a Market Carpet. The snapshot below shows the Market Summary Carpet over the last 22 days (one month). There are a few green spots and lots of red... Read More
Don't Ignore This Chart! May 17, 2010 at 12:55 PM
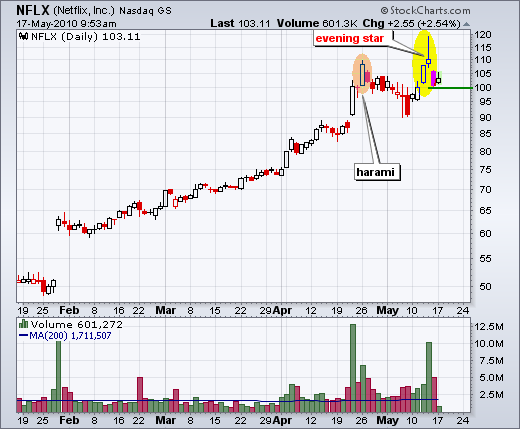
Netflix (NFLX) is up over 100% from its January lows, which makes it one of the top performers this year. However, signs of selling pressure are starting to creep in. First, the stock formed a bearish harami in late April and declined to 90... Read More
Don't Ignore This Chart! May 14, 2010 at 12:56 PM
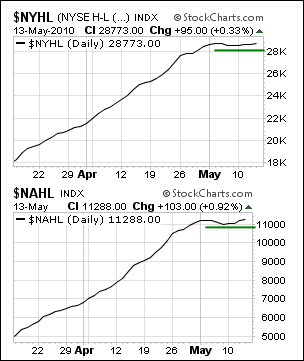
From the breadth charts page, users can get a glimpse of the AD Lines and cumulative Net New Highs lines for the NYSE, Nasdaq and Amex. The image below shows the cumulative Net New Highs lines for the NYSE and Nasdaq... Read More
Don't Ignore This Chart! May 13, 2010 at 02:06 PM
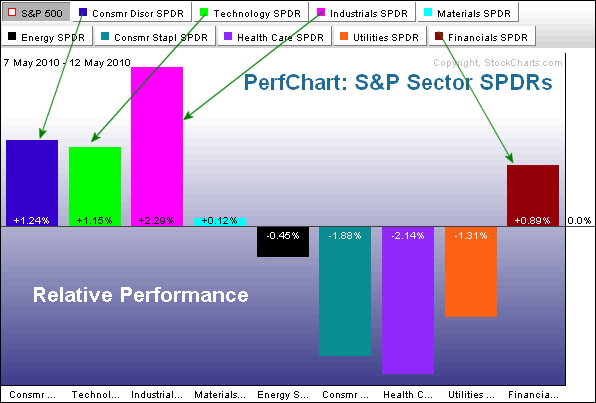
Last week was all about safety. This week is all about risk. The Sector PerfChart shows the offensive sectors outperforming the defensive sectors over the last four trading days. All sectors are up on an absolute basis... Read More
Don't Ignore This Chart! May 12, 2010 at 09:04 PM
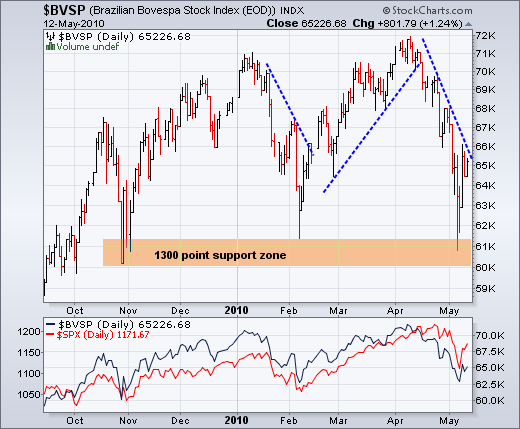
The Brazilian Bovespa Index ($BVSP) is testing support in the 62,000 area. There is a support zone from 60,000 to 61,300 that extends back to the late October low. The index has been swinging from this support zone to a resistance zone in the low 70,000 area... Read More
Don't Ignore This Chart! May 10, 2010 at 01:40 PM
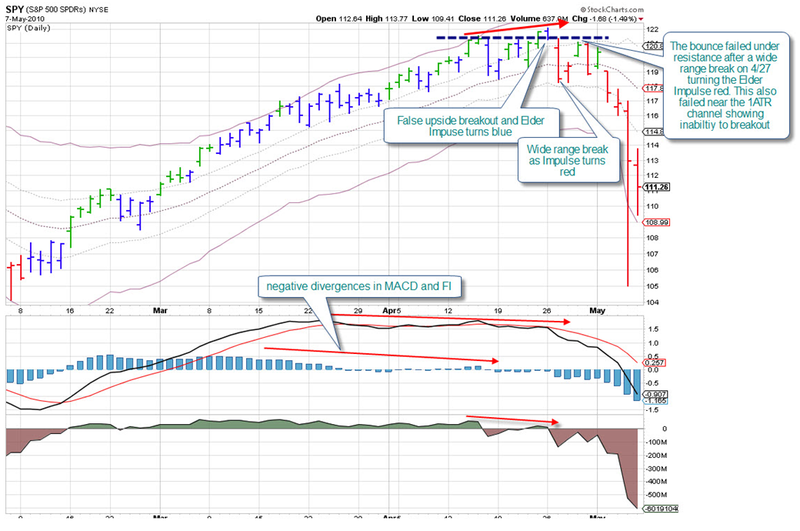
Alexander Elder and his partner Kerry Lovvorn put together this chart analysis of last week's market action: Click here for a live version of this chart. The chart uses our new version of Dr. Elder's Impulse Trading System to color the bars... Read More
Don't Ignore This Chart! May 07, 2010 at 06:20 PM
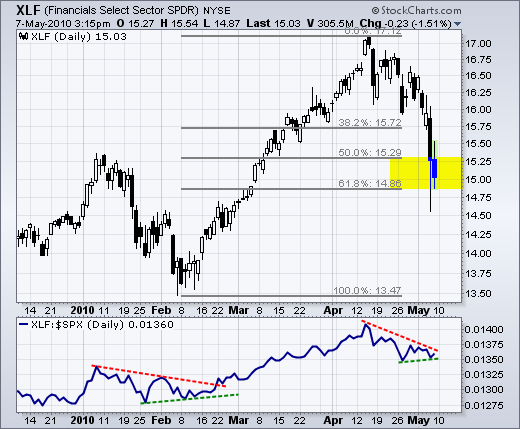
With a sharp decline the last four days, the Financials SPDR (XLF) entered a key retracement zone that may offer support. The area around 14.86-15.29 marks a 50-62% of the February-April rally. XLF is also oversold after a 12% decline in four weeks... Read More
Don't Ignore This Chart! May 06, 2010 at 09:45 PM
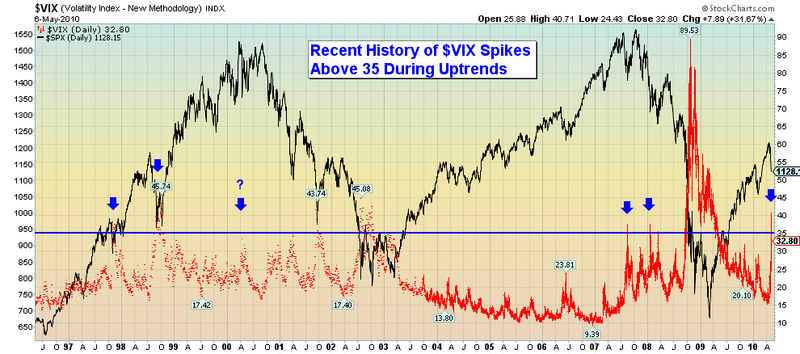
Today's wild day cause the Volatility Index ($VIX) to spike up above 35 for the first time during the current market uptrend. The follow chart shows what the market has done in the past when that signal has occurred: Click here for a live version of this chart... Read More
Don't Ignore This Chart! May 06, 2010 at 05:33 PM
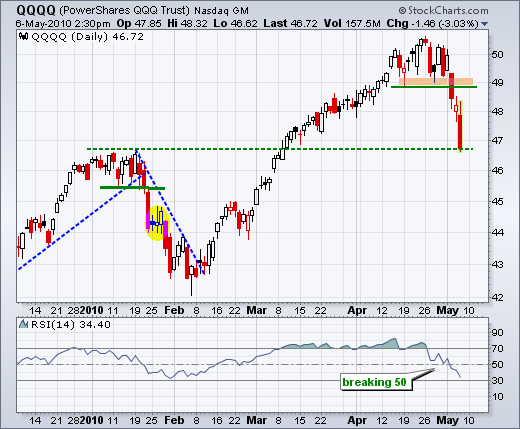
The Nasdaq 100 ETF (QQQQ) is gearing up for the first test since the support break at 49. With a decline back to 46.70, the ETF is now back to broken resistance from the January highs... Read More
Don't Ignore This Chart! May 05, 2010 at 08:49 PM
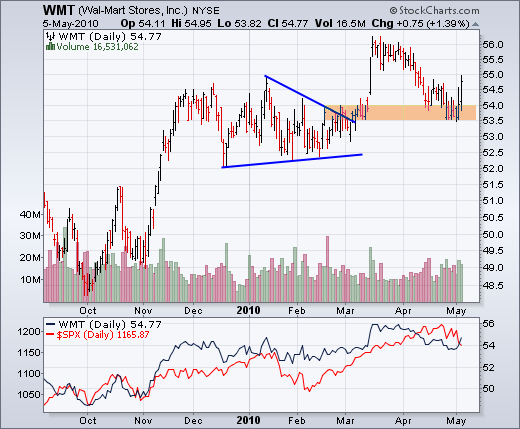
Despite a sharp decline in the stock market on Tuesday, Wal-mart managed a small gain near support and then surged on Wednesday with pretty good volume. This stock is a big part of the consumer staples sector... Read More
Don't Ignore This Chart! May 04, 2010 at 07:09 AM
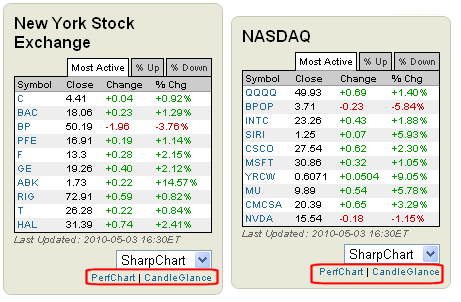
The most active lists for Monday show 9-1 winners-losers for the NYSE and 8-2 for the Nasdaq. This table is updated throughout the day on the Free Charts page. Users can even click the CandleGlance link to see 10 small charts of these most active stocks... Read More
Don't Ignore This Chart! May 03, 2010 at 07:55 AM
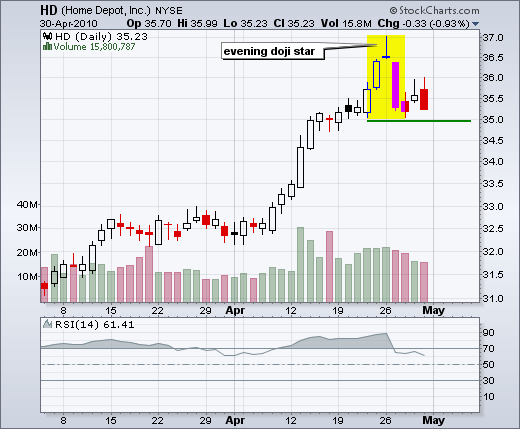
Home Depot formed a rare evening doji star last week. Note the long white candlestick and surge above 36, the gravestone doji with the gap up and the long red candlestick last Monday. Also note the gaps on either side of the gravestone doji... Read More