Don't Ignore This Chart! July 30, 2010 at 09:08 AM
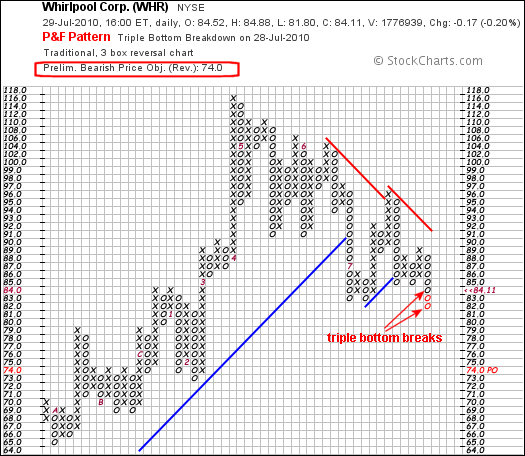
Whirlpool (WHR) came across the triple bottom break scan. The stock is in a clear downtrend with lower lows and lower highs since May. WHR broke triple bottom support twice in the next few days and the downside price objective is 74... Read More
Don't Ignore This Chart! July 29, 2010 at 02:49 PM
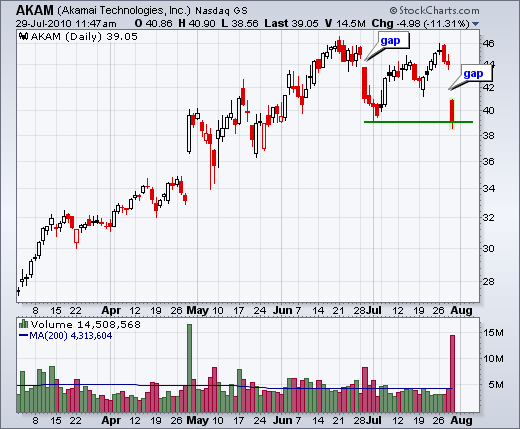
For the second time in two months, Akamai (AKAM) gapped down from resistance at 46. The stock first hit resistance here in mid June and gapped down in late June. AKAM moved back to resistance in July, but failed again with another gap and high-volume decline... Read More
Don't Ignore This Chart! July 28, 2010 at 07:42 AM
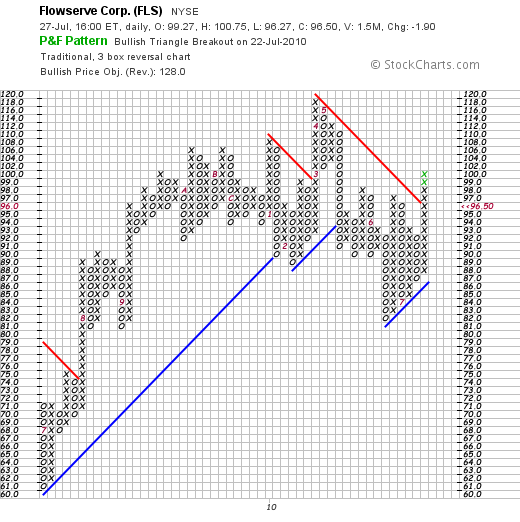
Flowserve (FLS) came across the bullish triangle alert page from the P&F pattern scans. On the P&F chart, notice how the stock broke above the bearish resistance line with a surge above 98... Read More
Don't Ignore This Chart! July 27, 2010 at 09:00 AM
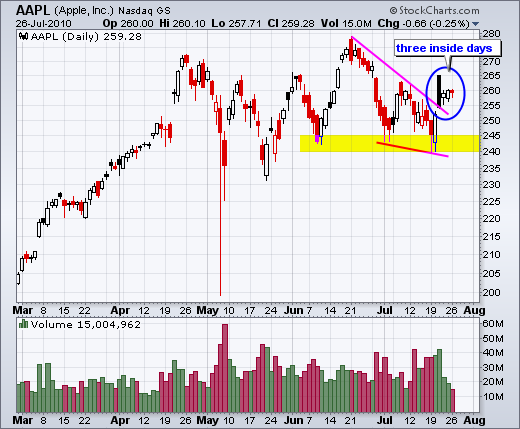
While the market continued higher the last three days, Apple (AAPL) stalled with three inside days. This stall comes after last week's wedge breakout, which is still holding. A move below last week's gap (252) would negate the breakout... Read More
Don't Ignore This Chart! July 26, 2010 at 08:42 AM
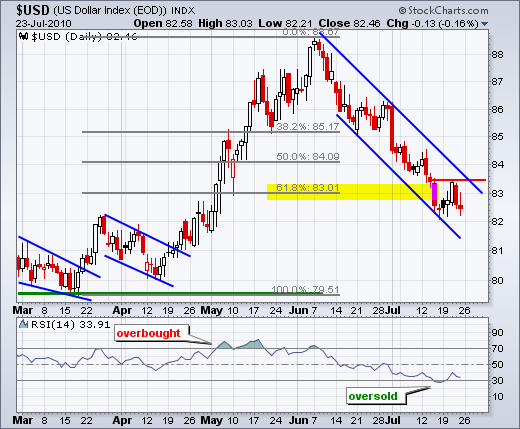
The US Dollar Index ($USD) became oversold as RSI moved below 30 last week. In addition, notice that the index has retraced just over 62% of the March-June advance... Read More
Don't Ignore This Chart! July 23, 2010 at 11:55 AM
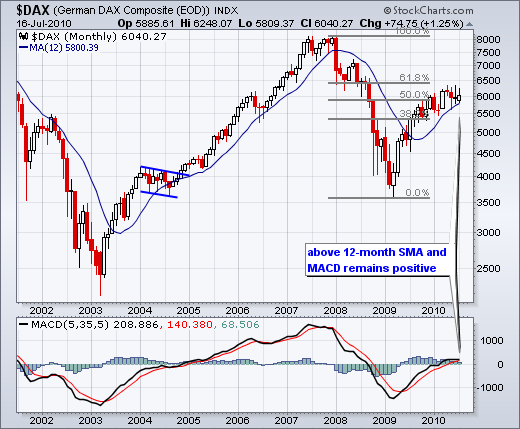
Despite all the troubles in Europe, the German DAX ($DAX) remains in a uptrend since March 2009 and has yet to roll over. The index is above its 12-month moving average and MACD(5,35,5) is positive... Read More
Don't Ignore This Chart! July 22, 2010 at 11:54 AM
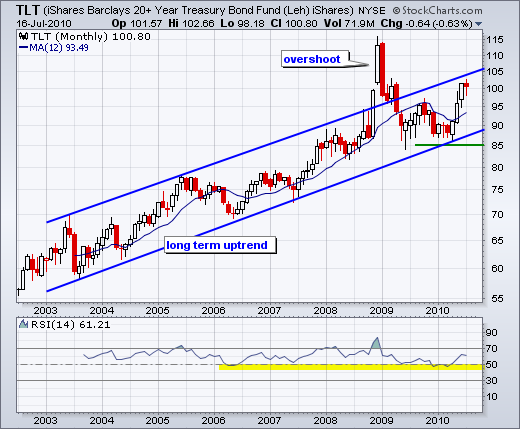
The 20+ Year T-Bond ETF (TLT) continues to trend higher within a large rising price channel. The ETF surged above the channel during the finance crisis of 2008, but returned to this channel in 2009 and resumed its rise in 2010. Long-term support is set at 85... Read More
Don't Ignore This Chart! July 21, 2010 at 12:00 PM
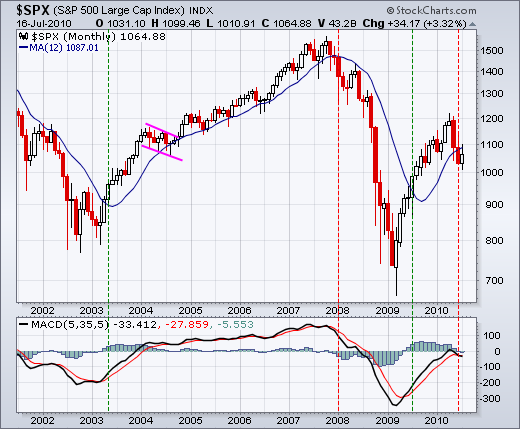
The monthly chart below shows the S&P 500 holding its 12-month moving average throughout long-term moves over the last 9 years. A decisive close above or below this 12-month moving average has been indicative of a long-term trend change, which occurred last month... Read More
Don't Ignore This Chart! July 20, 2010 at 06:50 AM
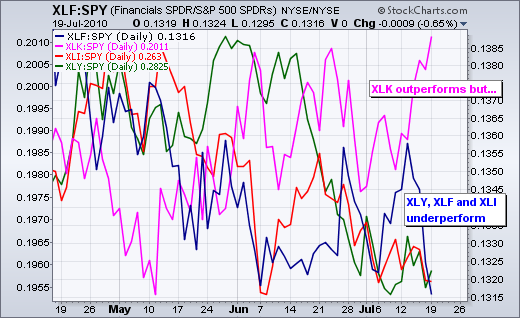
Believe it or not, the Technology SPDR (XLK) is outperforming the S&P 500 ETF (SPY) in July... Read More
Don't Ignore This Chart! July 19, 2010 at 06:11 PM
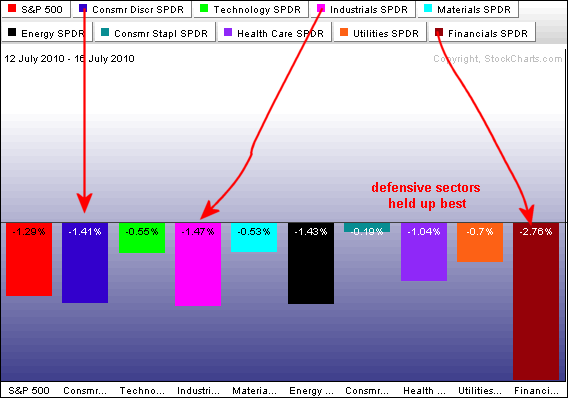
The PerfChart below shows the percentage change for the nine sector SPDRs over the last five days (last week). Stocks were holding up well until Friday... Read More
Don't Ignore This Chart! July 16, 2010 at 08:24 AM
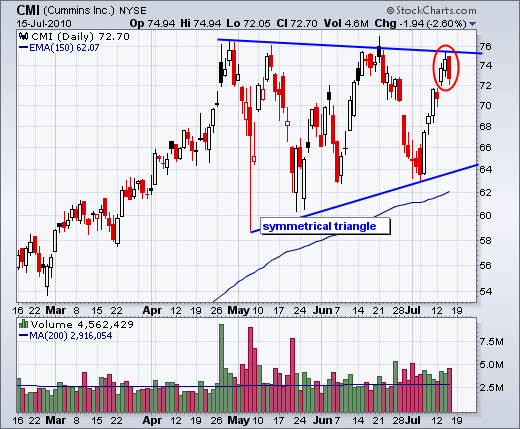
Cummins Engine came across the bearish engulfing scan as it opened strong and closed weak near resistance. The stock failed in the 74-76 area in April, May and June. July marks the fourth attempt... Read More
Don't Ignore This Chart! July 15, 2010 at 07:28 AM
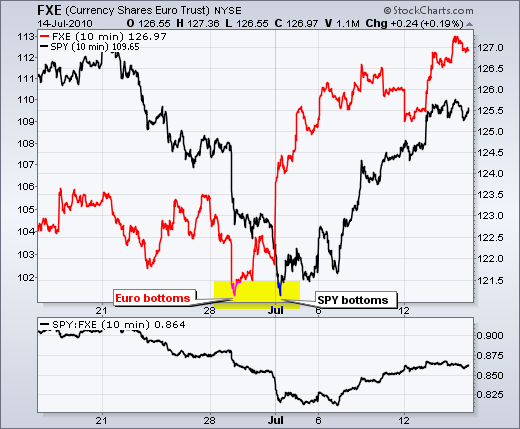
There was a little delay, but the positive correlation between the Euro the US stocks remains in place. The Euro ETF (FXE) bottomed on June 29 and SPY bottomed two days later. FXE surged in early July and SPY followed the Euro high the second week of July... Read More
Don't Ignore This Chart! July 14, 2010 at 02:07 PM
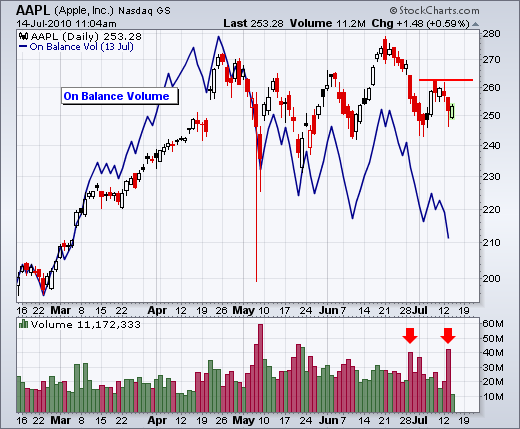
The Apple chart shows signs of increased selling pressure with a steady decline in On Balance Volume (OBV) the last 2-3 months. OBV peaked in mid April, formed a lower high in late June and moved to new lows in July... Read More
Don't Ignore This Chart! July 12, 2010 at 01:27 PM
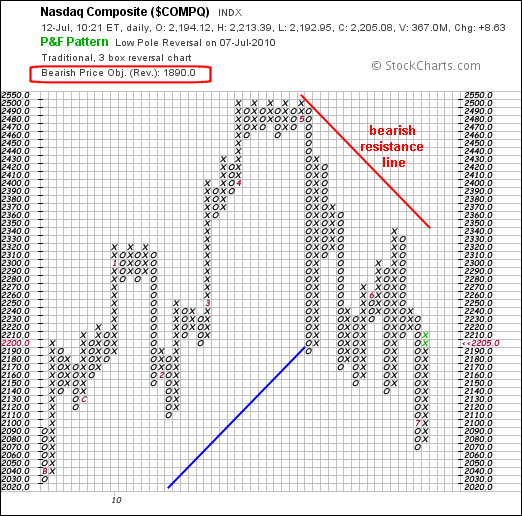
The Nasdaq Point & Figure chart sports a clear downtrend with a bearish resistance line and a downside price objective around 1900. According to this chart, the trend will remain down until there is a break above the bearish resistance line, which is currently around 2345... Read More
Don't Ignore This Chart! July 09, 2010 at 09:05 AM
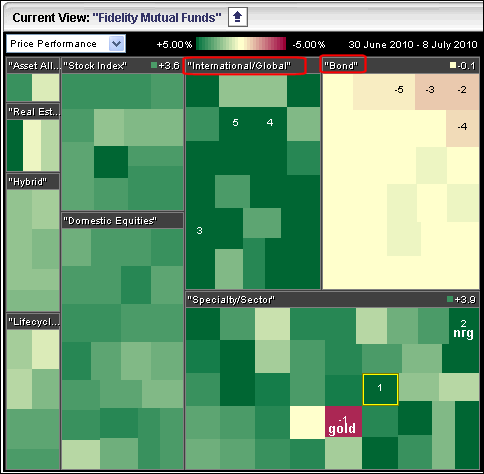
Even if you do not invest in Fidelity Funds, the Fidelity Funds Carpet can be used to find outperforming and underperforming groups. Over the last 6 days, bond funds have been lagging and international funds have been leading... Read More
Don't Ignore This Chart! July 08, 2010 at 06:42 AM
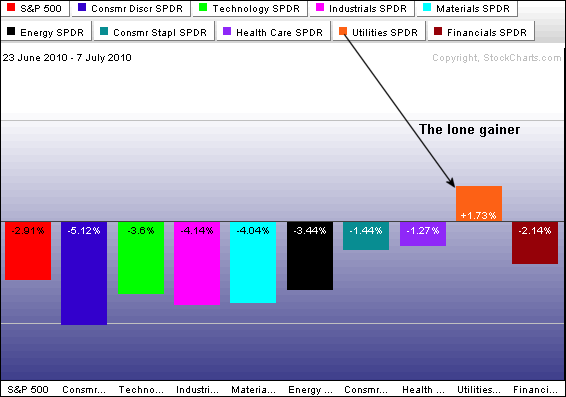
Over the last 10 trading days, the Utilities SPDR (XLU) is the only sector sporting a gain. Utilities show both absolute and relative strength... Read More
Don't Ignore This Chart! July 07, 2010 at 06:18 AM
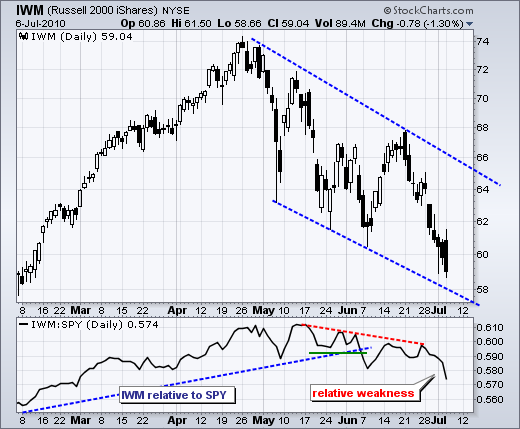
The Russell 2000 ETF (IWM) surged above 61 intraday, but gave up sizable gains and closed near 59. The ETF even closed below last week's low. The indicator window shows the IWM:SPY ratio, which compares small-caps to large-caps... Read More
Don't Ignore This Chart! July 06, 2010 at 07:08 AM
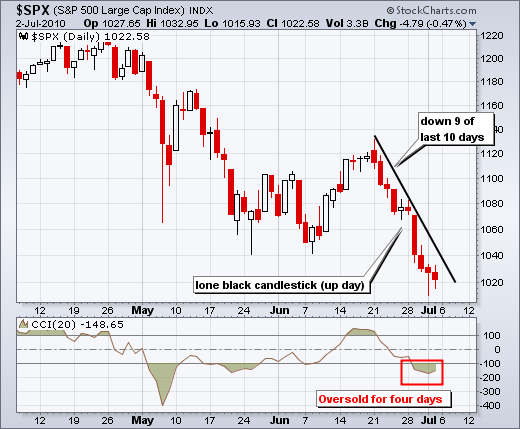
The S&P 500 is now down nine of the last 10 days. Notice the nine red candlesticks and the lone black candlestick. In addition, the Commodity Channel Index (CCI) has been oversold since the decline below 1040... Read More
Don't Ignore This Chart! July 02, 2010 at 07:22 AM
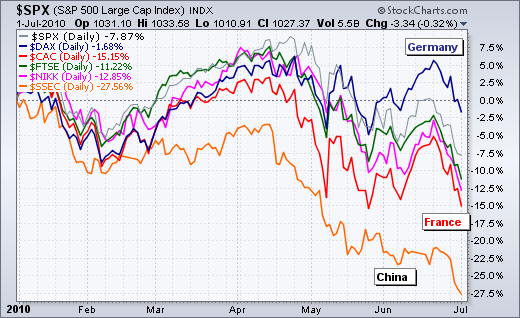
Of the six equity indices shown below, the Shanghai Composite ($SSEC) is the weakest in 2010 with a 27.56% loss (year-to-date). The Nikkei 225 ($NIKK), French CAC 40 ($CAC) and London FTSE ($FTSE) are all down double digits. The S&P 500 is holding up relatively well with a 7... Read More
Don't Ignore This Chart! July 01, 2010 at 09:22 AM
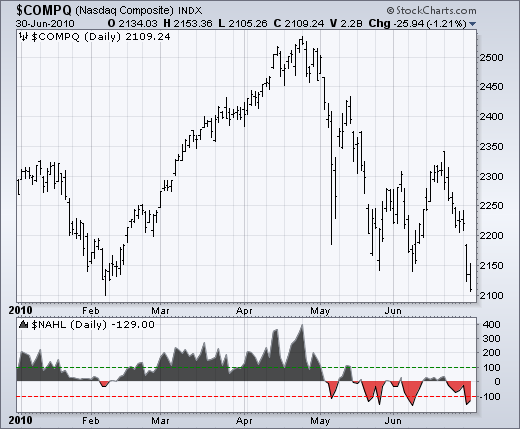
New 52-week lows are expanding on the Nasdaq and new 52-week highs are drying up. Net New Highs (new 52-week highs less new 52-week lows) is an easy way to assess the battle for new 52-week extremes... Read More
Don't Ignore This Chart! June 30, 2010 at 08:09 PM
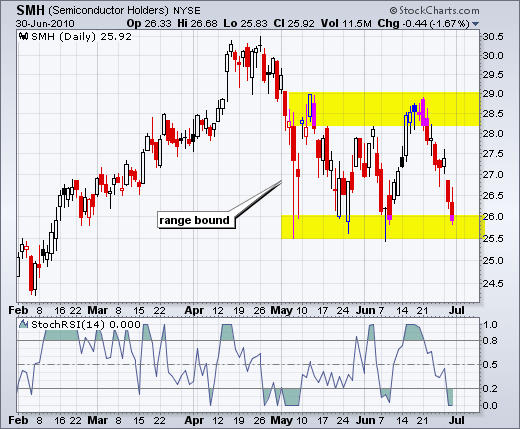
Also known as RSI on steroids, StochRSI is the Stochastic Oscillator applied to RSI values. It becomes overbought and oversold a lot more than both indicators. SMH declined to support in the 25.5-26 area as StochRSI moved below .20 to become oversold... Read More